You can download four high-resolution A3 JPG maps of Moore County, Texas, in one ZIP directly from this page. The package includes a general county map, a Dumas-centered city-connections map, a terrain-and-water map, and an elevation map. Together they show Dumas, Cactus, Sunray, major numbered roads, the North and South Palo Duro Creek systems, Big Blue and Plum creek valleys, small named lakes, and an actual elevation range of about 881 to 1,167 meters.
Dumas is the best starting point because it sits near the west-central part of the county, while Cactus and Sunray form two separate northern settlement references. From Dumas, roads extend toward the north, east, west, and south before entering much more open High Plains country. The water and elevation maps add the county’s strongest physical contrast: broad high surfaces dominate the west and northwest, while the east and especially the southeast are cut by increasingly deep creek valleys.
Table of Contents
Dumas provides the clearest road reference between the northern towns and southern open country
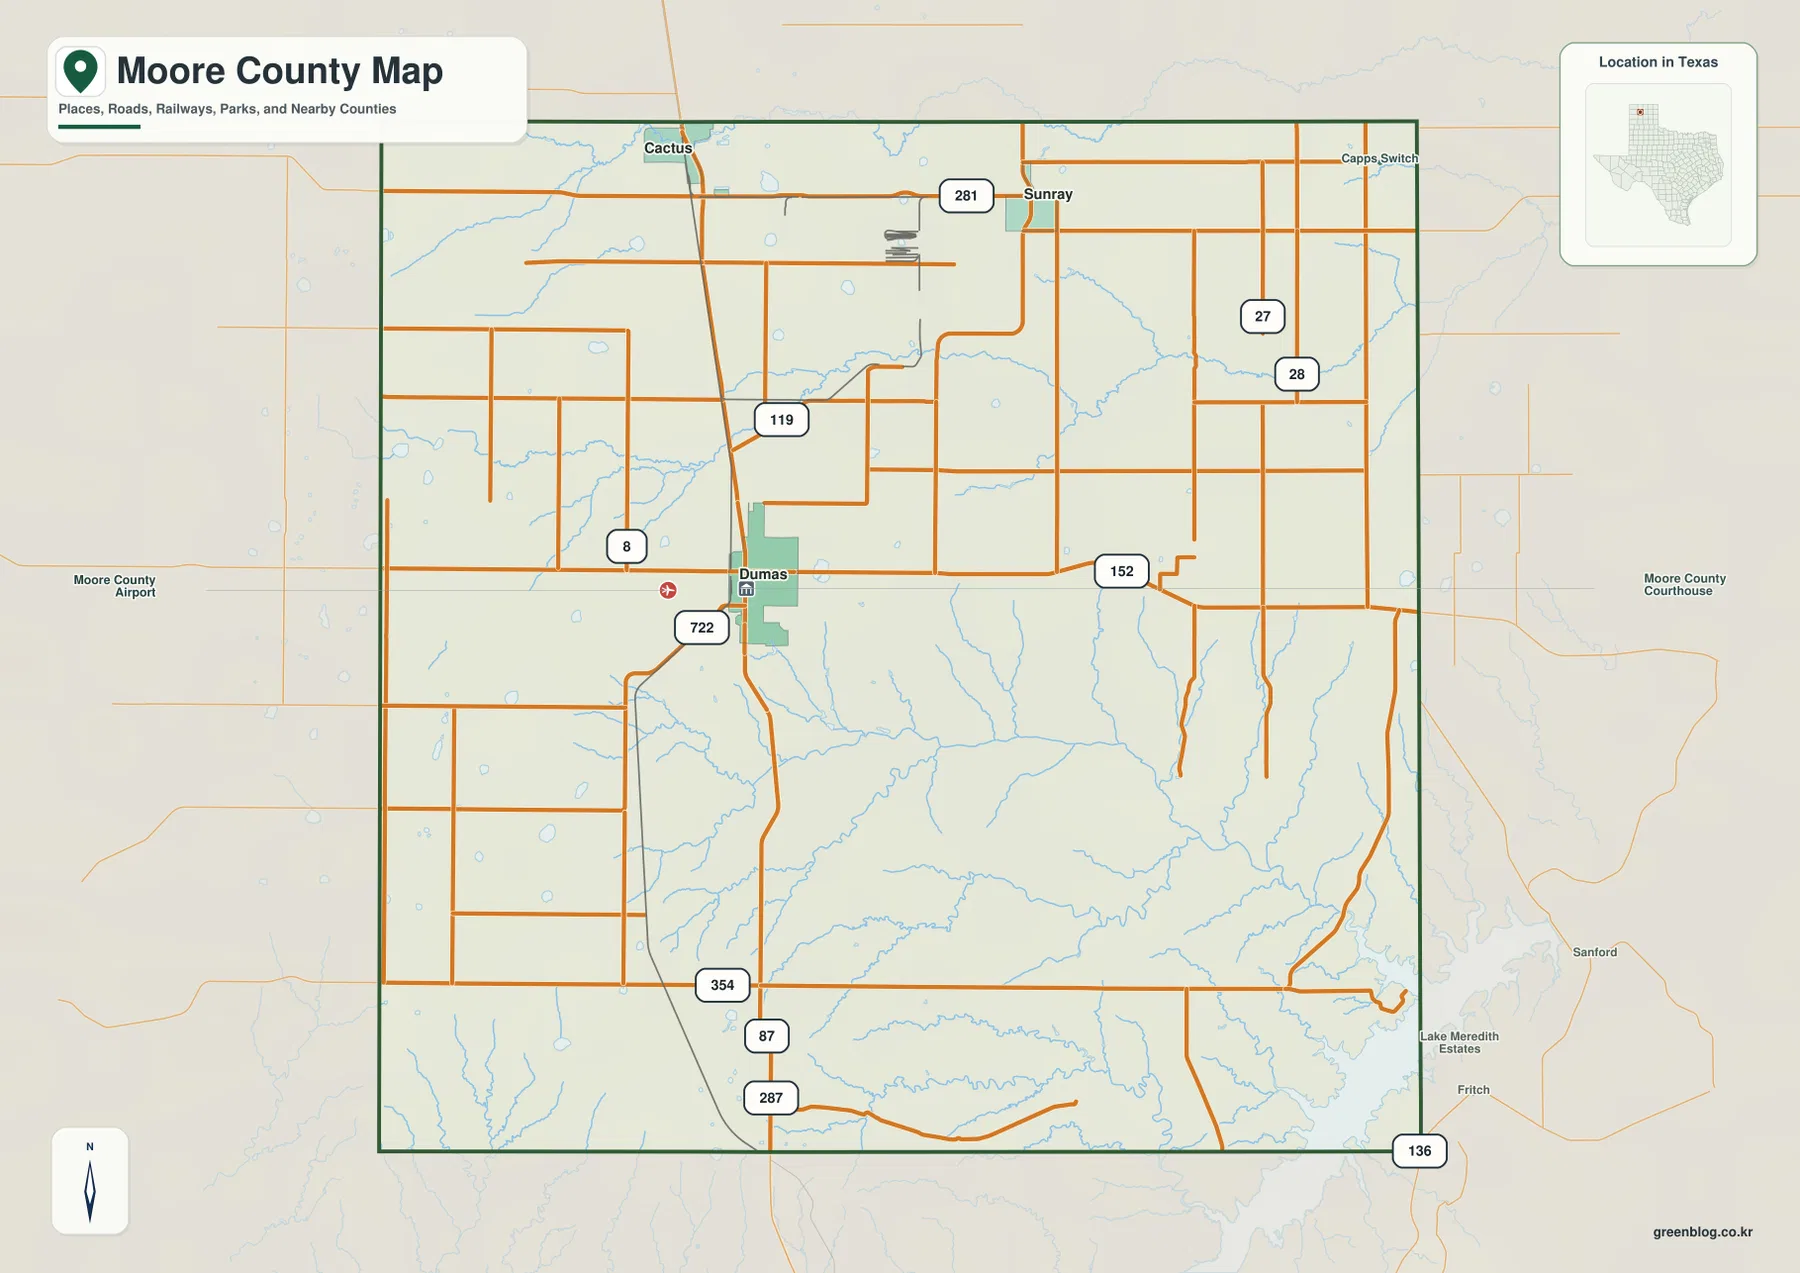
Dumas is the strongest developed place on the general county map. Roads 8 and 722 are labeled close to the city, while Route 119 crosses the county farther north. Route 152 extends east from the Dumas side into a broad interior where settlement labels become sparse. Moore County Airport is shown outside the western side and provides an additional orientation point near the city.
Cactus lies near the northwestern boundary, and Sunray is farther east across the northern interior. Route 281 is labeled around the Sunray side, while roads 27 and 28 provide references in the northeastern quadrant. The spacing among Dumas, Cactus, and Sunray makes it clear that the county’s developed places are separated by large expanses of rural plateau rather than connected as one continuous urban area.
South of Dumas, Route 354 crosses the western-central area and roads 87 and 287 continue toward the southern boundary. Route 136 appears near the southeastern outside edge. The farther south and east the map moves, the more important the blue drainage lines become, because those creek valleys reveal terrain differences that are not obvious from the road network alone.
The Dumas hub shows direct distance to Cactus and Sunray
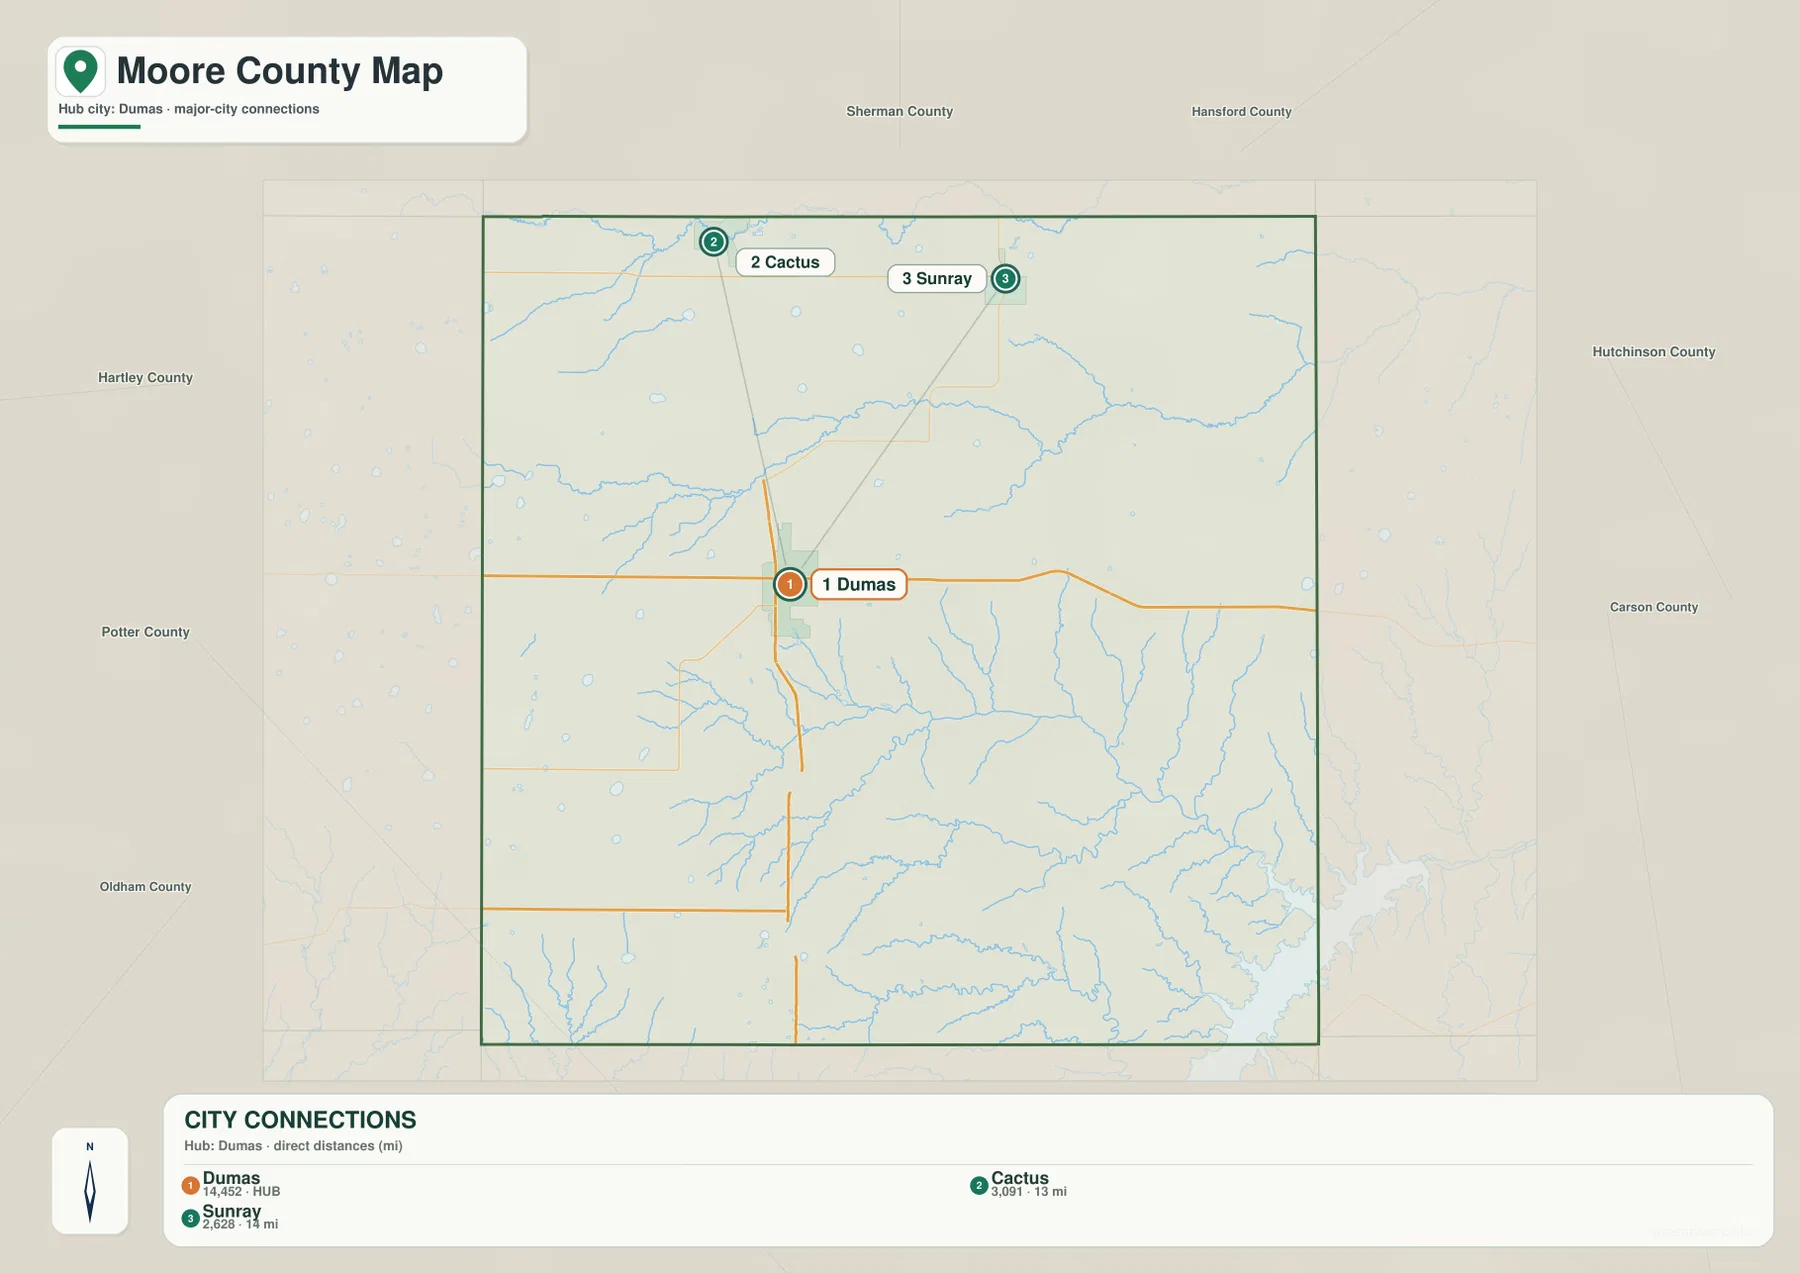
The city-connections map uses Dumas as the hub and links it directly to Cactus and Sunray. The labels show about 13 miles from Dumas to Cactus and about 14 miles from Dumas to Sunray. These are straight-line distances between mapped points, not driving distances or estimated travel times.
Cactus lies north-northwest of Dumas, while Sunray is north-northeast. The two northern markers sit at broadly similar latitudes, giving the map a simple triangular settlement pattern. Once that relationship is clear, the general map can be used to match the three places back to Route 119, Route 281, and the more detailed local road network.
The lower index also prints Dumas 14,452, Cactus 3,091, and Sunray 2,628. The supplied image does not identify a year for these values, so this article treats them only as figures printed on the map rather than confirmed current population counts. The main value of this layer is the direction and direct-distance comparison.
North and South Palo Duro creeks separate the upper plateau into distinct valleys
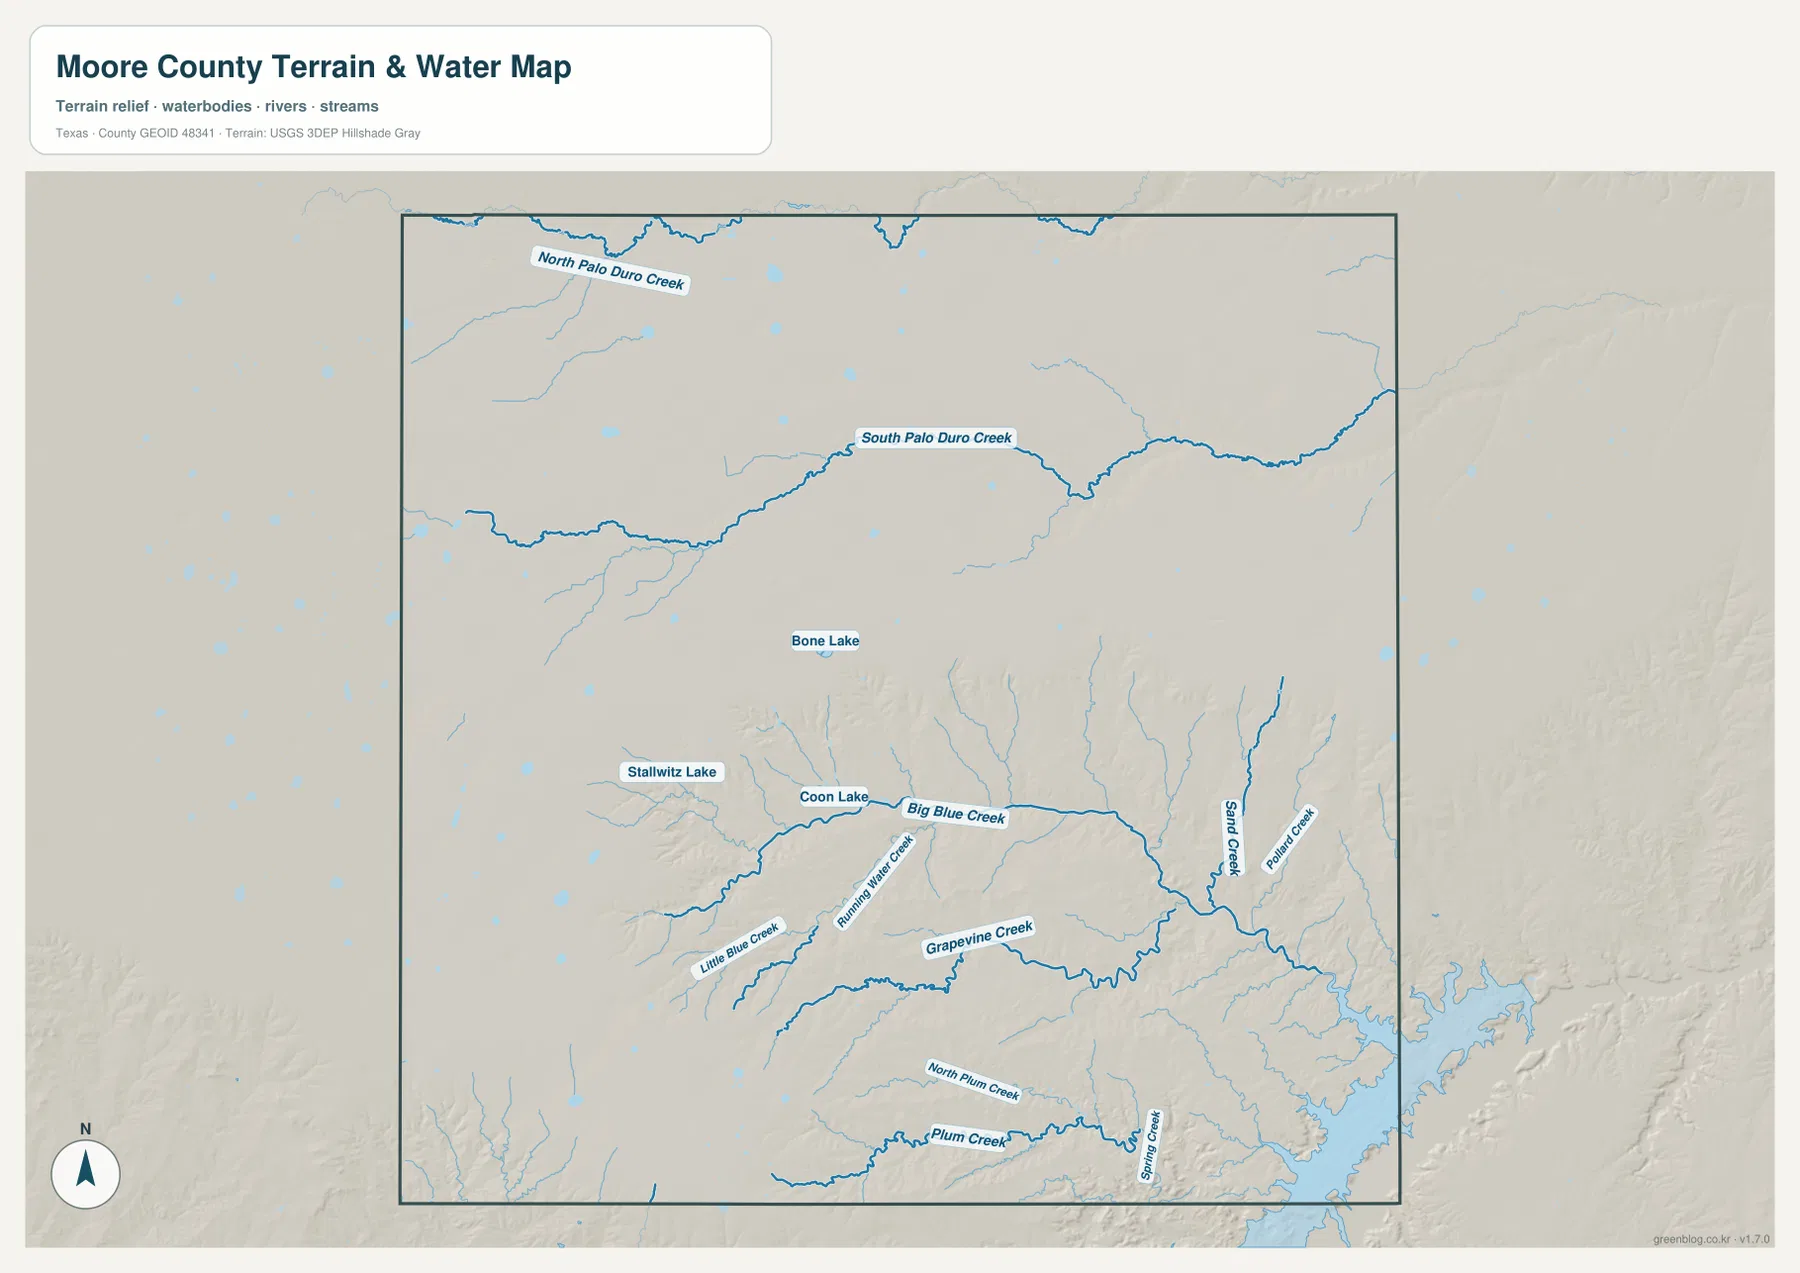
North Palo Duro Creek is labeled across the northern part of the terrain-and-water map. Farther south, South Palo Duro Creek forms a much stronger winding channel through the north-central and eastern interior. The two names are useful because they identify separate low corridors within what can otherwise look like a broad, nearly uniform plateau on the general map.
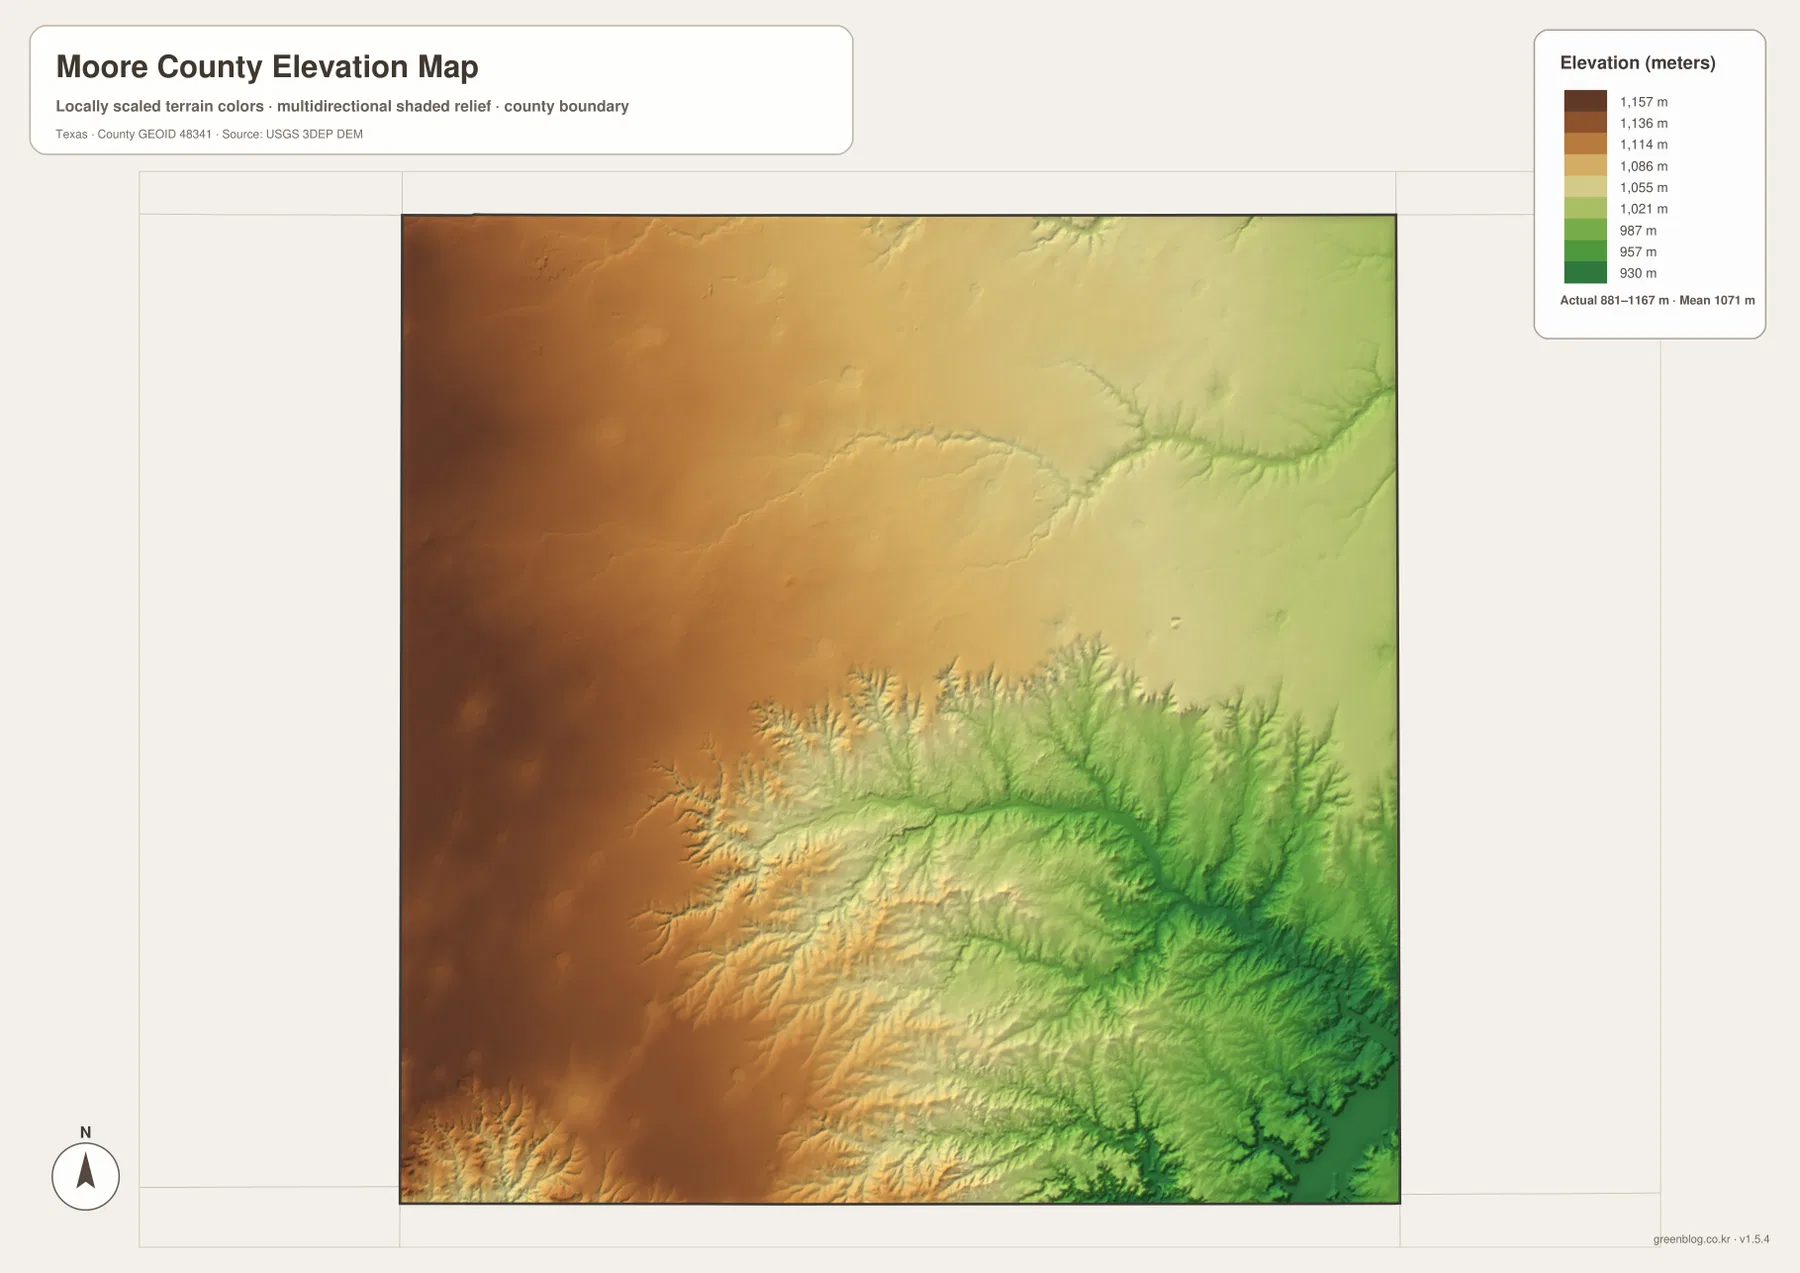
South Palo Duro Creek becomes increasingly incised toward the east. On the elevation map, its course corresponds with a greener lower valley cut into higher yellow and tan terrain. The relationship is especially clear near the northeastern and eastern side, where tributaries join the main channel and the relief becomes more visible.
Blue, Grapevine, and Plum creek systems shape the southern half
Big Blue Creek crosses the central-southern interior and receives smaller tributaries from both sides. Little Blue Creek is labeled farther southwest, while Running Water Creek joins the same broad area. Grapevine Creek follows a long winding path below them and becomes one of the strongest references for the lower-central drainage.
North Plum Creek and Plum Creek are labeled across the southern part of the map, with Spring Creek nearby. Sand Creek and Poland Creek appear farther east. These waterways become especially important toward the southeast, where the terrain is much more deeply dissected than the western plateau.
Bone Lake, Stallwitz Lake, and Coon Lake are small named water bodies in the central-western area. They are better treated as local landmarks than as dominant lakes. The terrain-and-water layer is intended for geographic reference and should not be used as a flood-hazard map, legal water-boundary product, parcel map, or navigation chart.
High western plateau surfaces fall sharply into the southeastern creek valleys
The elevation map reports an actual range of about 881 to 1,167 meters and a mean elevation of about 1,071 meters. The highest dark-brown terrain covers much of the west and northwest, and the north-central interior remains comparatively high. Elevation drops toward the east, with the lowest greens concentrated in the southeast and within the deeper creek corridors.
South Palo Duro Creek forms one of the clearest lower valleys in the upper half. Big Blue Creek and Grapevine Creek create additional green corridors farther south, while the Plum Creek system cuts into the lower edge. Matching these channels with the water map shows that many of the strongest elevation breaks follow named drainage lines rather than arbitrary color changes.
The southeast contains the most strongly dissected relief in the county. Numerous branching tributaries cut back into the plateau, creating closely spaced ridges and valleys. The difference between the displayed minimum and maximum elevation is about 286 meters, a substantial local contrast within the broader High Plains setting.
The elevation layer is best used for relative terrain comparison rather than survey-grade or engineering-grade measurement. Its value here is to connect Dumas, Cactus, Sunray, the high western plateau, the Palo Duro creek system, and the lower southeastern drainage country into one physical view.
Following the map southeast from Dumas reveals the county’s strongest terrain change
Start at Dumas on the general map and move east along the Route 152 direction before looking toward the southeast. Settlement labels quickly become sparse, while blue stream lines become more numerous. On the terrain-and-water map, Big Blue Creek, Sand Creek, and Grapevine Creek organize the same broad area, and the elevation layer shifts from higher tan surfaces into increasingly green valleys.
The west and northwest provide the opposite comparison. Roads cross a broad, relatively high surface, and the water layer shows fewer deeply incised channels than in the southeast. Cactus and Sunray also sit within this higher northern setting, although South Palo Duro Creek cuts a distinct lower corridor through the upper half.
Use the city-connections map when the Dumas-to-Cactus or Dumas-to-Sunray spacing is the main question, the general map for road numbers, the terrain-and-water map for the named creek systems, and the elevation map for the plateau-to-valley contrast. Smaller labels are often easier to inspect in the downloadable high-resolution JPG files than in the browser previews.
Frequently Asked Questions
What direct distances are shown from Dumas?
The city-connections map shows about 13 miles from Dumas to Cactus and about 14 miles to Sunray. These are straight-line map distances, not driving distances.
Which water features are the best starting points?
North Palo Duro Creek and South Palo Duro Creek provide the clearest northern references. Big Blue Creek, Grapevine Creek, and Plum Creek are useful farther south, while Bone Lake, Stallwitz Lake, and Coon Lake provide small local landmarks in the central-western area.
What elevation range is shown for Moore County?
The supplied elevation map reports an actual range of about 881 to 1,167 meters and a mean elevation of about 1,071 meters. The west and northwest are generally higher, while the east and especially the southeast contain lower and more deeply incised creek valleys.
Sources and Reference Data
- U.S. Census Bureau TIGER/Line Shapefiles — official county-boundary and road geometry for geographic reference.
- USGS National Hydrography — official resources for creeks, lakes, and other water features.
- USGS 3D Elevation Program — official elevation resources used for terrain information.
- USGS The National Map Viewer — an official viewer for comparing geographic layers.
Map File Information
Download four high-resolution A3 JPG maps of Moore County, Texas, in one ZIP file.
- Included Files: county map, city-connections map, terrain and water map, elevation map
- File Type: JPG
Related Maps
- Potter County Texas map
- Sherman County Texas map
- Armstrong County Texas map
- Roberts County Texas map
- Ochiltree County Texas map
Green Map creates custom-edited map images using open geographic data sources such as geoBoundaries, Natural Earth, OpenStreetMap, and government open data.
These maps are edited visual materials, not raw data files, and are provided for education, documents, presentations, and graphic reference.