Amarillo to the Canadian River | Potter County Texas Map

A Potter County Texas Map is especially useful because the county does not have one uniform geographic character from south to north. Amarillo occupies the southern edge of the mapped county, where major highways and the largest concentration of developed land appear together. Travel north and the city quickly gives way to a much more open landscape cut by tributaries, the Canadian River, and the rougher terrain around Lake Meredith. The downloadable set on this page includes a county-and-roads map, a ranked city map, a terrain-and-water map, and an elevation map. High-resolution A3 JPG versions are available together in the ZIP download box below.

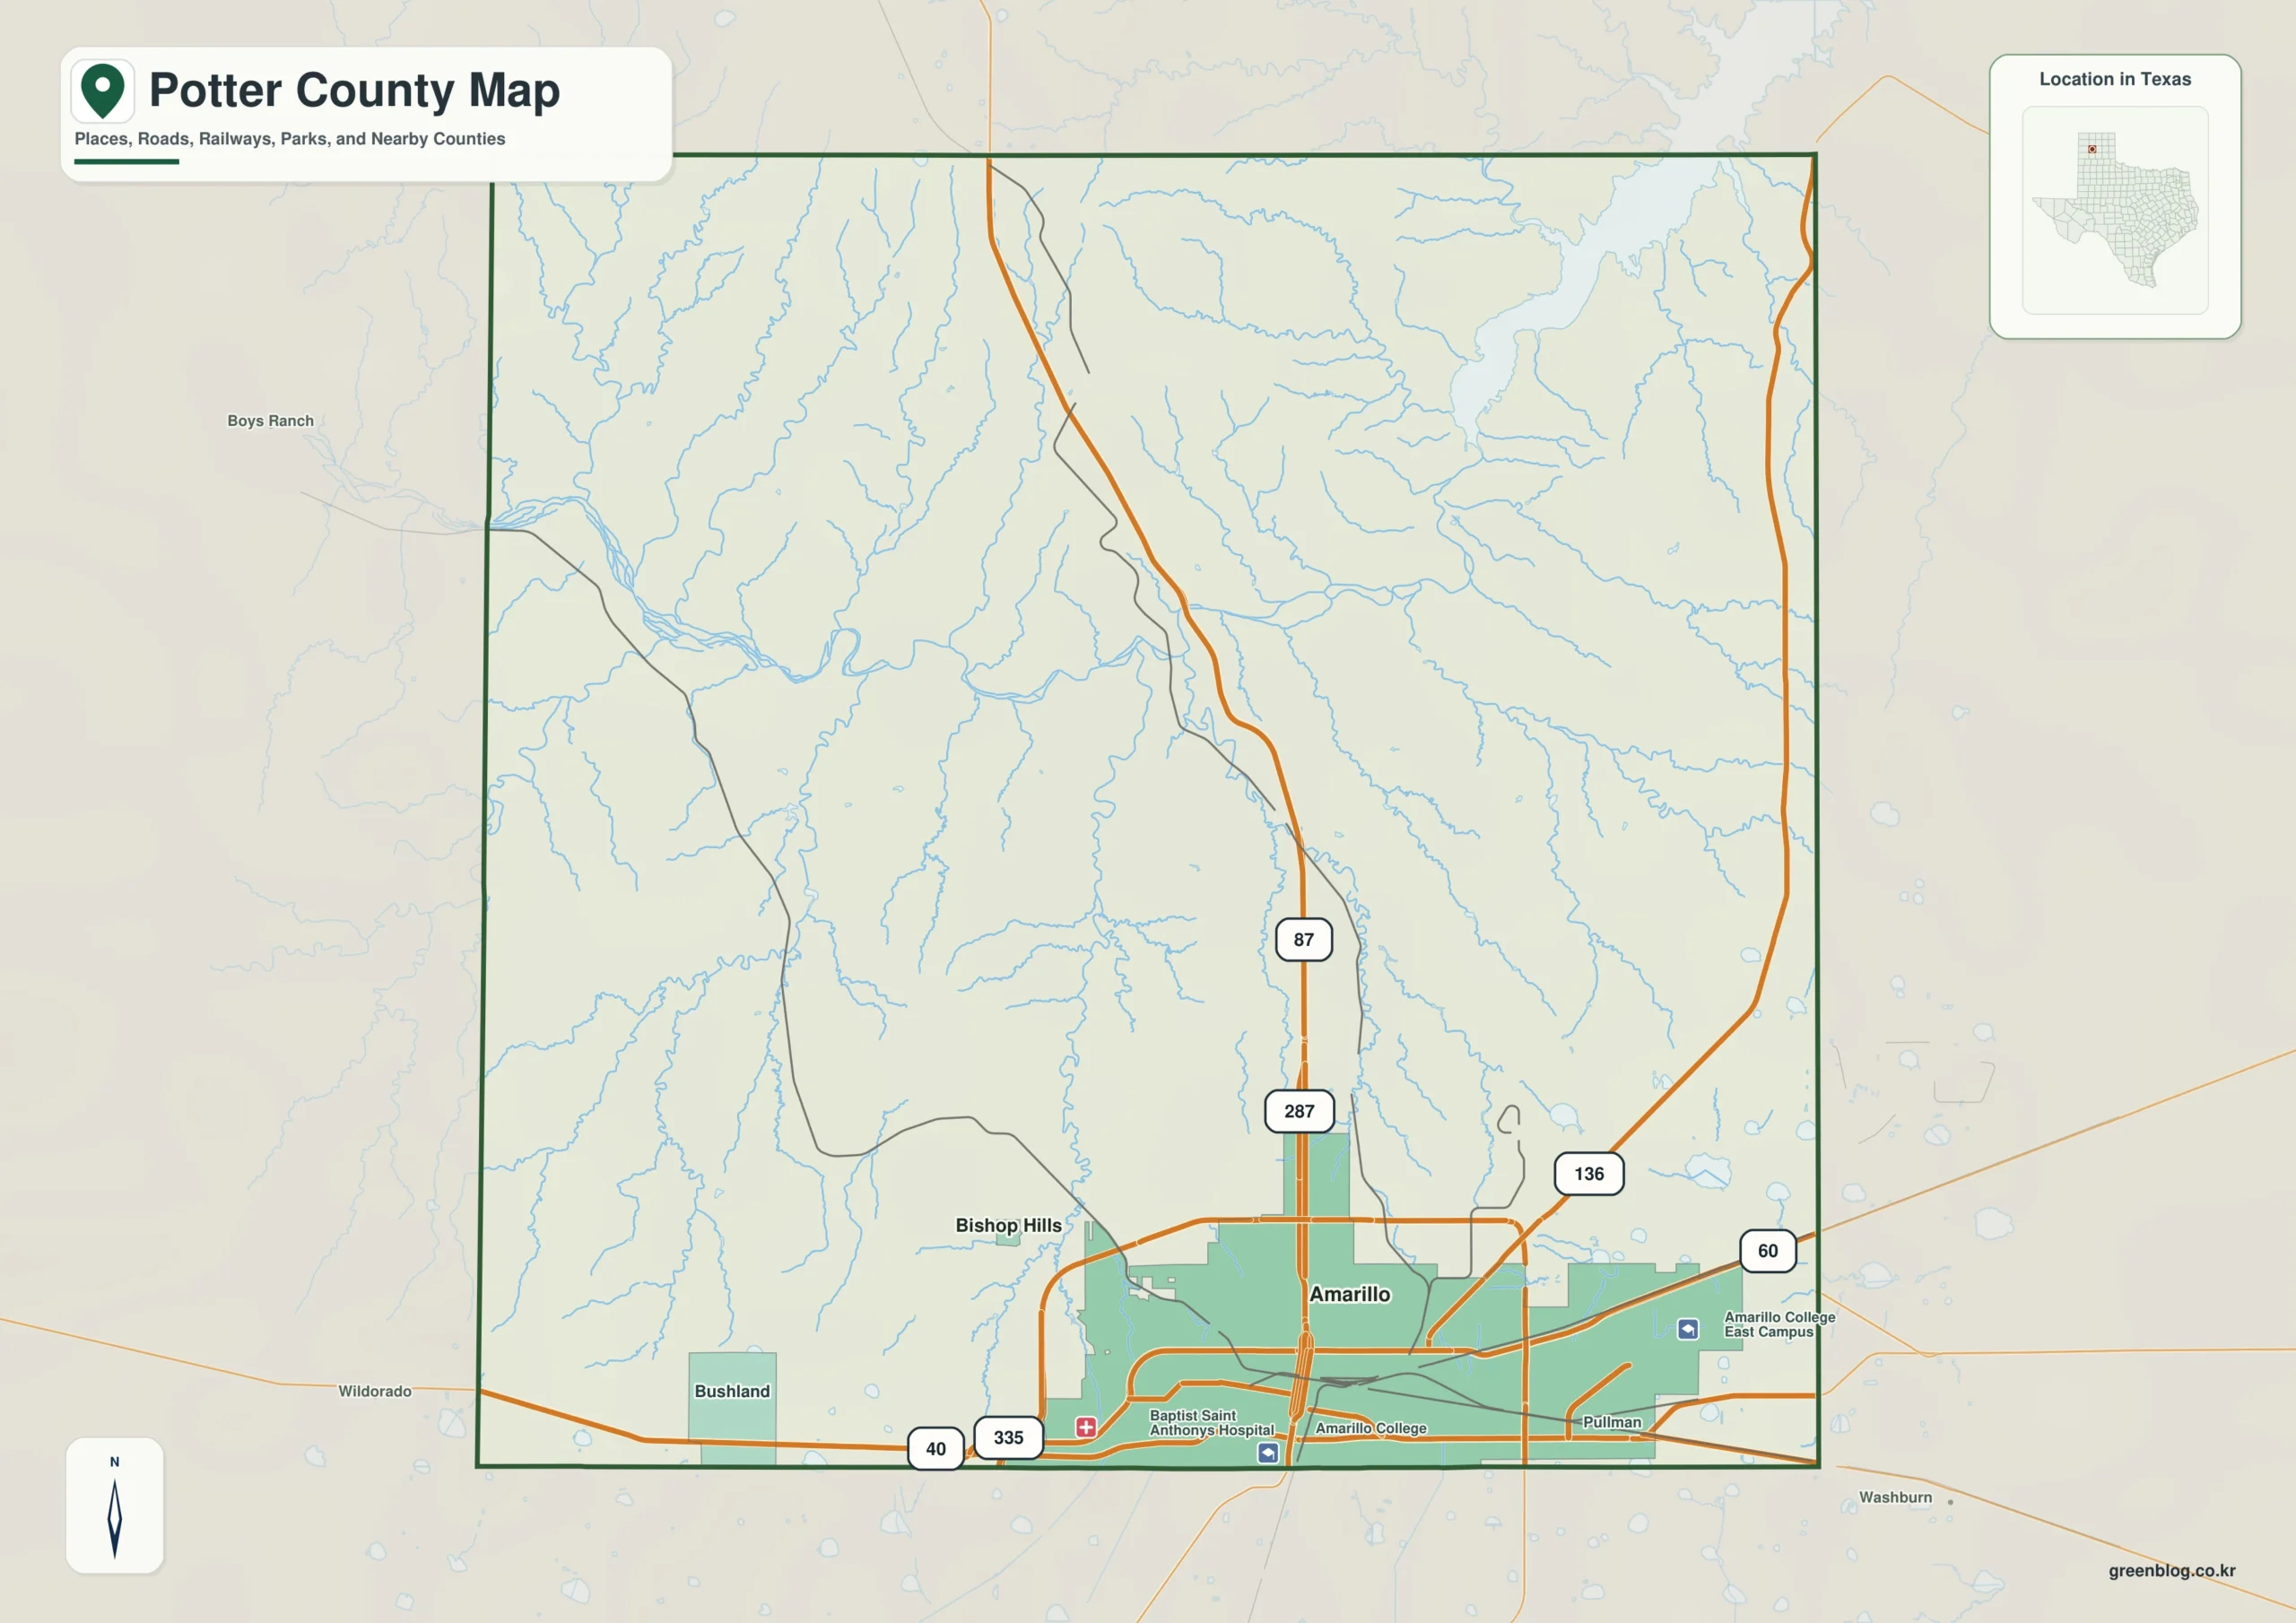
The maps are most informative when they are read as a group rather than as four unrelated pictures. The road map establishes Amarillo, Bushland, Bishop Hills, Interstate 40, U.S. 87/287, U.S. 60, State Highway 136, and Loop 335. The water map then explains why northern Potter County looks so different from the southern city area: the Canadian River crosses a deeply cut landscape and receives numerous smaller streams. Finally, the elevation map shows the river corridor as a broad lower zone between higher plains. That combination makes it possible to move from a simple location question to a clearer understanding of how roads, settlement, water, and relief fit together.

Amarillo at the county’s southern edge

The county map immediately places Amarillo near the bottom of the county boundary rather than near its geographic center. The green urban area spreads along that southern edge, while I-40 runs west to east through the developed zone. U.S. 87 and U.S. 287 form the clearest north-south route, leaving Amarillo and continuing through the center of Potter County. State Highway 136 angles toward the northeast, U.S. 60 extends eastward from the Amarillo area, and Loop 335 helps show the road pattern around the city. This road arrangement is important because it gives the reader an easy frame of reference before looking at the much less developed northern half of the county.

Potter County Texas map showing Amarillo, Bushland, Bishop Hills and major highways
Potter County reference map with Amarillo, I-40, U.S. 87/287, State Highway 136, and nearby places.

Bushland appears near the southwest side of the map along I-40, west of Amarillo. Bishop Hills is labeled just northwest of the main Amarillo urban area, while Pullman appears near the eastern side of the city. Several places beyond the county boundary are also shown, including Boys Ranch to the west and Wildorado and Washburn near the southern map edge. These outside labels are useful for orientation because they prevent the county outline from being read in isolation. They also make the strong southward concentration of roads and development easier to see: the lower portion of the map is busy with highways and place labels, whereas the north contains far fewer settlement labels and much more drainage detail.

For a quick location check, I-40 and U.S. 87/287 are the most practical visual anchors. I-40 ties Bushland to Amarillo along the southern part of the county, while U.S. 87/287 points directly toward the open northern interior. If you are comparing a community, a road, and the county boundary, start with those two routes and then add Highway 136 or U.S. 60 as needed. This map is a geographic reference rather than a live navigation product, so it should not be used to infer current closures, legal access, or travel times. Its strength is showing where the principal roads and labeled places sit relative to the county outline.

A city index dominated by Amarillo

The supplied city map strips away some road detail and focuses on the ranked city distribution. Its City Index lists Amarillo first with the value 201,885 and Bishop Hills second with 202. Those figures are labels printed on the supplied map, so they are best treated here as part of that map’s city index rather than as a claim about a newer population estimate. The difference is nevertheless striking. Amarillo is overwhelmingly the major city shown, and both ranked places are located in the southern portion of Potter County. No comparable ranked city appears in the broad northern area.

Potter County city map ranking Amarillo and Bishop Hills
The supplied city index ranks Amarillo first and Bishop Hills second, both near the county’s southern end.

The city map also labels surrounding counties, which makes Potter County easier to place within the Texas Panhandle. Oldham County lies to the west, Moore and Hutchinson counties are shown to the north, Carson and Armstrong counties appear to the east, and Randall and Deaf Smith counties are labeled toward the southwest and south-side surroundings. The purpose of these labels is not to provide a detailed regional boundary atlas, but they do give useful context for Potter County’s rectangular outline. In particular, Amarillo’s position near the southern edge becomes more meaningful when the neighboring county labels are visible around it.

Canadian River, tributaries, and Lake Meredith

The terrain-and-water map shifts attention away from streets and developed areas to the drainage network. The Canadian River is the dominant named watercourse, bending across the northern half of the mapped county. Several tributaries feed toward it. Indian Creek, Sand Creek, and Corral Creek are labeled on the northwest side, while Tecovas Creek rises from the southwest and West Amarillo Creek runs northward from the southern interior. East Amarillo Creek is also labeled near the center and continues toward the Canadian River system. The density of these stream lines makes the northern landscape look much more dissected than the flatter-looking area around Amarillo.

Potter County terrain and water map showing the Canadian River, Lake Meredith and named creeks
The Canadian River and Lake Meredith form the main northern water features, with several named creeks feeding the river corridor.

Lake Meredith is the largest named water body on the map and appears near the northeastern side, connected to the Canadian River. Smaller water-related labels in the southern half include Dry Lake, Martin Lake, Wild Horse Lake, Playa Lake, Lawrence Lake, and Ida Lake. The map does not establish that every named feature has the same hydrologic behavior or water level throughout the year, so it is better to use these labels as geographic references rather than to assume they are all permanent open-water lakes. For someone trying to find named creeks and water bodies that are difficult to see on a general road map, this version is the clearest of the supplied set.

The shaded relief behind the blue water lines adds another useful layer. Along the Canadian River, the surface is visibly rougher and more deeply cut than the broad southern plain. Branching valleys reach toward the river from both north and south, particularly in the middle and northeastern parts of the map. Around Lake Meredith the relief becomes even more visually complex. This is why the water map should be read as a terrain reference as well as a list of named streams. It is not, however, a flood-risk map, a parcel map, a navigation chart, or a statement about legal water boundaries.

An 881–1,193 meter elevation range shaped by the river corridor

The elevation map provides the strongest visual explanation for the north-south contrast. The map itself reports an actual elevation range of about 881 to 1,193 meters and a mean of 1,037 meters. Green tones mark lower ground, while yellows and browns mark higher areas. A broad green band follows the Canadian River across the northern half of the county and reaches toward Lake Meredith in the northeast. The southwestern corner stands out in darker brown tones, and comparatively high terrain also appears along parts of the northwest and southern edges. The pattern makes the river valley easy to distinguish even without stream labels.

Potter County elevation map showing low Canadian River terrain and higher plains to the south and west
Elevation ranges from about 881 to 1,193 meters on the supplied map, with lower ground following the Canadian River.

Reading the elevation and water maps together is more useful than relying on either one alone. The water map tells you the names and paths of the Canadian River and its tributaries; the elevation map shows the broader landform in which those channels sit. Where the water map shows the major river bends, the elevation surface shows a continuous lower corridor. The small tributary valleys also line up with finer incisions in the shaded terrain. South of that system, the land rises back toward the plains around Amarillo. The maps therefore explain why a northward trip from the city area moves from a relatively even plateau toward a more broken river landscape.

The elevation layer is designed for county-scale comparison, not for engineering or survey measurements at a particular property. The colors and relief are ideal for answering questions such as which part of the county is generally lower, where the main river valley lies, and how the high plain relates to the drainage network. They are not a substitute for a site survey or a precise spot elevation. Keeping that distinction in mind makes the map more useful: it presents the shape of Potter County’s terrain clearly without pretending to provide property-level precision.

Following one route through all four maps

One of the easiest ways to use this collection is to follow the same north-south line through each map. Begin at Amarillo on the county map and locate U.S. 87/287. The road leaves the dense southern road network and continues north through land with far fewer city labels. On the water map, the same central part of Potter County is crossed by tributaries leading to the Canadian River. On the elevation map, the river zone becomes a broad green lowland. This sequence turns what might look like four separate map products into one coherent geographic story about the county.

You can use a similar comparison from west to east. Bushland provides a convenient western reference point near I-40, while Amarillo anchors the south-central and southeastern urban area. Farther north, the Canadian River crosses the county and Lake Meredith appears toward the northeast. The elevation map then reveals that the higher western and southern surfaces are separated from the northern river corridor by a noticeable drop in elevation. Because each map emphasizes a different type of information, changing maps is often more effective than trying to read roads, city ranks, water names, and elevation colors from a single crowded image.

Choosing the map that fits the question

If your main question is “Where is this place in Potter County?”, start with the county map. It contains the most useful combination of boundary, roads, nearby labels, and developed areas. If you need to compare Amarillo with the other ranked city shown in the package, the city map is cleaner because it reduces distractions and highlights Amarillo and Bishop Hills. For questions about the Canadian River, Lake Meredith, Indian Creek, Tecovas Creek, or other named water features, use the terrain-and-water map. When the question is about higher and lower ground, switch to the elevation map and compare its color bands with the water network.

This division of information also helps with printing. A road-and-place map works well when the reader needs labels and orientation. The water map is better for a discussion of drainage and northern terrain because its blue network remains visible across the shaded background. The elevation map depends more heavily on color differences, so a color print or screen view preserves its meaning best. The city map is the simplest of the set and works well when the goal is to show the strong dominance of Amarillo without filling the page with every road and stream.

Using the high-resolution files for print and editing

The WebP maps in the article are optimized for viewing in the page, while the download package contains high-resolution A3 JPG files that are easier to use for print layouts and image editing. The ZIP contains the same four subjects shown above: the county reference map, the ranked city map, the terrain-and-water map, and the elevation map. Keeping the original aspect ratio is recommended when resizing so that the county shape, road placement, labels, and scale of the visual elements are not distorted. You can choose only the file that matches your purpose rather than inserting every map into the same document.

For a classroom handout or general county reference, the first map usually provides the best starting point because readers can see Amarillo and the major highways immediately. A presentation about the Canadian River should use the water map, while a discussion of landform differences benefits from placing the water and elevation maps next to each other. The city map is most effective when the focus is the concentration of settlement near the southern boundary. These choices keep the map matched to the question and make the printed page easier to understand.

Frequently Asked Questions

Where is Amarillo on the Potter County map?

Amarillo is shown along the southern edge of Potter County. I-40 runs west to east through the developed area, and U.S. 87/287 heads north from the city into the county interior, making those highways useful landmarks for finding it quickly.

Why does the Canadian River area appear lower on the elevation map?

The terrain-and-water map shows the Canadian River crossing a deeply cut northern landscape with many tributaries. On the elevation map, that same corridor appears in lower green tones, while the plains farther south and west rise into yellow and brown colors. Reading the two maps together makes the river valley much easier to recognize.

What is included in the Potter County download ZIP?

The archive contains high-resolution A3 JPG versions of the county map, city map, terrain-and-water map, and elevation map used in this article. The JPG files are intended for larger printing and editing, while the WebP images in the page are optimized for on-screen viewing.

Sources and Reference Data

For official background on county boundary and mapping data, see the U.S. Census Bureau TIGER/Line Shapefiles. Water-feature reference data are available from USGS National Hydrography, and elevation-data background is available from the USGS 3D Elevation Program. The place names, road labels, water features, and elevation figures described in this article are limited to what is shown in the supplied Potter County maps and manifest.

Map File Information

The ZIP includes high-resolution A3 JPG files for the Potter County reference, city, terrain-and-water, and elevation maps shown on this page.

  • Included Files: 4 Potter County JPG maps
  • File Type: ZIP archive
Download Map Files

Green Map creates custom-edited map images using open geographic data sources such as geoBoundaries, Natural Earth, OpenStreetMap, and government open data.

These maps are edited visual materials, not raw data files, and are provided for education, documents, presentations, and graphic reference.
Leave a Comment

Your email address will not be published. Required fields are marked *

Scroll to Top