A Donley County Map becomes much easier to use when Clarendon is treated as the starting point rather than just another label. From there, US 287 leads southeast toward Lelia Lake and Hedley, while Howardwick sits to the north near the reservoir country. The four supplied maps separate those relationships into boundary and roads, city connections, terrain and water, and elevation. High-resolution JPG versions of all four maps are available in the ZIP download farther down the page.
The strongest geographic contrast is between the higher western and northwestern ground and the lower, more dissected country toward the east. Greenbelt Reservoir and the Salt Fork Red River cut across that transition, with many smaller creeks feeding the larger drainage. Reading the road and water maps together helps explain why the county is not simply an open rectangle of plains: settlements, highways, tributaries, and valleys occupy different parts of the same landscape.
Table of Contents
Clarendon as the road and place-name anchor
On the general county map, Clarendon is the clearest orientation point. US 287 crosses the county on a northwest-to-southeast line, passing through Clarendon and continuing through Lelia Lake toward Hedley. Howardwick is separated from that corridor to the north, reached by the north-south route that runs past the Clarendon area. Farther east, routes marked 203 and 273 connect the Hedley side of the county with the eastern boundary. This arrangement gives the map a simple first reading: one dominant diagonal highway, a northward branch toward Howardwick, and smaller eastern connections.
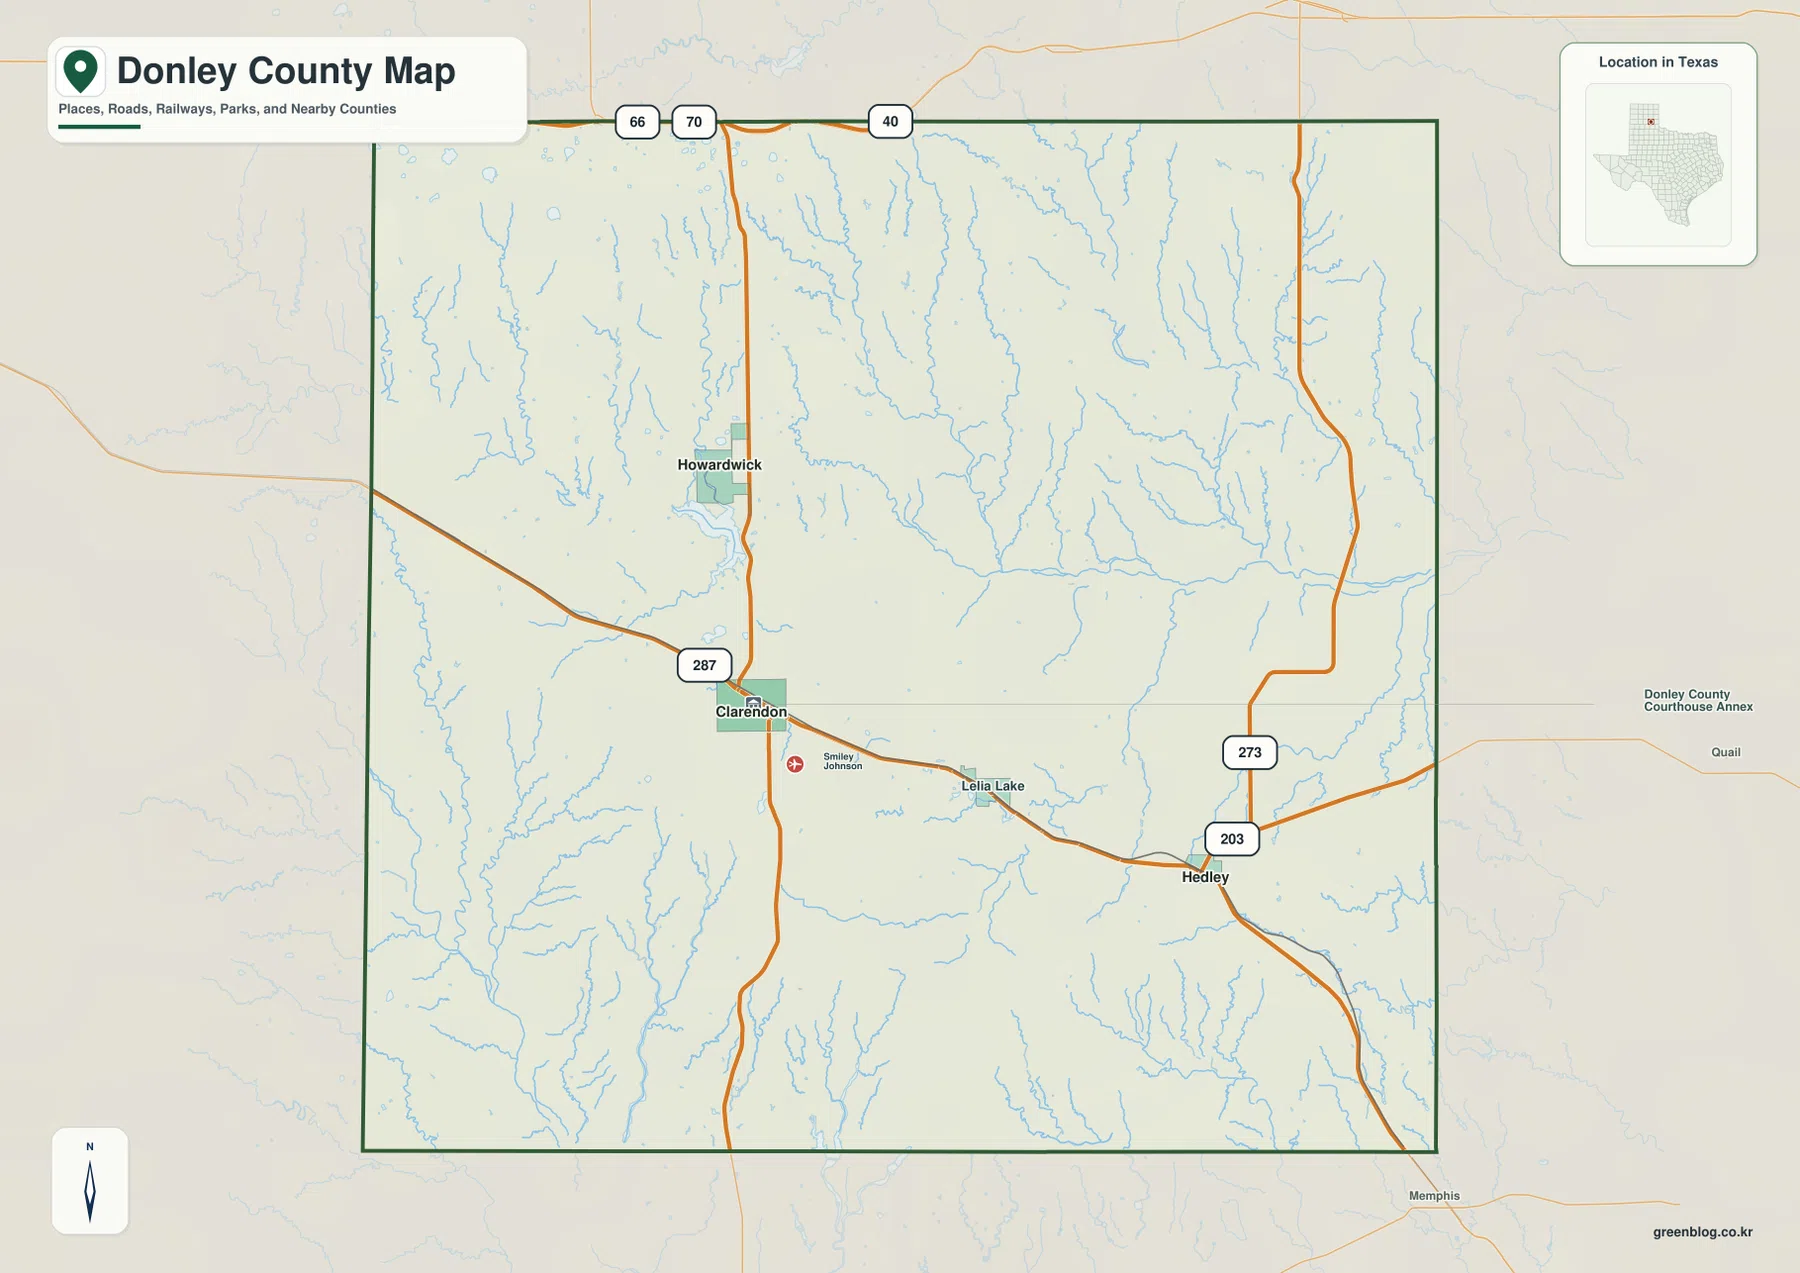
The spacing between labels is as important as the labels themselves. Clarendon occupies the central-western part of the county and works well as a reference for nearly every other feature. Hedley lies well to the southeast along US 287, while Howardwick is north of Clarendon and away from the main Clarendon-Hedley line. If you need a quick orientation before studying terrain, remember those three positions first. They provide fixed reference points when the later maps replace roads with water features or elevation colors.
What the 7-mile and 14-mile city links actually show
The city-connections map uses Clarendon as the hub and shows two direct-distance comparisons. Howardwick is about 7 miles from Clarendon, while Hedley is about 14 miles away. These are straight-line distances, not driving distances. A road trip can be longer because the route must follow the available highway network, so the numbers are best used to compare relative spacing and direction rather than estimate travel time.
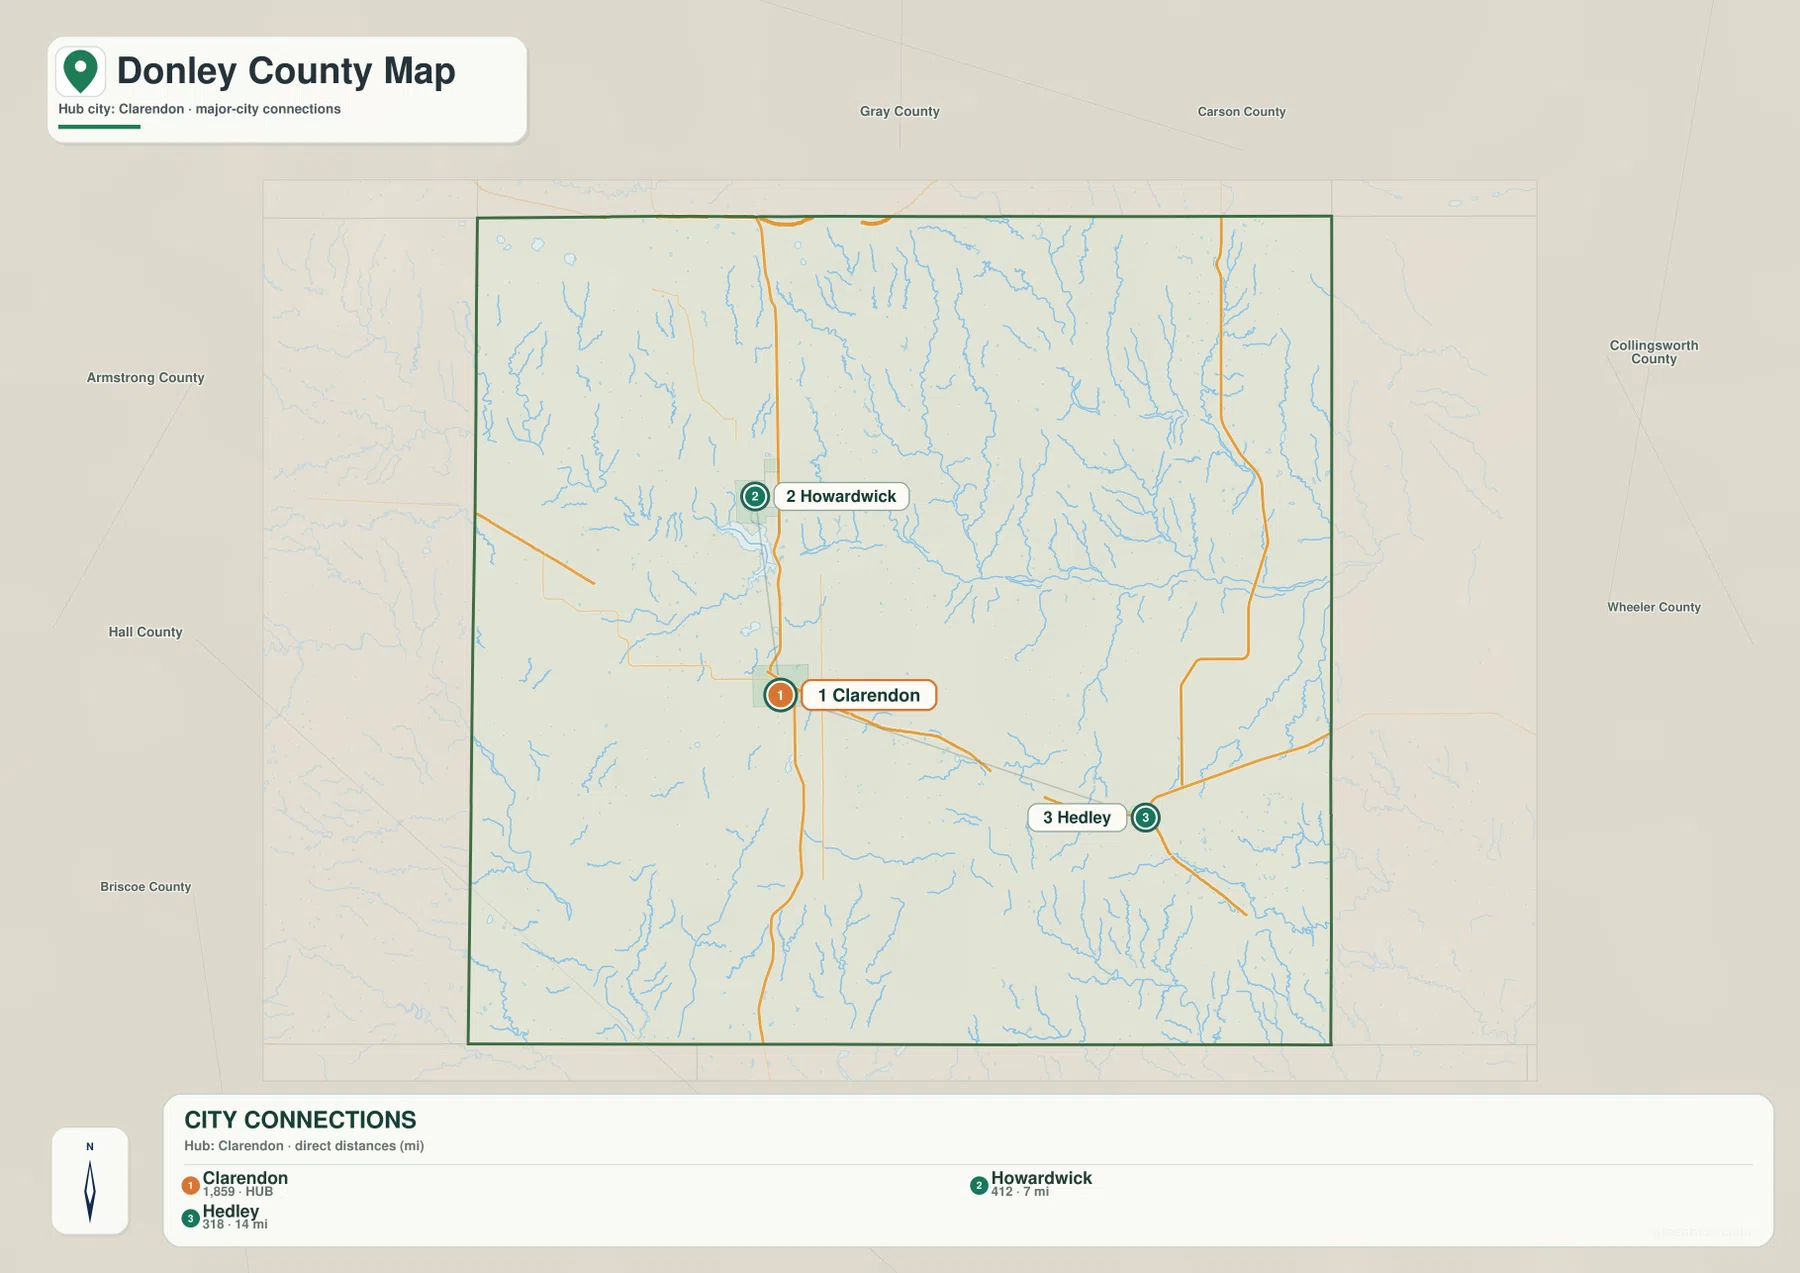
The map also makes the county’s settlement pattern unusually clear. Clarendon is not centered between two equal towns; Howardwick and Hedley occupy different directions and different road settings. Howardwick is the northern comparison point, close to the reservoir side of the county, while Hedley is tied to the southeast US 287 corridor. That distinction matters when choosing a map for a local task. A person comparing community spacing may prefer this city map, while someone tracing an actual route should return to the general road map.
Greenbelt Reservoir and the Salt Fork drainage
The terrain-and-water map changes the character of the county immediately. Greenbelt Reservoir appears in the west-central part of the mapped area, and the Salt Fork Red River continues eastward as the dominant drainage line. North of it, Whitefish Creek and Sadlers Creek descend through a dense network of small tributaries. Spencer Lake is labeled in the northeast. The broad Salt Fork corridor forms a strong horizontal feature across the upper-middle part of the county and is much more visually prominent here than on the road map.
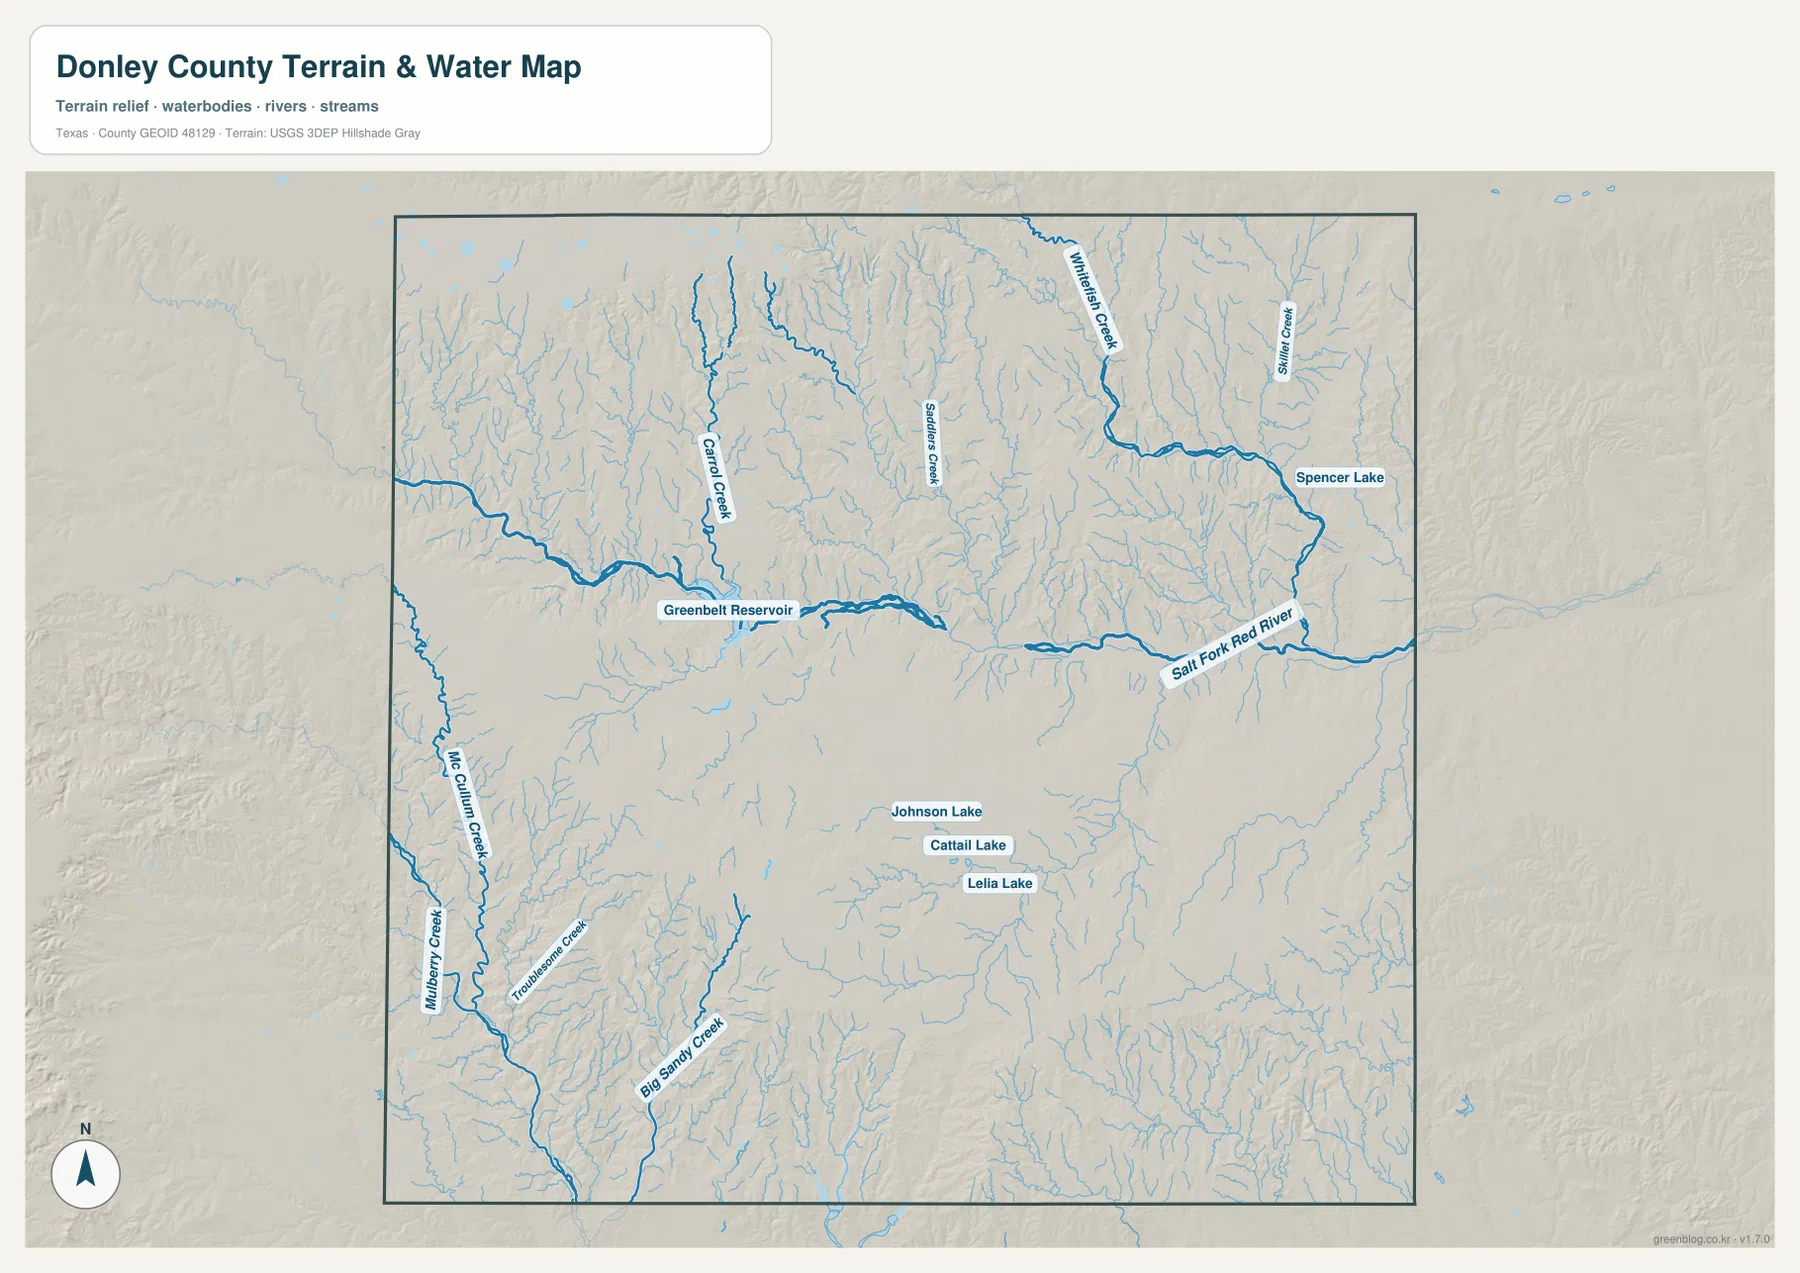
South of the Salt Fork, smaller named waters show that the drainage pattern continues across the rest of the county. Johnson Lake, Cattail Lake, and Lelia Lake are clustered in the central-southern area, while Mulberry Creek, Troublesome Creek, and Big Sandy Creek appear farther south and southwest. The map is intended as a geographic reference, not a flood-risk, legal water-boundary, or navigation product. Its value is in showing which streams belong to the same terrain and where the county surface is cut by valleys rather than remaining uniformly flat.
One useful comparison is to move back and forth between the water map and the road map. US 287 follows a broad corridor through Clarendon and Hedley, while the eastern and southern sides show many branching drainage lines. The maps do not prove why every road bends, but they do show the terrain a road must cross. For classroom or local-reference work, that is a more useful observation than treating every stream line as an isolated name.
From high northwestern ground to lower eastern valleys
The elevation map gives the clearest summary of Donley County’s relief. Its legend reports an actual mapped range of about 630 to 995 meters, with a mean near 811 meters. Brown and dark tan dominate the northwest and parts of the western edge, indicating the highest ground. Moving toward the center, colors shift through tan and yellow-green. The east and southeast contain much more green, and a long low corridor follows the Salt Fork Red River area.
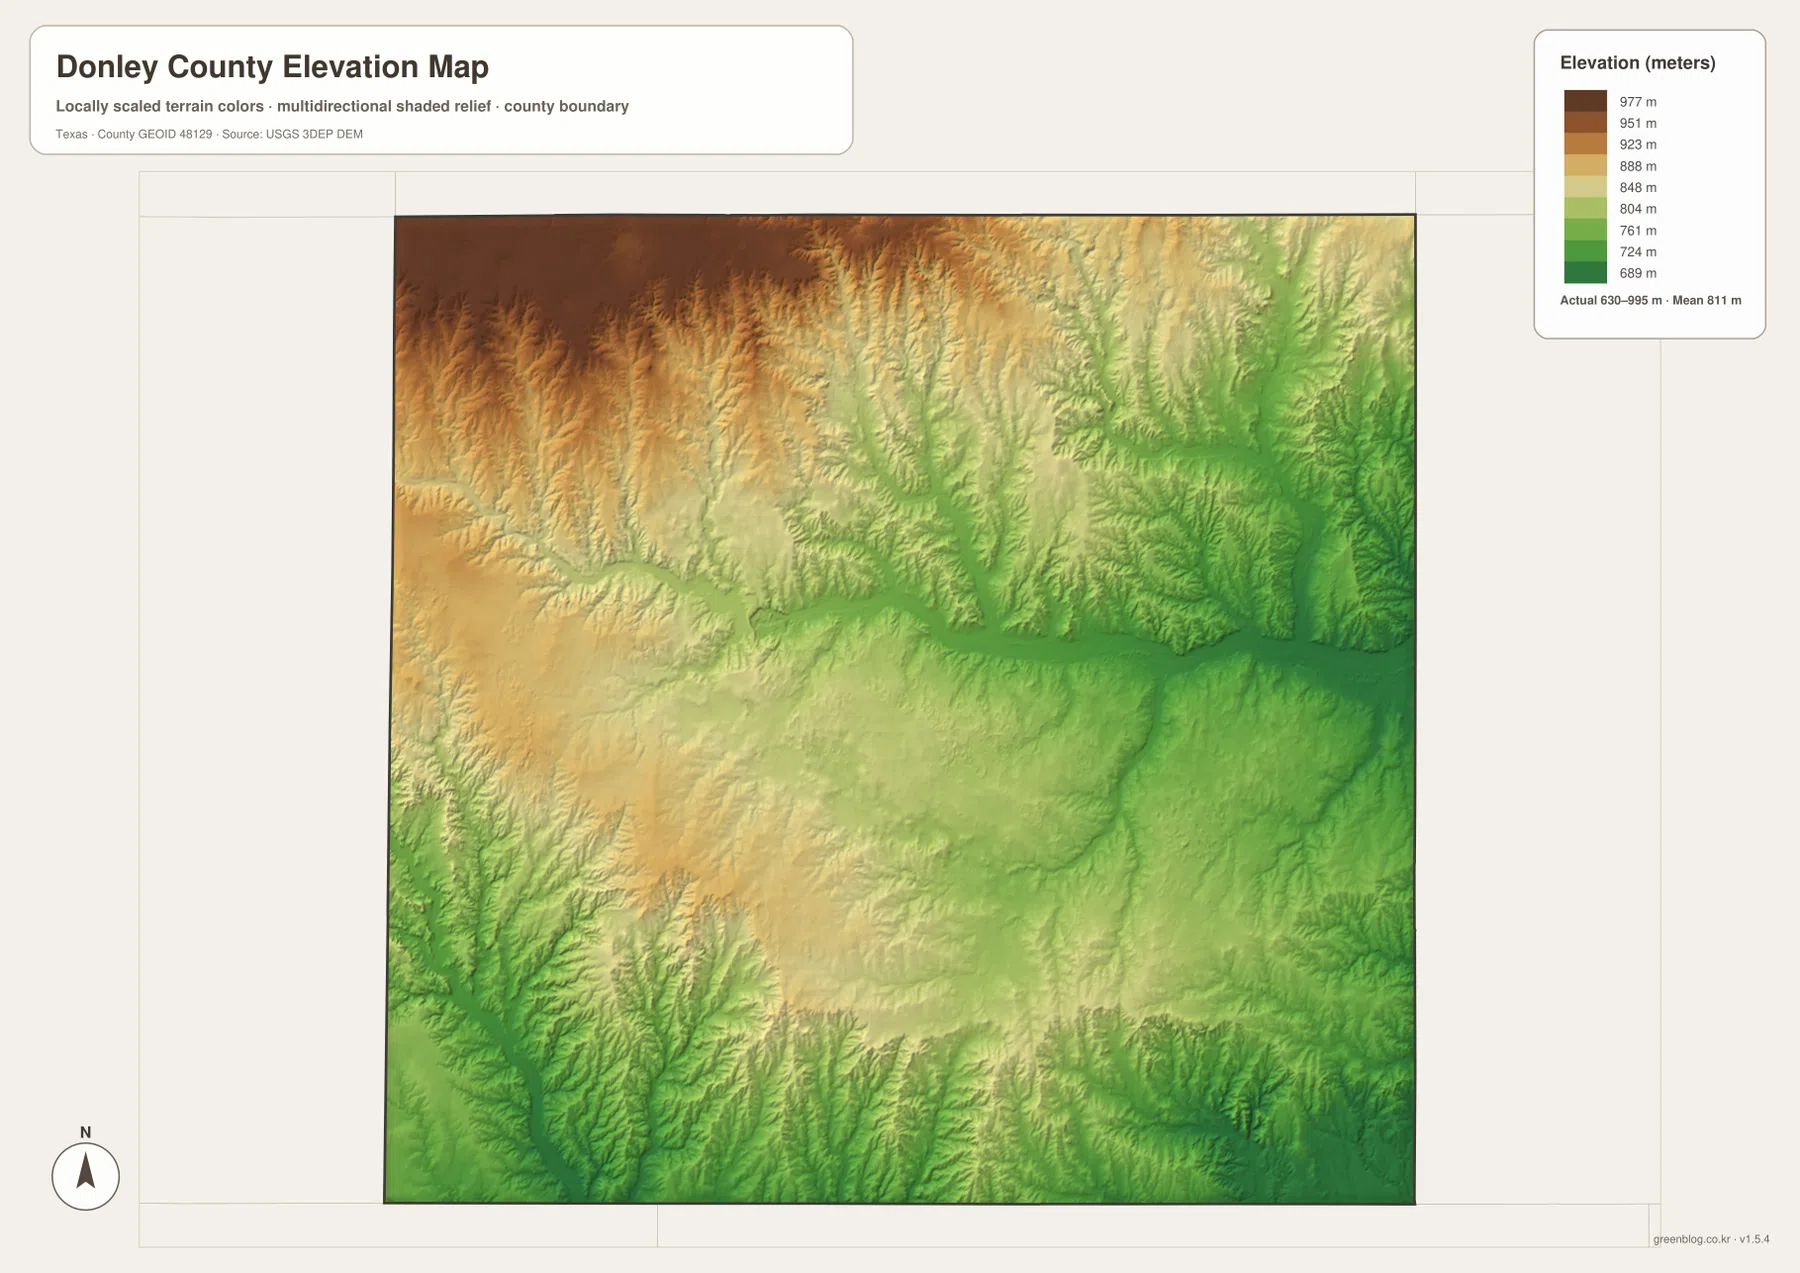
This is a generalized elevation surface rather than a survey drawing, so it should not be used to assign an exact engineering elevation to a road, property corner, or building site. It is excellent, however, for comparing broad parts of the county. The high northwest, middle-elevation central area, and lower eastern drainage country are easy to distinguish. When the elevation map is placed beside the terrain-and-water map, many of the green low areas correspond to the larger stream valleys, making the relationship between relief and drainage easier to see.
Choosing the right Donley County map for the question
For basic location work, start with the county map. It gives you Clarendon, Hedley, Howardwick, Lelia Lake, US 287, and the principal numbered roads in one view. If your question is about how far the main communities are separated, switch to the city-connections map and use the 7-mile and 14-mile straight-line measurements as a scale reference. Those distances are useful for comparison, but they should never be substituted for actual driving mileage.
For physical geography, the water and elevation maps work better as a pair. The terrain-and-water version identifies Greenbelt Reservoir, Salt Fork Red River, several named creeks, and smaller lakes, while the elevation map removes most labels and emphasizes the height difference from northwest to east. Using both prevents a common mistake: assuming a drainage line and a low-elevation band are the same kind of information. One shows named water features; the other shows a generalized surface of height.
When preparing a printed handout or presentation, choose the map that carries the least unnecessary detail for the topic. The city map is cleaner for explaining the position of Clarendon, Howardwick, and Hedley. The water map is stronger for drainage and terrain discussion, and the elevation map is the clearest choice for broad relief. The high-resolution JPG files in the ZIP are larger than the WebP previews shown in the article, so labels and terrain detail hold up better when enlarged.
Frequently Asked Questions
Where should I look for Greenbelt Reservoir on the Donley County maps?
Look northwest and west-central from Clarendon. The terrain-and-water map shows Greenbelt Reservoir most clearly and lets you follow the connected Salt Fork Red River eastward. The general county map is better for relating the reservoir area back to Clarendon and Howardwick.
Are the 7 miles to Howardwick and 14 miles to Hedley driving distances?
No. The city-connections map uses direct straight-line distances from Clarendon. They are useful for comparing community spacing and direction, but actual road mileage can be longer because drivers must follow the available road network.
What is the main elevation pattern in Donley County?
The supplied elevation map shows the highest terrain in the northwest and western side, with progressively lower ground toward much of the east and southeast. The Salt Fork Red River corridor is especially noticeable as a lower band. The map reports a broad range of about 630 to 995 meters and should be treated as a regional elevation reference rather than survey-grade measurement.
Sources and Reference Data
For an additional check of roads, boundaries, terrain, and place names, use the USGS The National Map Viewer. Administrative and transportation datasets are also available from the U.S. Census Bureau TIGER/Line Shapefiles.
Water-feature background can be checked through USGS National Hydrography, while the elevation source family is documented by the USGS 3D Elevation Program. The county descriptions above prioritize the names, distances, and elevation legend visible in the supplied Donley County map package.
Map File Information
The ZIP contains the county map, city-connections map, terrain-and-water map, and elevation map as original high-resolution JPG files. Use these larger files when you need more detail than the on-page WebP previews for printing, teaching, or local comparison.
- File Type: 4 JPG files in one ZIP archive
Related Maps
- Armstrong County Texas map
- Swisher County Texas map
- Potter County Texas map
- Roberts County Texas map
- Wheeler County Texas map
Green Map creates custom-edited map images using open geographic data sources such as geoBoundaries, Natural Earth, OpenStreetMap, and government open data.
These maps are edited visual materials, not raw data files, and are provided for education, documents, presentations, and graphic reference.