You can download a ZIP containing four high-resolution A3 JPG maps of Calhoun County, Arkansas, directly from this page. The set includes a general county map, a city-connections map, a water-and-terrain map, and an elevation map, so the printable files are available without relying on browser screenshots. On the maps, Hampton is the main reference point, Highway 167 provides a clear north-south route, Champagnolle Creek crosses the interior, and lower ground spreads across much of the west and south while higher ridges are concentrated in the north and northeast.
Hampton, Thornton, Harrell, and Tinsman are the main settlement references shown in the supplied views, but the county is not dominated by one dense urban area. Away from those places, creeks, ponds, sloughs, and long stretches of lightly settled land become more prominent. The on-page WebP previews are useful for reading the article, while the downloadable JPG originals are the better choice for printing, classroom handouts, presentations, or any layout that needs larger labels and sharper linework.
Table of Contents
Highway 167 gives Hampton a clear place on the county map
Hampton appears slightly south of the county’s center and is the easiest place to use as an anchor. Highway 167 runs through it from north to south, with routes 203 and 274 close by and Route 278 heading east toward Harrell. Farther north, Thornton is labeled near routes 79 and 205. The road pattern makes the two towns useful reference points: Hampton helps organize the middle and southern interior, while Thornton marks the northern part of the county.
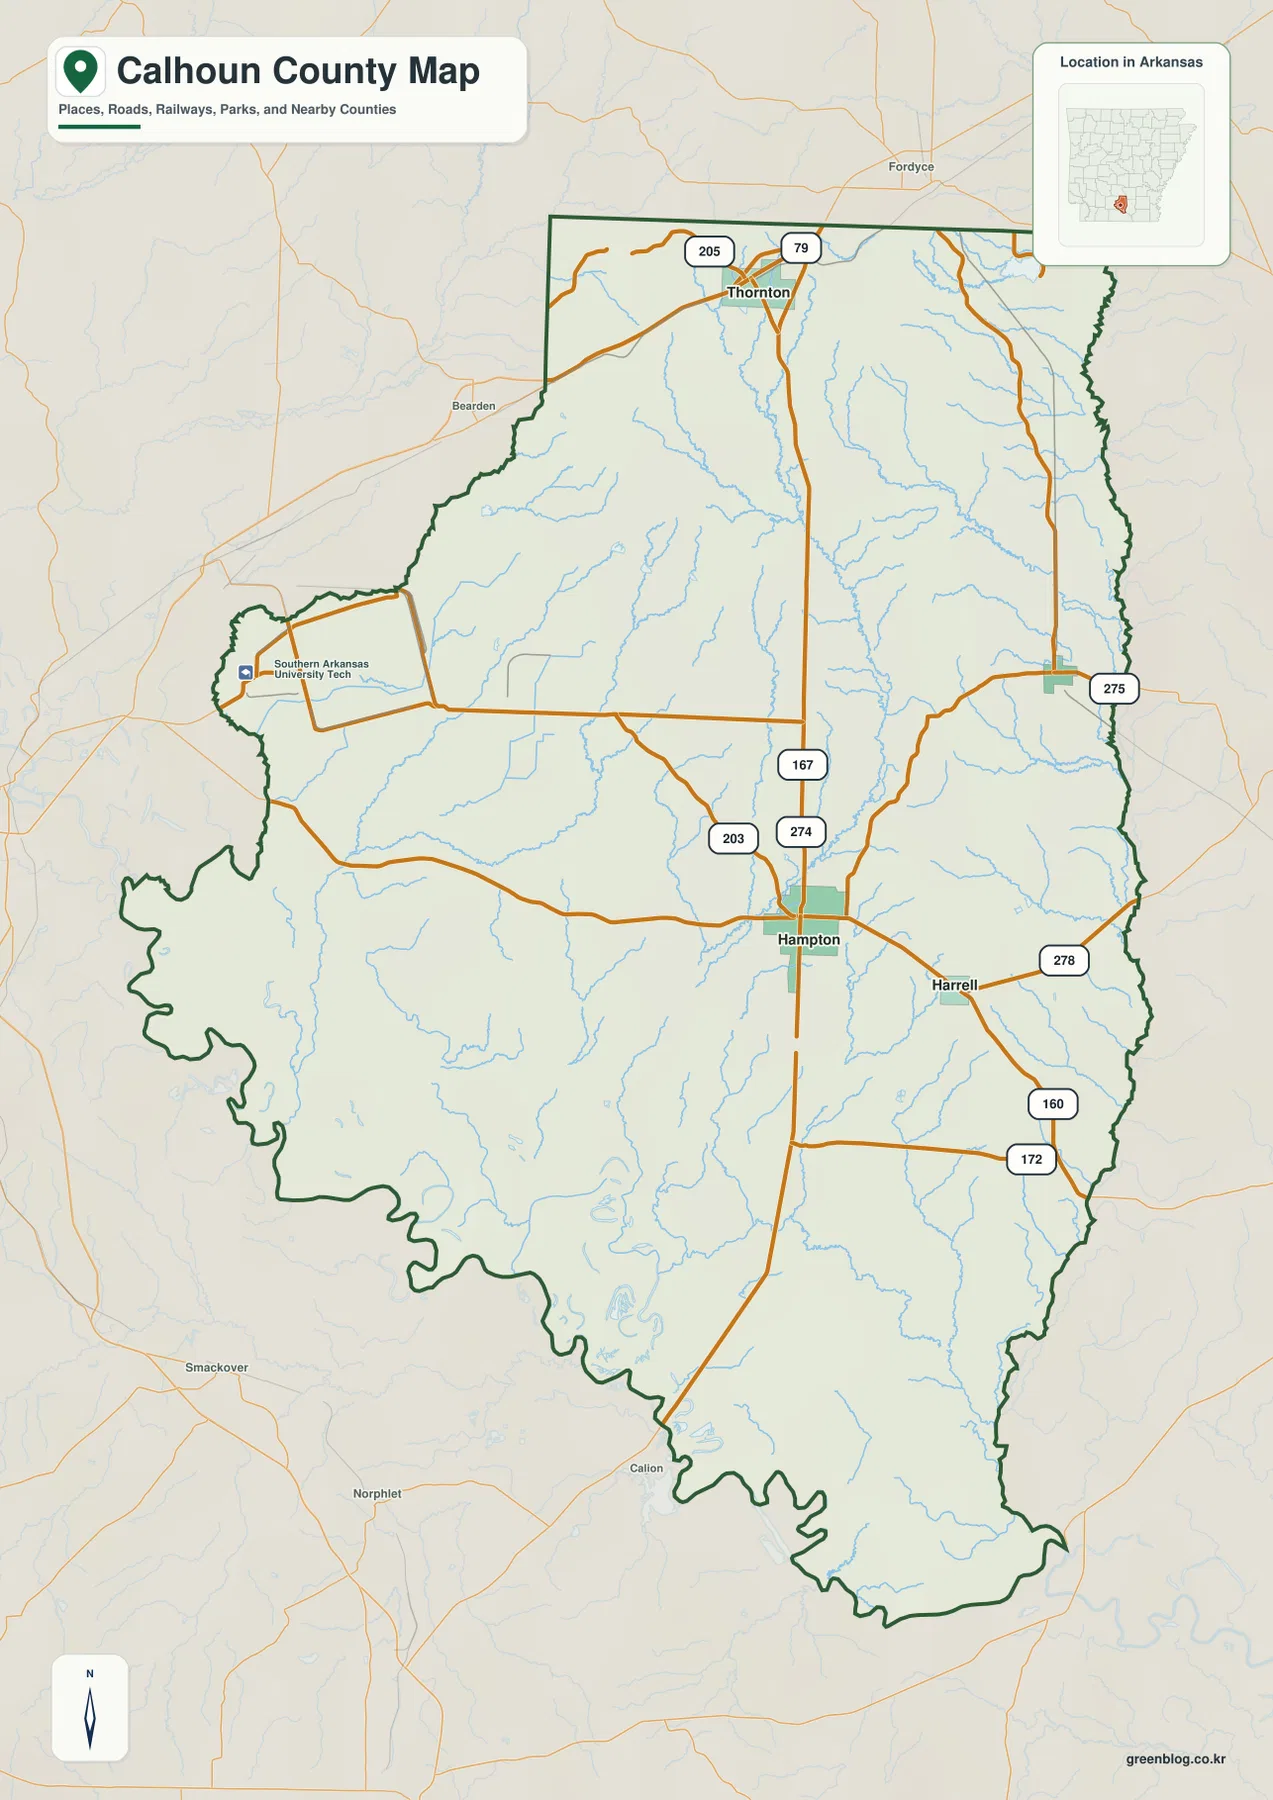
Harrell lies east of Hampton along Route 278, while Tinsman is farther to the northeast. Routes 275, 160, and 172 add more road references on the eastern side. The western and southern parts of the county look different because settlement labels thin out and small waterways become more noticeable. That contrast is useful for ordinary map reading: the roads are not distributed like a regular grid, and the named communities are concentrated in a few parts of a county whose outline is broad and irregular.
The county boundary itself is worth noticing. The western and southern edges contain long bends and repeated turns rather than a simple rectangular outline. Nearby county names—Dallas, Bradley, Ouachita, Union, and Cleveland—help place Calhoun County within the surrounding part of Arkansas. The map is suitable for general orientation, classroom use, and regional comparison, but a legal boundary, parcel question, or current road closure should be checked against the appropriate official source rather than inferred from this illustration.
Thornton, Harrell, and Tinsman show how sparse the settlement pattern is
The city-connections map removes much of the road detail and makes Hampton the hub. Harrell is labeled about 4 miles from Hampton, Tinsman about 10 miles, and Thornton about 17 miles. Those numbers are direct straight-line distances between the mapped city points, not mileage along a road. A real driving route can be longer because roads curve, change direction, or use different intersections, so the distances are best treated as a quick comparison of relative position.
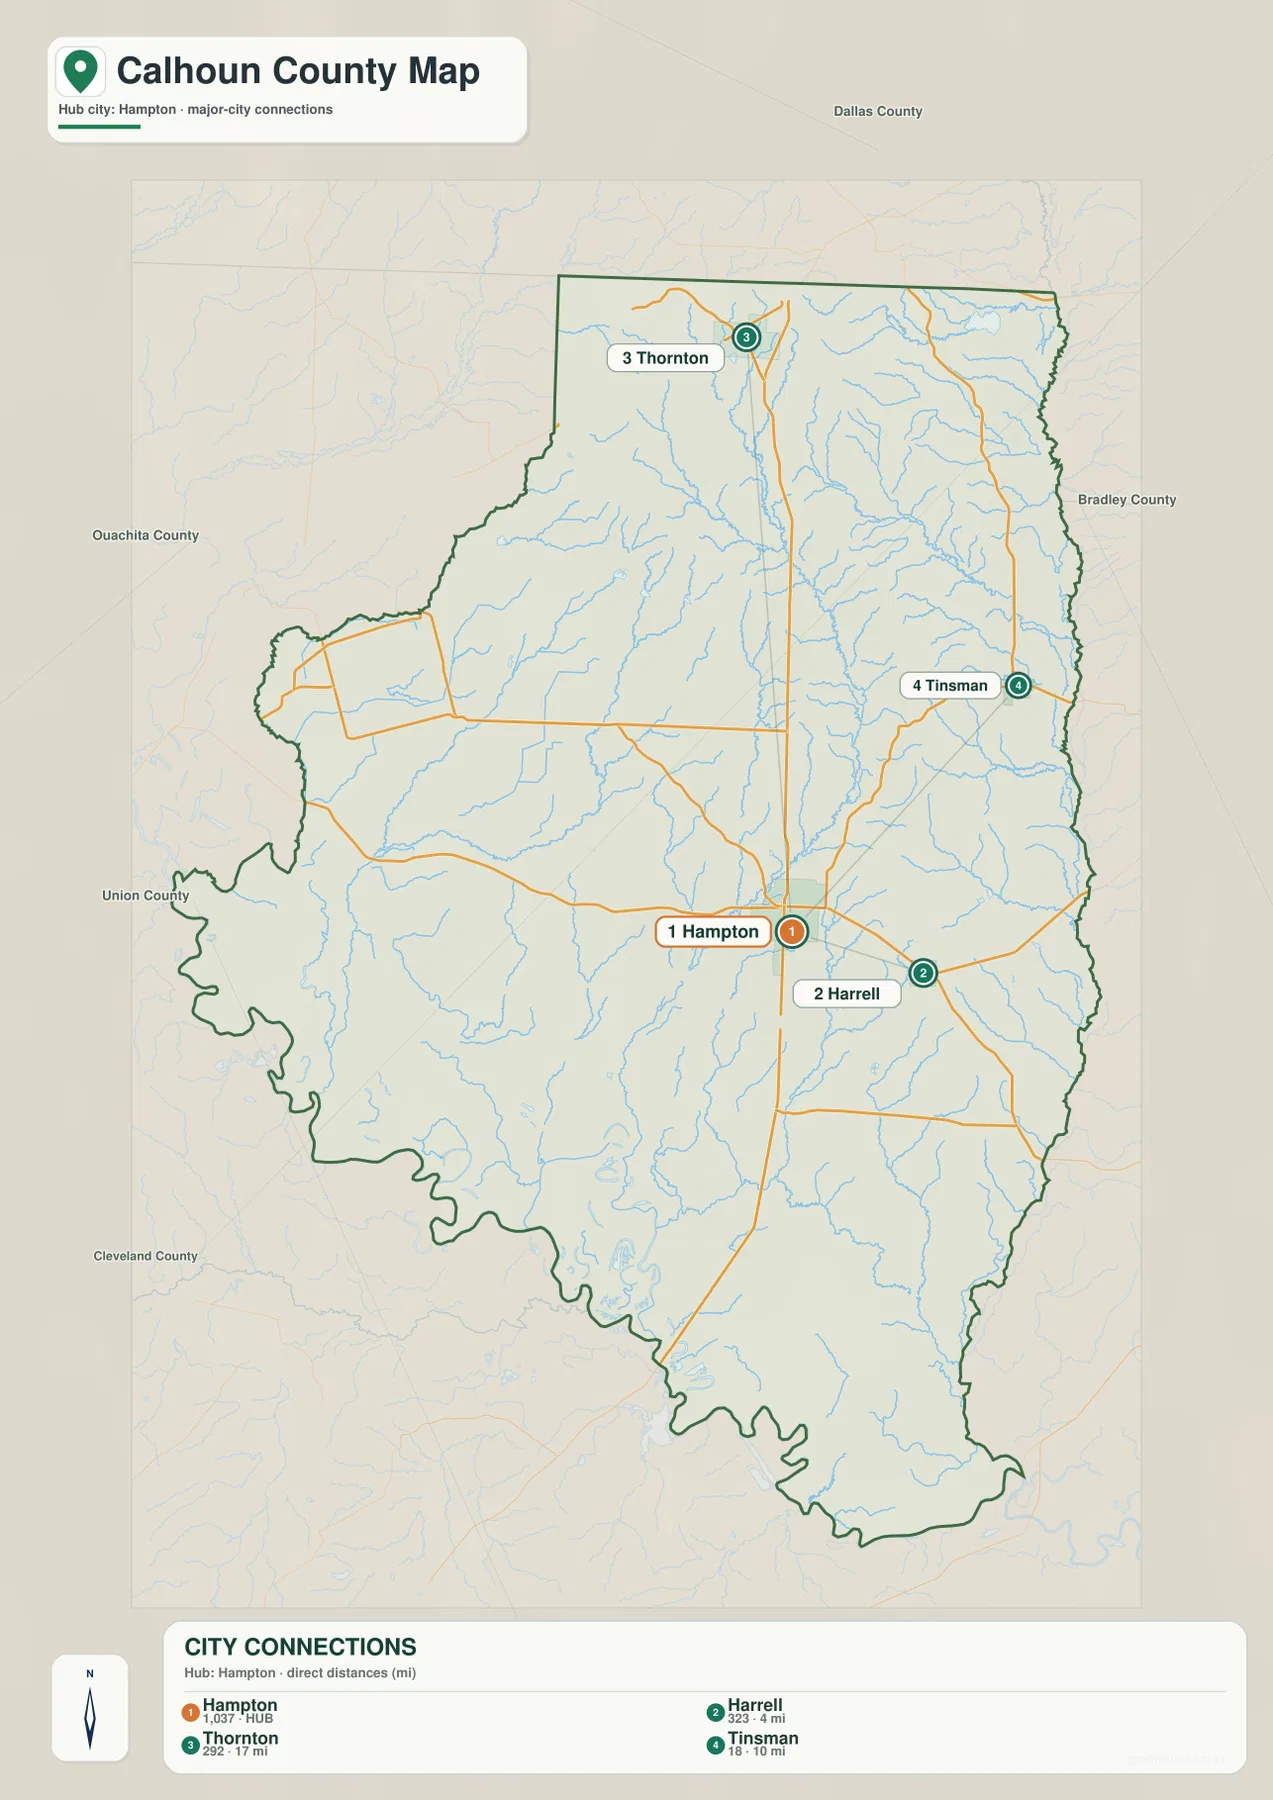
Direction adds context that the distance numbers alone do not provide. Thornton is north of Hampton, Harrell sits nearby to the east, and Tinsman is farther into the eastern half of the county. When this simplified view is compared with the general map, the relationships line up with the road network: Highway 167 points toward Thornton, while Route 278 leads toward Harrell. The city map therefore works well when the goal is to explain where the named communities sit without asking the reader to sort through every creek and road at the same time.
Hampton is identified in Arkansas reference material as the county seat, and the other mapped communities help describe how settlement is spread across the county. This view is not a population ranking and should not be used to judge the size or importance of one town against another. Current population figures belong in Census data. For this page, the useful point is geographic: a small number of communities are separated by wide areas where the map contains more streams and local roads than settlement names.
Champagnolle Creek leads into a southern cluster of lakes and sloughs
Water becomes the dominant subject on the terrain-and-water map. Champagnolle Creek runs through the central part of Calhoun County toward the south, and Little Champagnolle Creek is labeled farther north. Whitewater Creek and Hurricane Creek stand out on the eastern side, while Lambert Bayou and Caney Creek provide useful names in the west-central interior. Instead of one huge river or reservoir occupying the map, the county is crossed by many branching creeks and smaller water bodies.
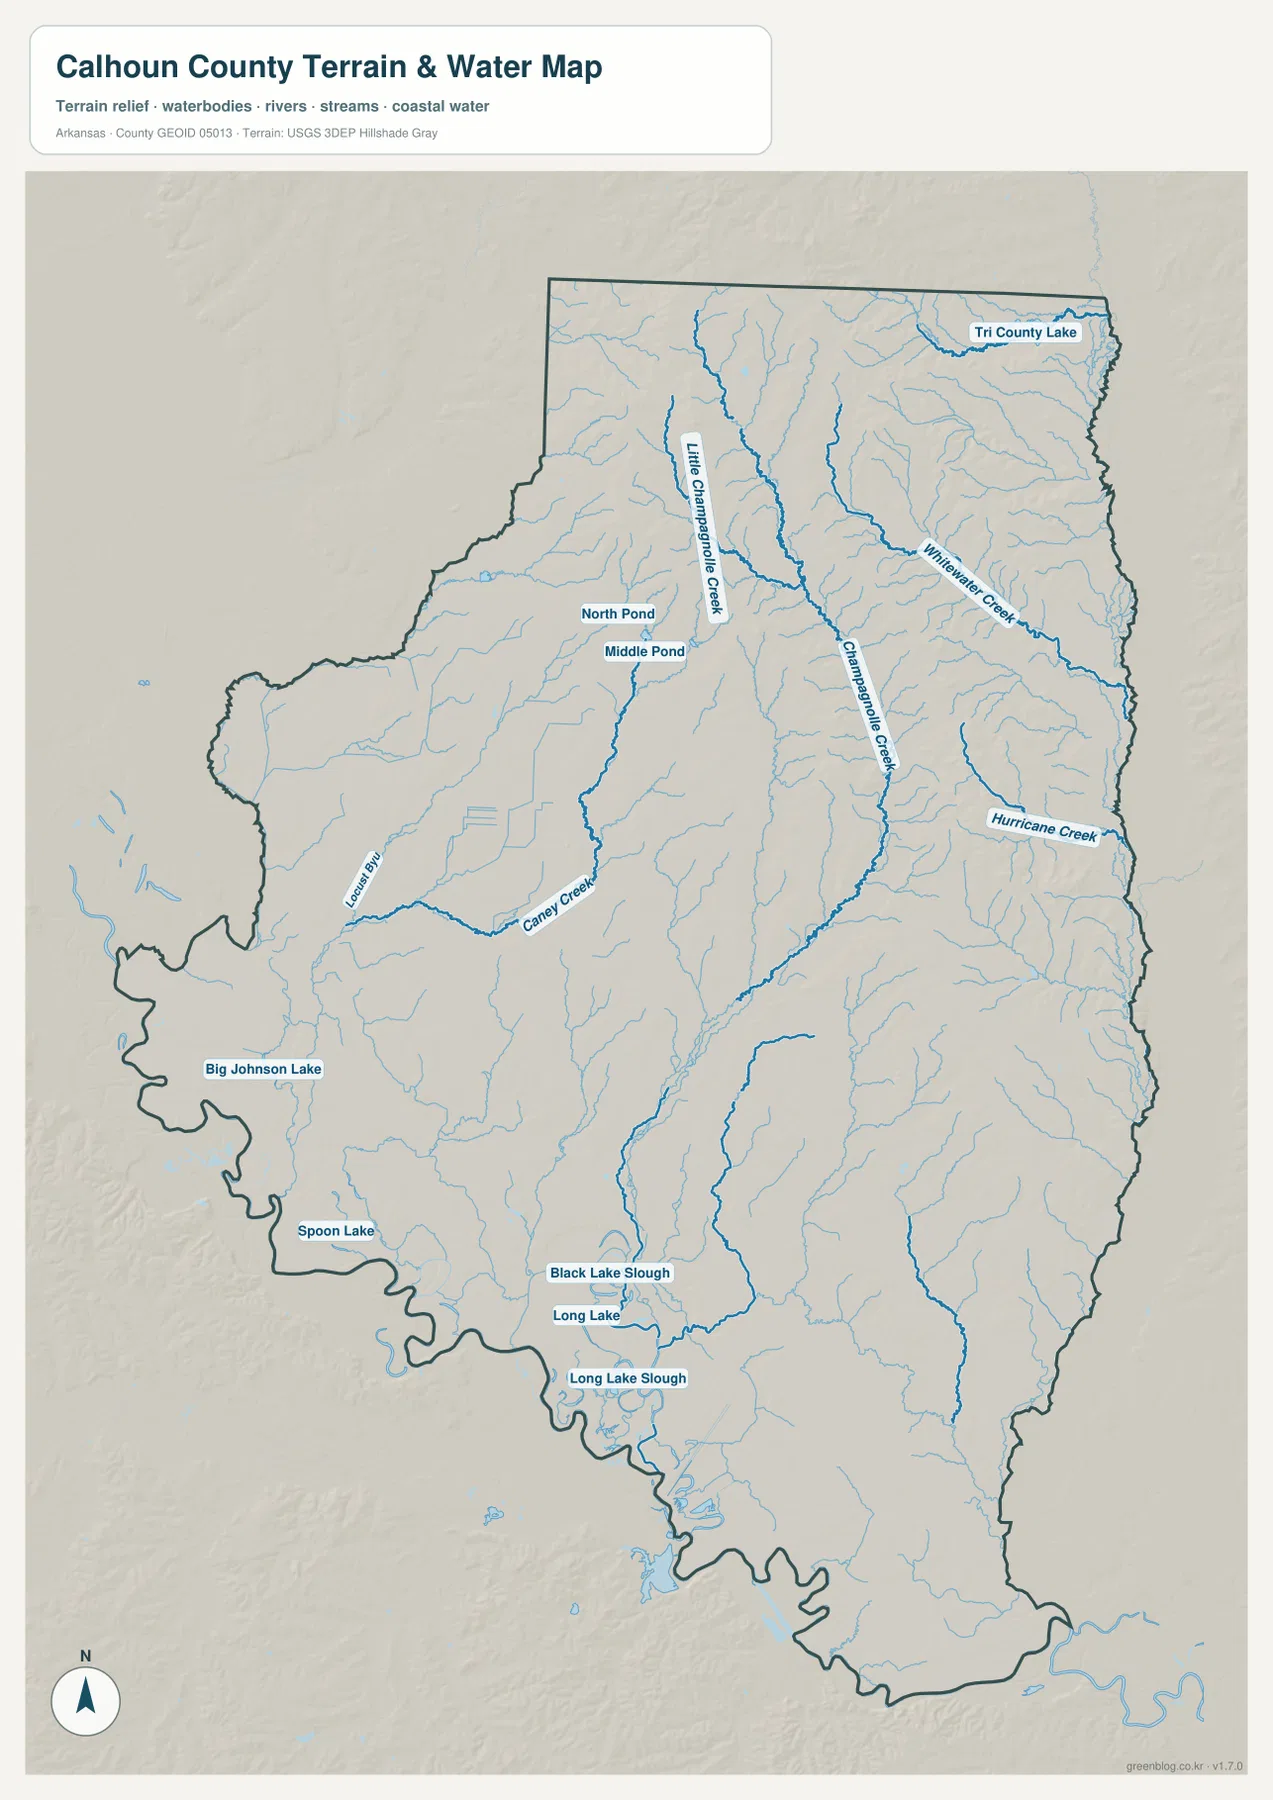
Named water bodies help distinguish one part of the county from another. Tri County Lake sits near the northeastern edge. North Pond and Middle Pond appear in the north-central interior, Big Johnson Lake lies farther west, and Spoon Lake is labeled in the southwest. The southern interior contains a particularly useful group of names: Black Lake Slough, Long Lake, and Long Lake Slough. These features can be easier to use as local references than road numbers when the subject is a creek corridor, wet lowland, or small lake.
The water layer is a location reference, not a flood, navigation, or property product. It does not show flood insurance zones, current stream levels, water depth, navigability, or parcel ownership. Those questions require the correct official datasets and current conditions. For general geographic reading, however, this map explains why the southern half looks so different from the northern road corridor: the landscape contains many winding channels and small water bodies that are easy to miss when roads and town labels are given more visual weight.
Northern ridges rise above the low ground around Long Lake
The elevation map reports an actual county range of roughly 21 to 121 meters, with a mean near 52 meters. The strongest high-elevation colors occur in the north and northeast, where branching ridges are separated by lower creek valleys. Much of the west and south is shown in greener, lower colors. Calhoun County is not mountainous, but the relief is large enough to create a clear difference between the rolling northern interior and the broad southern lowlands.
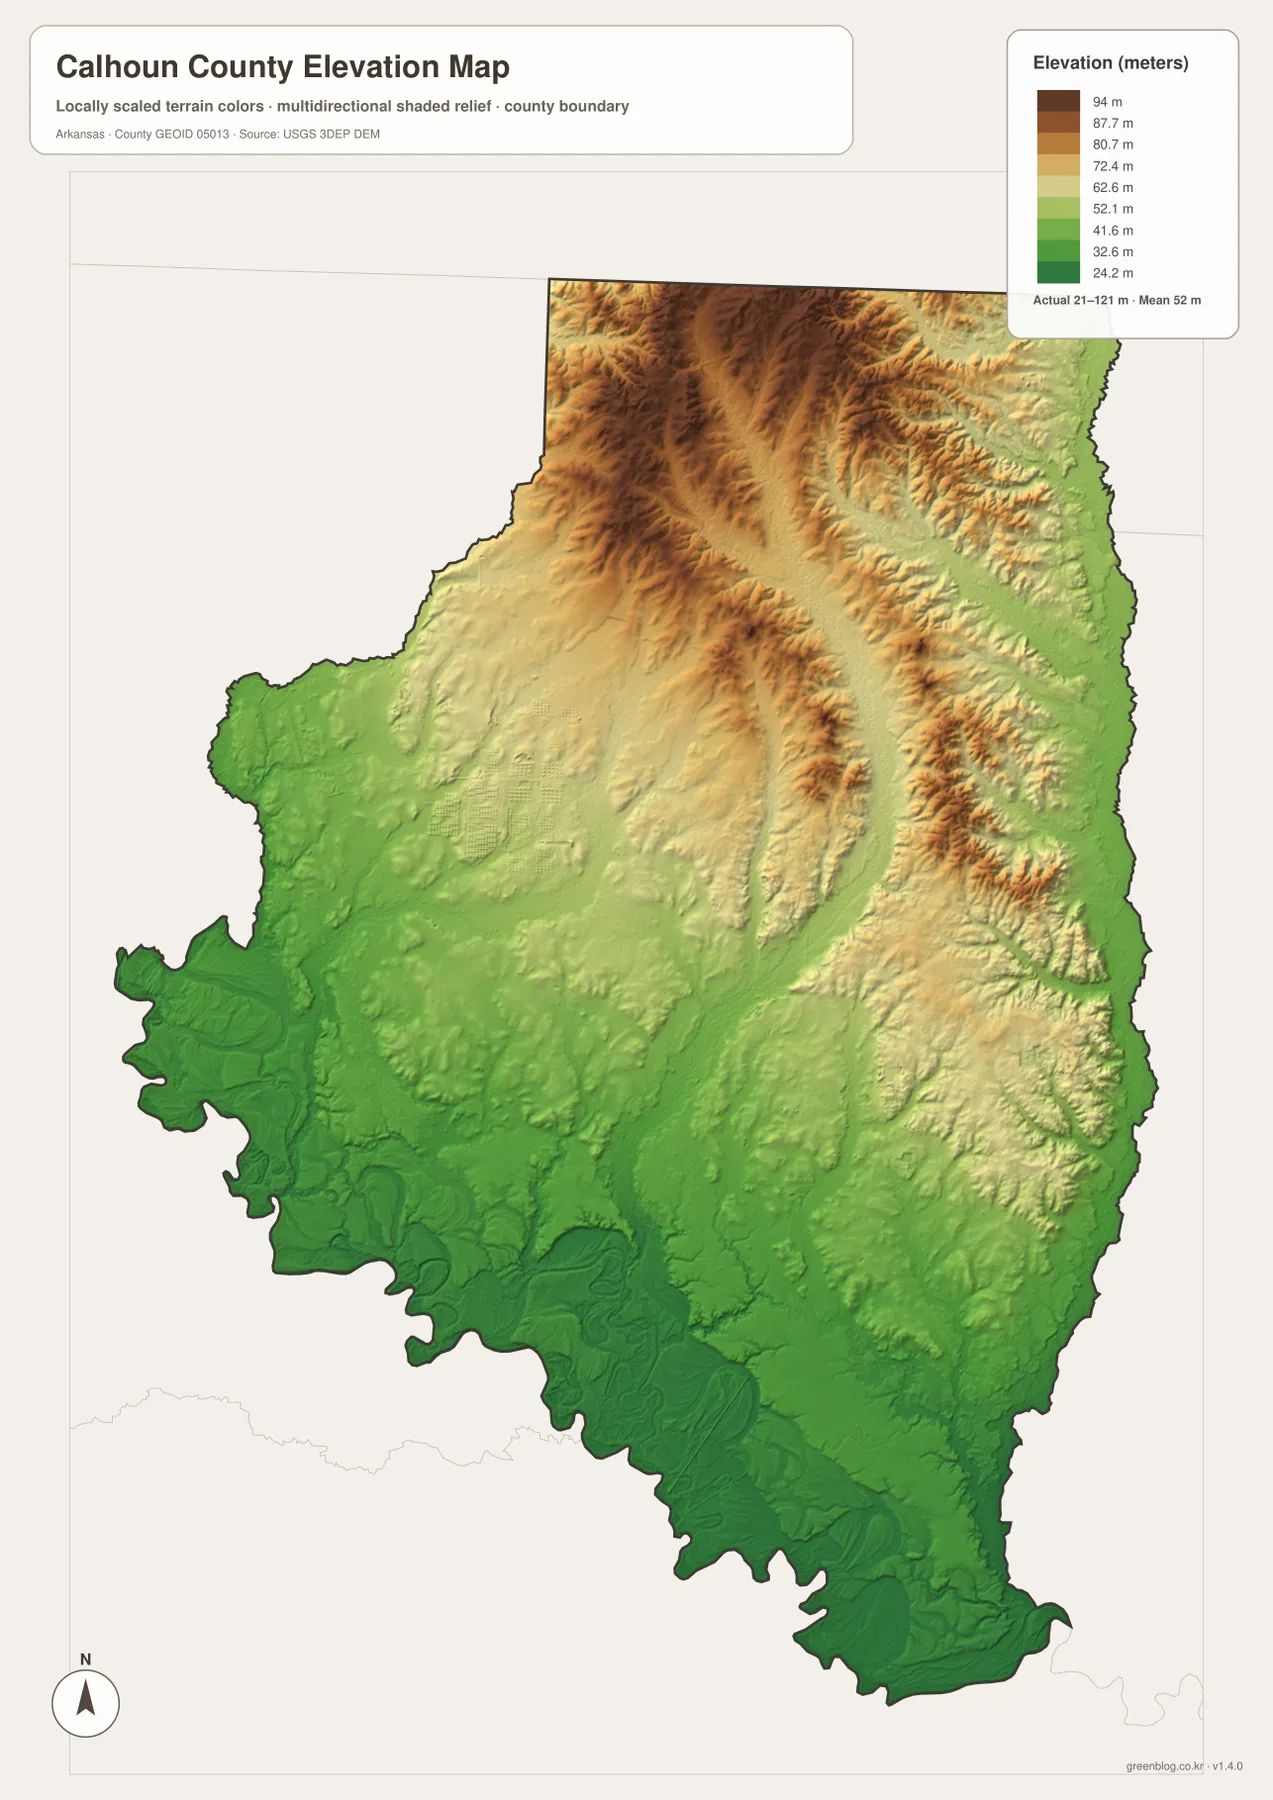
Comparing the elevation and water maps makes several features easier to understand. Lower green corridors follow many stream valleys, while tan and brown ridges occupy higher ground between them. Around Long Lake, Black Lake Slough, and the other southern water features, low colors spread across a broad area. Thornton and the northern interior show stronger relief. The result is a useful north-south comparison that can be seen without turning the map into a technical terrain study.
The shaded surface is generalized for county-scale viewing. It is appropriate for comparing broad high and low areas, but not for reading a precise elevation at a property, designing drainage, setting a road grade, or replacing a field survey. Projects that depend on exact heights should use the appropriate USGS elevation source and survey-grade information. On this page, the map is best used to explain why the creeks occupy lower corridors and why the northern part of the county has a more rolling appearance than the south.
A Hampton-to-Long-Lake route ties the four views together
One practical way to use the maps is to keep the same part of the county in mind while changing the view. Start at Hampton on the general map and note Highway 167, the eastbound road toward Harrell, and the nearby streams. The city map then simplifies the scene and shows how Thornton, Harrell, and Tinsman sit around Hampton. Switch to the water layer and Champagnolle Creek becomes much more prominent; move to elevation and the creek corridors appear as lower ground between the northern ridges.
The southern interior provides another useful example. Long Lake and Black Lake Slough are easy to locate on the water map, and the elevation view shows that the surrounding area belongs to the broader lowland part of the county. Thornton gives the opposite example: routes 79 and 205 are the strongest references on the road map, while the elevation surface shows higher and more broken terrain nearby. Using the same place across two or three maps makes the county easier to remember than reading each map as a separate product description.
Choose the file according to the question you need to answer. The general map is the strongest all-purpose choice for towns, numbered roads, streams, and the county outline. The city view is faster for comparing Hampton with the three labeled communities. The water map is better for Champagnolle Creek, Long Lake, ponds, and sloughs, while the elevation map makes the difference between the northern ridges and southern low ground immediately visible. For printing or a large document, the high-resolution JPG originals in the ZIP will retain labels and linework better than a browser screenshot.
Frequently Asked Questions
Are the Hampton-to-Harrell, Tinsman, and Thornton distances driving miles?
No. The city-connections map uses straight-line distance between the mapped city points. Harrell is shown about 4 miles from Hampton, Tinsman about 10 miles, and Thornton about 17 miles. Actual driving mileage and travel time can be different, so use the city map for relative position and a current navigation service for a real trip.
What is the easiest way to compare Long Lake with the county’s elevation?
Locate Long Lake and Black Lake Slough on the water map first, then compare the same southern area on the elevation map. The surrounding terrain is shown in broad low-elevation colors, which matches the general lowland character of the southern interior. The elevation layer is generalized, so it should not be used to read an exact property elevation.
Which map should I use for Champagnolle Creek and the smaller named lakes?
Use the water-and-terrain map. It gives stronger emphasis to Champagnolle Creek, Little Champagnolle Creek, Whitewater Creek, Hurricane Creek, Lambert Bayou, Caney Creek, and named water bodies such as Tri County Lake, Big Johnson Lake, Spoon Lake, and Long Lake. The general county map is better when roads and towns are the main concern.
Map File Information
The ZIP contains the A3 high-resolution JPG originals for the Calhoun County general map, city map, water-and-terrain map, and elevation map. They are suitable for larger layouts, classroom materials, documents, presentations, and printing.
- Included Files: Use only the versions confirmed in the article and supplied images
- File Type: Use the confirmed download contents
- Intended Use: Printing, education, presentations, and map-based projects
Related Maps
Sources and References
These references are useful for checking county background, boundaries, hydrography, and elevation. The maps on this page are intended for general geographic reference and printing rather than legal boundary decisions, surveying, flood determination, or real-time navigation.
- Encyclopedia of Arkansas – Calhoun County
- U.S. Census Bureau TIGER/Line Shapefiles
- USGS National Hydrography
- USGS 3D Elevation Program
Green Map creates custom-edited map images using open geographic data sources such as geoBoundaries, Natural Earth, OpenStreetMap, and government open data.
These maps are edited visual materials, not raw data files, and are provided for education, documents, presentations, and graphic reference.