Benton County sits in the northwest corner of Arkansas, and the supplied maps show a county with two very different visual sides. Around Bentonville and Rogers, cities and roads crowd together through the center and north. Farther east, the map opens into a landscape dominated by the branching outline of Beaver Reservoir, the White River, narrow valleys, and higher ridges. The western side places communities such as Siloam Springs, Gentry, Gravette, and Centerton farther apart among long creeks and lower terrain. You can examine the web-sized maps on this page and download the matching high-resolution JPG files in one ZIP when you need them for print, classwork, reports, or presentations.
The four supplied views are most useful when they are read as parts of the same county rather than as unrelated map products. The overview establishes the boundary, towns, and road network. The city-index image strips away much of that detail so the six labeled population centers are easier to compare. The water map reveals Beaver Reservoir, Little Sugar Creek, the Illinois River, and the smaller lakes and tributaries that are easy to miss on the overview. Finally, the elevation image reports an actual county range of about 263 to 551 meters and shows how lower western valleys give way to more strongly dissected terrain in the east. Moving between the maps makes the geography much clearer than relying on any single image.
Table of Contents
A dense Bentonville–Rogers core surrounded by more separated towns
The county overview is visually busiest around Bentonville and Rogers. Roads cross at short intervals, developed areas nearly touch, and nearby places such as Centerton, Little Flock, Cave Springs, and Lowell fill the central part of the map. This is the easiest area to use as an orientation anchor. Once Bentonville and Rogers are located, Bella Vista lies to the north, Pea Ridge sits farther northeast, and the map stretches west toward Gravette and Gentry and southwest toward Siloam Springs. The pattern is not simply one large city in the middle; it is a cluster of several connected communities, with a second set of towns spread across the western half.
Numbered roads help separate those areas without requiring a full street map. Route 94 appears near Bella Vista, while 72 runs toward Pea Ridge. Route 62 crosses the east side near Rogers and continues toward Gateway, providing a useful eastward reference from the urban core. On the west, 59 and 102 appear around Gravette, 12 runs through the Gentry area, and 43 and 116 follow the western side. Near the south, 412 gives Siloam Springs a strong east-west reference, while 16 is shown farther south. The map also labels 264 near the southern central boundary. These routes are best used to understand relative position and connection, not as a substitute for current turn-by-turn navigation.
The county outline is worth noticing because the southern edge is not a straight line. It steps inward and outward around the Springdale and Siloam Springs sides, while the eastern boundary also contains sharp changes around the reservoir and river country. That irregular shape matters when a place sits near the edge of the county. A road may continue smoothly across the map even though the county line changes direction nearby. For a classroom map or general county profile, the heavy boundary line is therefore a better guide to county extent than the road network alone.
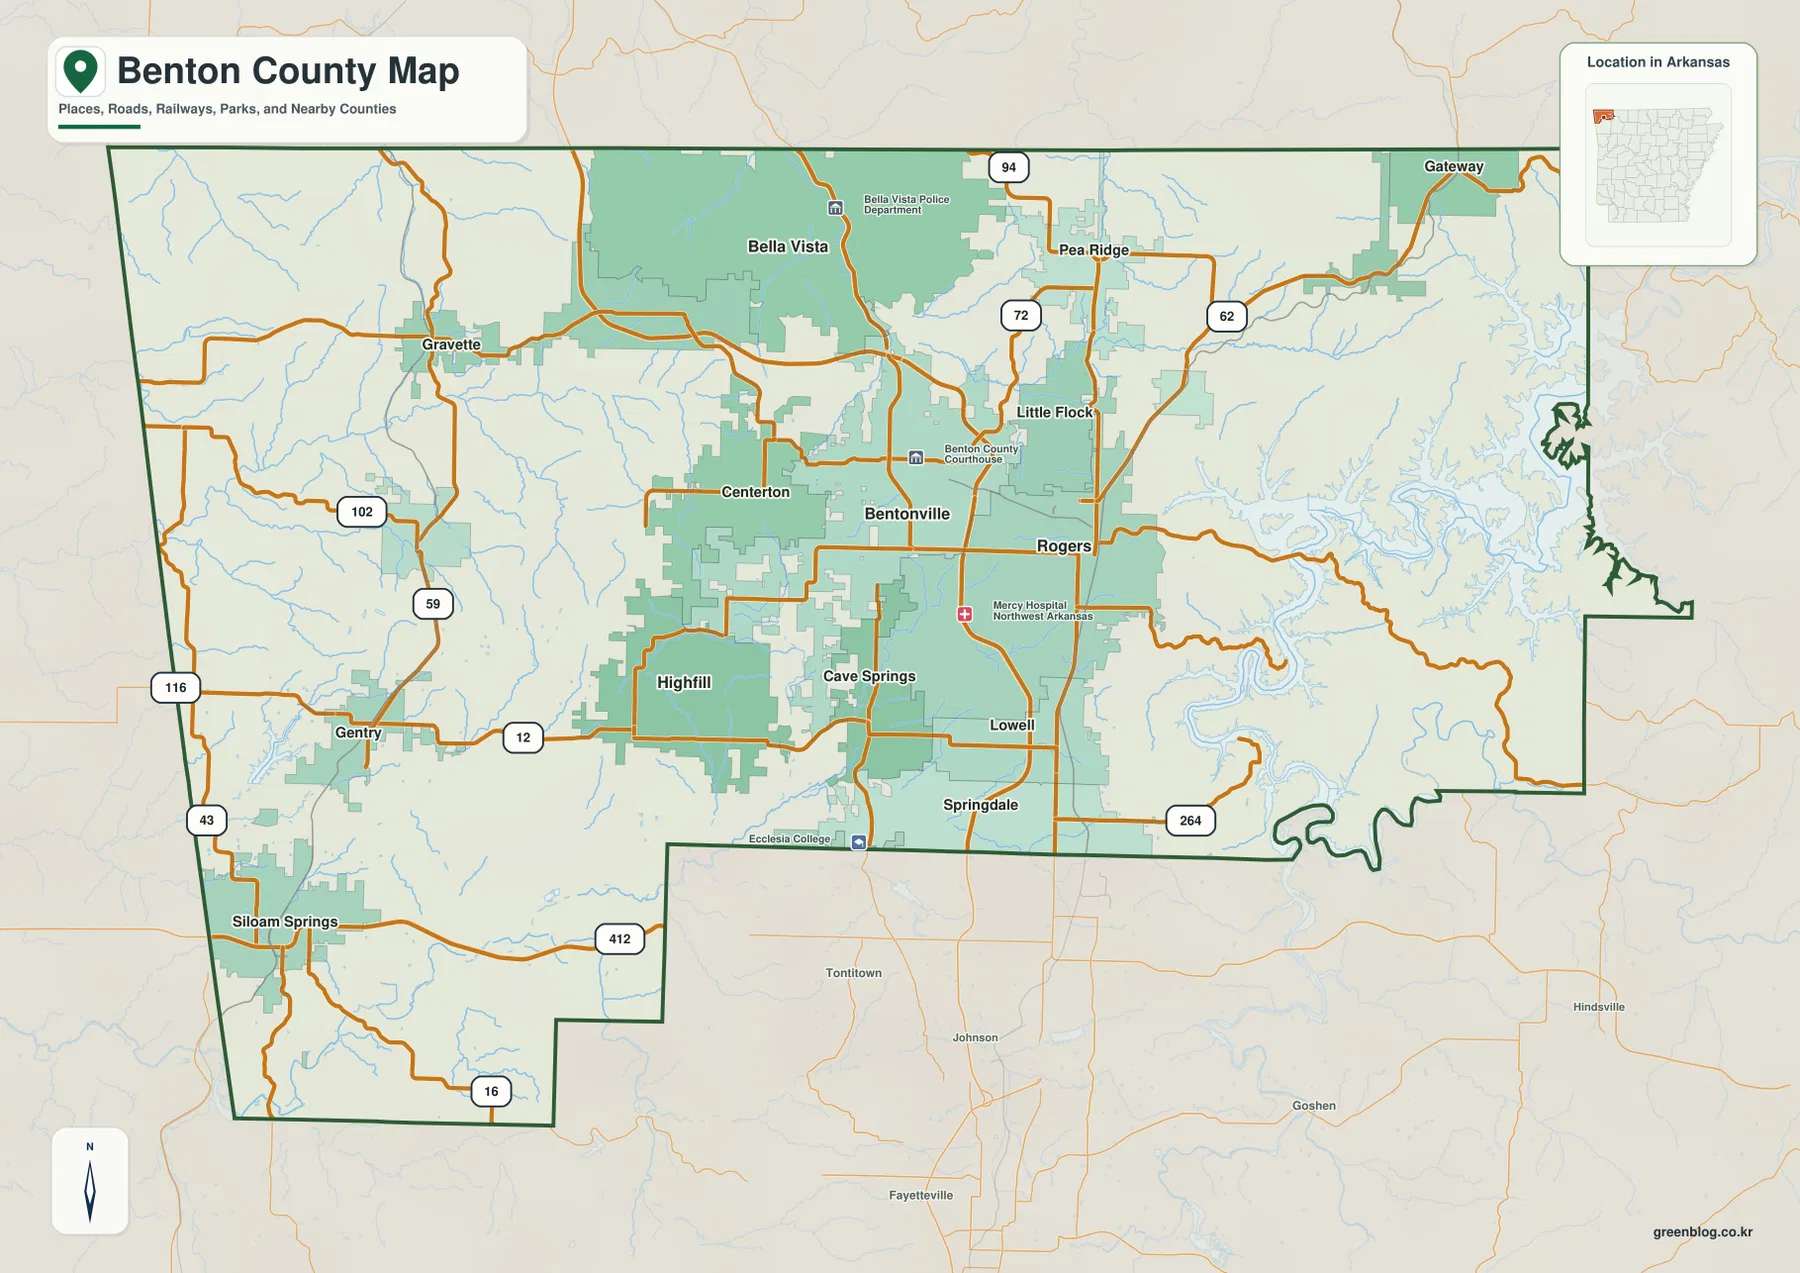
This overview is the best starting image when a project needs several kinds of information on one page. It can show that Bentonville and Rogers occupy the central urban concentration, that Bella Vista is farther north, and that Siloam Springs is separated to the southwest. It also leaves enough water and terrain context visible to make later comparisons with the specialized maps meaningful. What it does not provide is parcel ownership, legal survey boundaries, live traffic, construction closures, or precise travel time. Those tasks require more specialized and current sources.
The city index makes the county’s two-center pattern easier to see
The city-index map ranks six places and prints reference values directly in the legend: Rogers 72,981; Bentonville 58,249; Bella Vista 31,697; Centerton 21,920; Siloam Springs 18,699; and Lowell 10,849. These figures belong to the supplied map and should be treated as map reference values rather than a claim about the latest live population totals. If a current census estimate is required, it should be checked separately. For map reading, however, the ranking does a useful job of showing which named communities the graphic treats as the largest and where those communities sit within the county.
Location is more revealing than rank by itself. Rogers and Bentonville sit almost side by side in the central-eastern part of the county, while Centerton is immediately to their west and Lowell lies south of Rogers. Bella Vista is north of that cluster and still connected to the same general developed corridor. Siloam Springs breaks the pattern. It appears far to the southwest, separated from the other five by a broad stretch of the county. This makes the city-index image especially useful for explaining why Benton County does not read as one compact urban circle even though several of its largest communities are close together.
The simplified design also prevents small road labels and minor place names from competing with the main settlement story. On the full overview, it is easy to focus on road shields, waterways, or the irregular boundary. On the city map, the six markers become the subject. The central cluster of Rogers, Bentonville, Centerton, and Lowell is unmistakable, Bella Vista extends the developed pattern northward, and Siloam Springs establishes a separate southwestern focus. That is a cleaner way to present settlement distribution in a slide or a short report when detailed transportation information would only distract from the point.
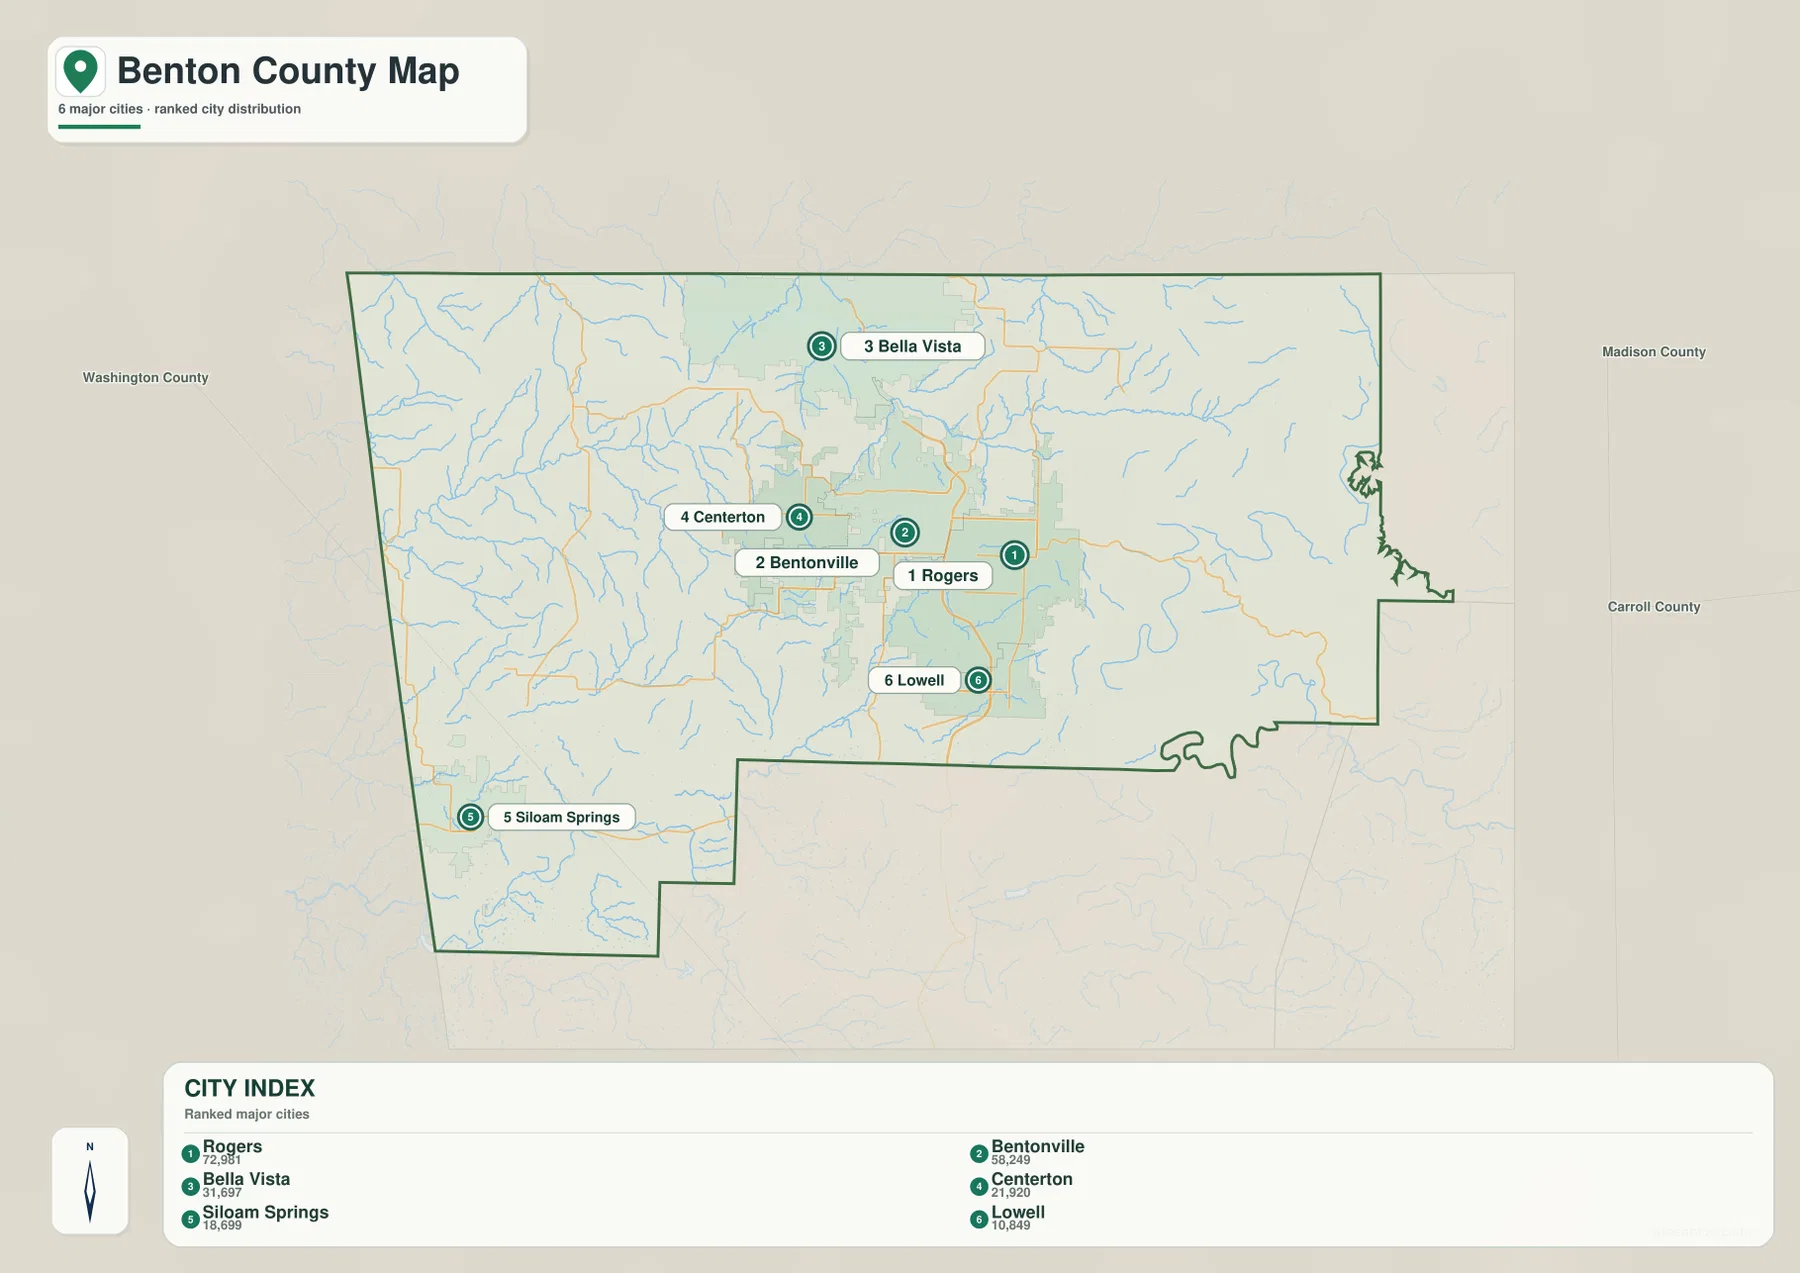
Because the markers summarize selected cities, the image should not be interpreted as a complete municipal boundary map or a population-density map. It does not show where every resident lives, and the size of a marker is not a legal city limit. Use it for relative placement and the supplied ranking, then return to the overview when roads and smaller communities such as Pea Ridge, Gentry, Gravette, Cave Springs, or Gateway need to be added to the explanation.
Beaver Reservoir changes the eastern half from a road map into a water landscape
The terrain-and-water map changes the visual emphasis completely. On the eastern side, Beaver Reservoir spreads into long branching arms around the White River. Rather than forming one simple oval lake, the water follows narrow valleys and creates a deeply indented shoreline. The reservoir and river occupy so much visual space that the eastern part of Benton County becomes easier to understand through drainage than through town names. This is the strongest contrast with the Bentonville–Rogers side of the county, where roads and developed areas dominate the overview.
Northern waters add a second layer of detail. Lake Avalon, Lake Windsor, and Lake Ann are grouped near the north-central part of the county, close to the Bella Vista area on the other maps. Little Sugar Creek runs eastward across the north and receives many small tributaries before the drainage approaches the reservoir country. When the city and water maps are compared, these features explain why the northern part of the county is not simply a continuous developed surface. Lakes, stream valleys, and irregular relief remain embedded within and around the settled area.
The west and southwest have a different water pattern. Spavinaw Creek crosses the western side, while Crystal Lake, Swepco Lake, and Siloam Springs Lake appear as smaller named water bodies. The Illinois River becomes a prominent line in the southwest corner. Flint Creek runs through the interior west of center, and Spring Branch and Osage Creek appear closer to the middle of the county. Instead of one dominant reservoir with a maze of arms, the western side is organized by elongated creeks, river valleys, and scattered lakes. That contrast is one of the most county-specific observations available in the supplied maps.
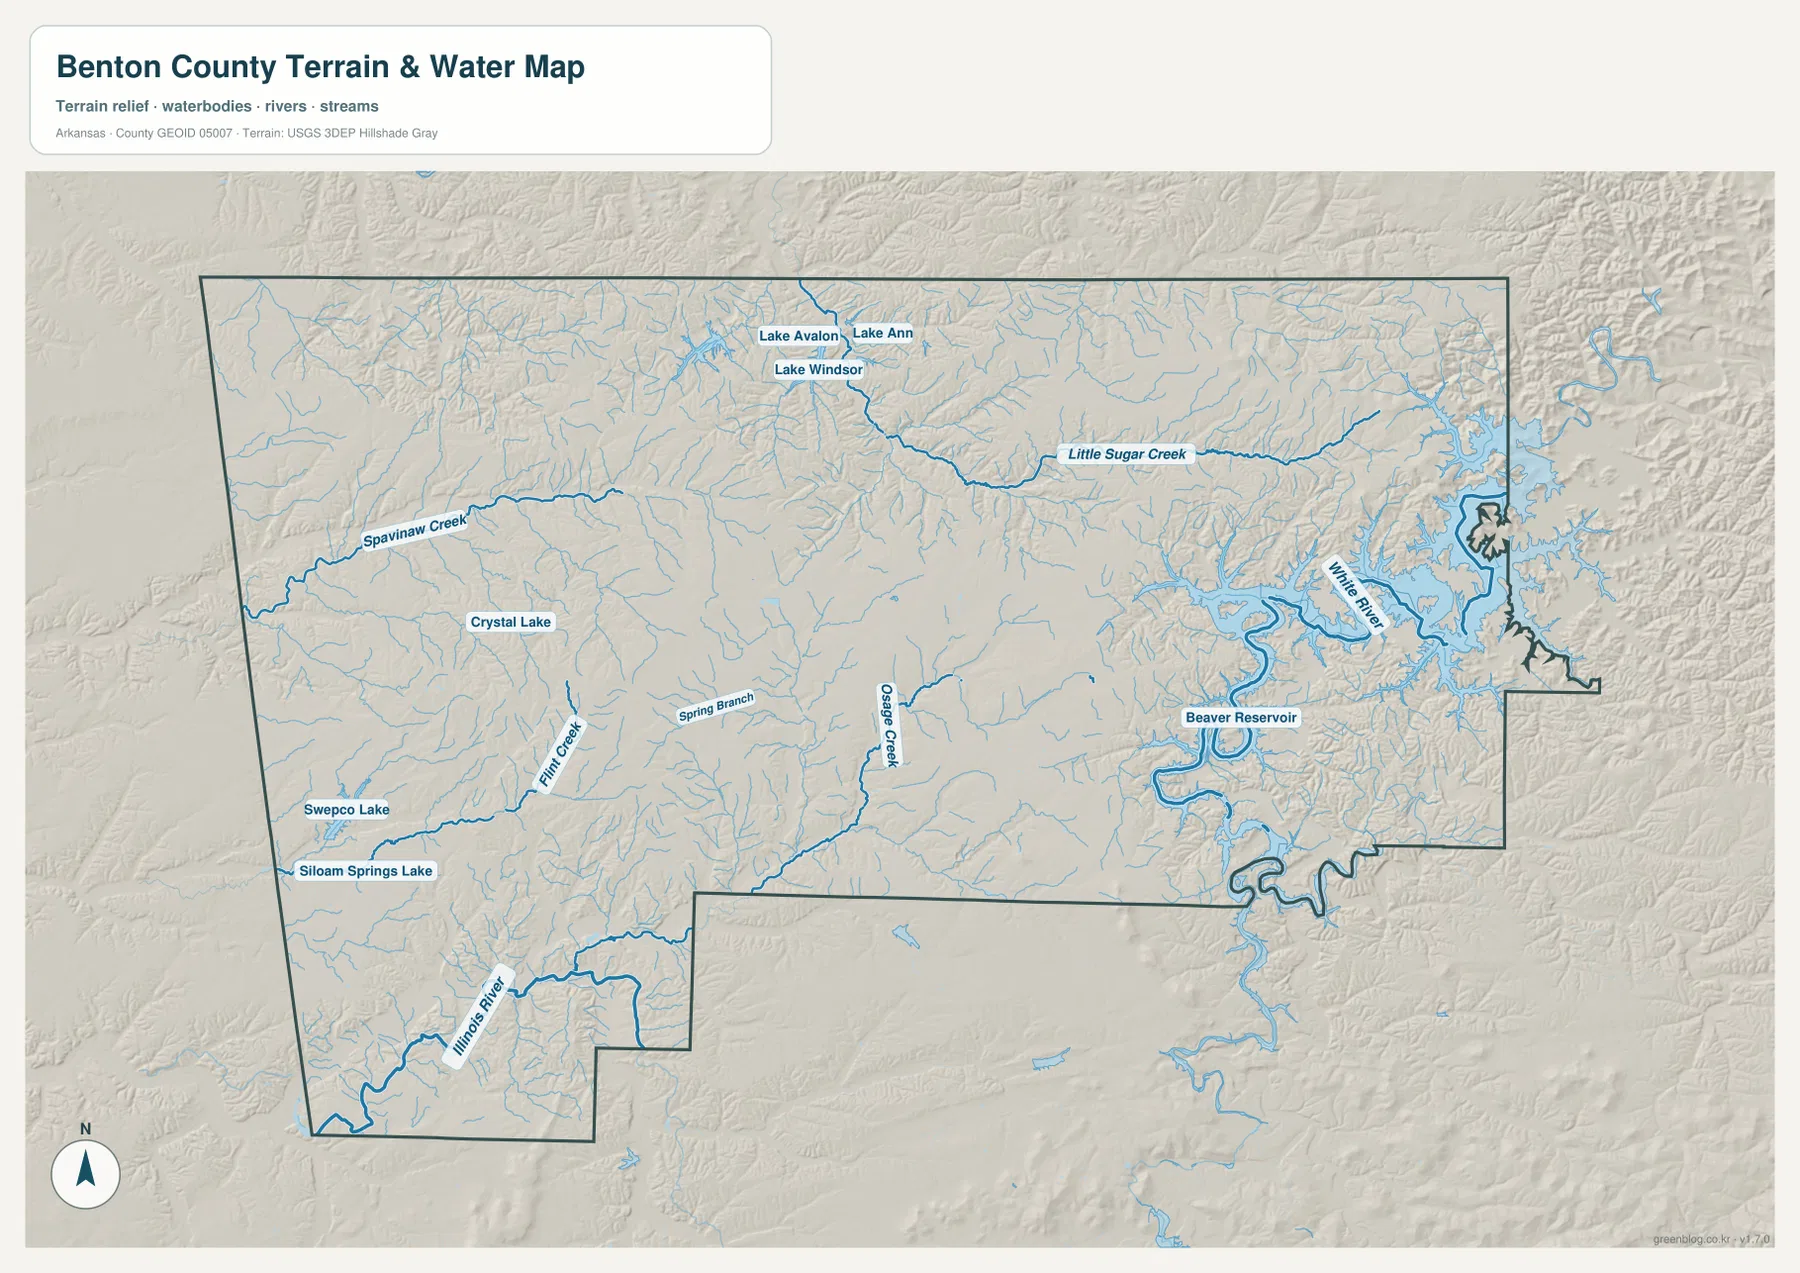
This image is intended for general geographic reference. It does not establish current reservoir level, flood hazard, navigable depth, shoreline ownership, fishing access, or legal riparian boundaries. Reservoir shorelines can change with water level, and small streams may be generalized at county scale. Anyone making a safety, property, engineering, or regulatory decision should use the appropriate current agency data rather than treating this illustration as an operational map.
Relief rises from broad western lows to sharper eastern ridges
The elevation map reports an actual Benton County range of roughly 263 to 551 meters and a mean near 376 meters. Its broadest low colors appear in the west and southwest, where green valleys spread around the Illinois River and other drainage corridors. Moving toward the middle of the county, greens give way to more yellow and tan surfaces. The east and northeast contain the strongest brown ridges and the tightest pattern of hills cut by narrow green valleys. The difference is substantial enough that the county looks almost like two relief zones joined through a more moderate central area.
The Beaver Reservoir area is the clearest place to connect elevation with water. On the water map, the reservoir extends into many branching arms. On the elevation image, those same arms occupy lower green corridors surrounded by higher brown and tan ridges. The result is a repeated ridge-and-valley pattern rather than a flat basin around the lake. The eastern edge also contains some of the darkest high-elevation colors, while narrow stream courses descend through them. This relationship helps explain the reservoir’s complex shape without requiring technical terrain terminology.
The western side deserves a closer look because “lower” does not mean “flat.” The Illinois River valley and other stream corridors are broad and green, but rounded hills and smaller ridges still break up the surface. Near the center, the relief becomes more mixed and gradually higher. Around the dense Bentonville–Rogers area, the map generally shows moderate colors rather than the darkest eastern highs. This makes the urban core easier to distinguish from the rugged reservoir country when the city and elevation images are placed side by side.
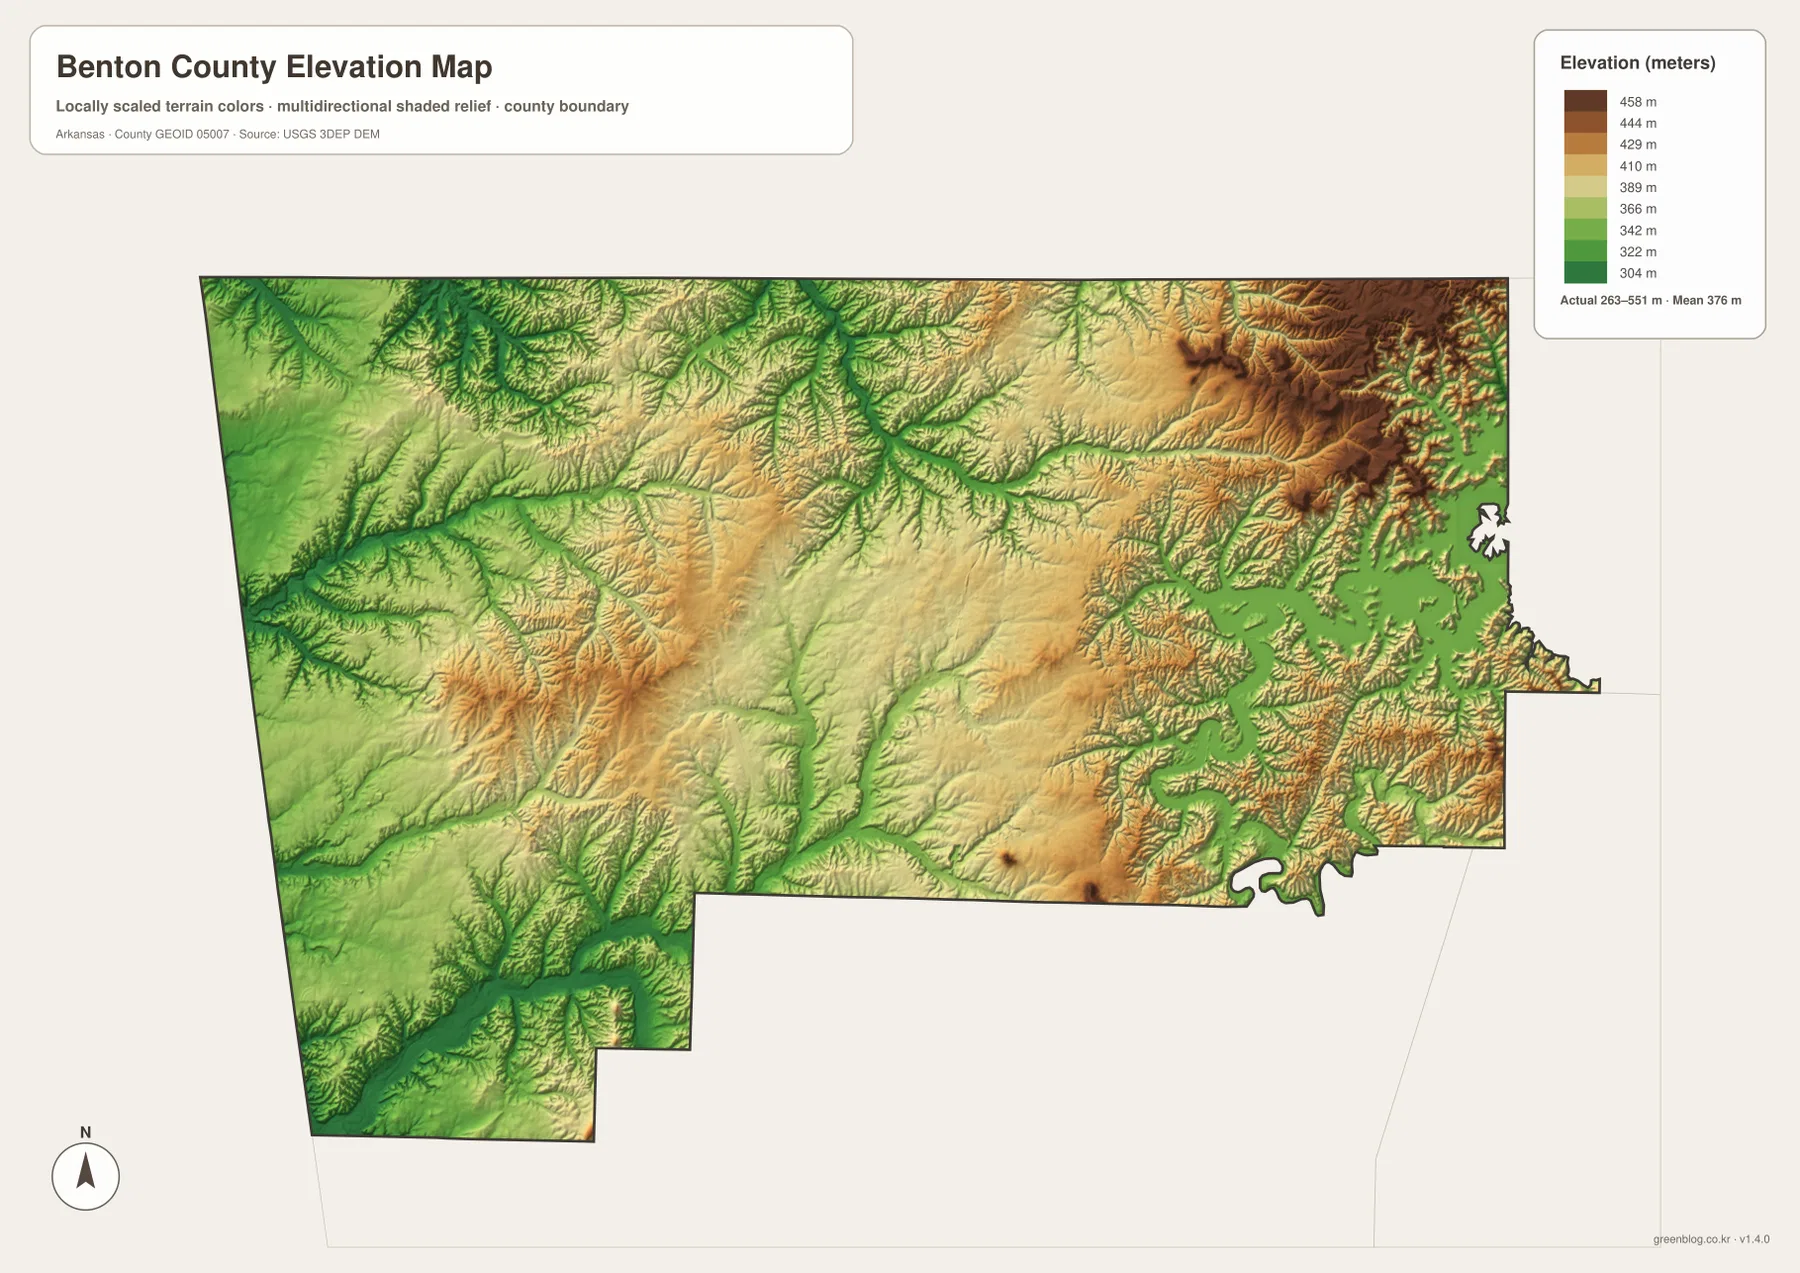
The local color scale is designed to make countywide differences visible, so dark brown should not be read as a universal category such as “mountain” and green should not automatically be read as wetland or floodplain. They are relative elevation colors within Benton County. The map is also not survey grade. It cannot provide the exact height of a house site, road centerline, bridge, property corner, or drainage structure. Detailed construction and land work should use original USGS elevation data and professional surveying where appropriate.
Following the same place across the maps reveals more than any one layer
Bentonville and Rogers make a good first comparison. The overview shows the most concentrated road network around them. The city-index map places Rogers first and Bentonville second in the supplied ranking, with Centerton and Lowell close by. On the water image, smaller creeks cross this urban area, but the broad surface water seen in the east is absent. The elevation map then shows a relatively moderate central surface, with more pronounced ridges appearing toward Beaver Reservoir. Each image adds a different piece without changing the location of the cities themselves.
Siloam Springs produces a very different sequence. The city-index image separates it clearly from the central cluster. The overview ties it to Route 412 and the western road network. The water map adds Siloam Springs Lake and the nearby Illinois River, while the elevation map places the southwest within some of the broadest lower terrain in the county. The same city therefore becomes a road reference, a settlement reference, and a river-valley reference depending on the map being used.
Bella Vista is useful for the northern section. It has a large developed footprint on the overview and appears third in the supplied city ranking. The water view places Lake Avalon, Lake Windsor, and Lake Ann close to this northern settlement area, with Little Sugar Creek extending eastward. On the elevation image, the north contains both hills and cut valleys rather than a uniform plateau. This is a good example of why the county’s developed areas should not be described without also considering the water and relief beneath them.
The eastern reservoir country works in reverse: start with nature rather than a city. Find Beaver Reservoir and the White River on the water map, then notice the surrounding ridges and valley cuts on the elevation image. Return to the overview afterward and Route 62, Gateway, Rogers, and the county boundary provide the human reference points. What first looked like a lightly labeled area on the road map becomes one of the most geographically detailed parts of the county.
Which file works best for print, school projects, and county profiles
Choose the overview when the assignment needs towns, roads, waterways, and the county outline together. Use the city-index map when the central question is where Rogers, Bentonville, Bella Vista, Centerton, Siloam Springs, and Lowell sit relative to one another. The terrain-and-water view is the strongest choice for Beaver Reservoir, the White River, Little Sugar Creek, the Illinois River, and the smaller lakes and creeks. The elevation map is better when the point is the contrast between lower western valleys, moderate central ground, and the more dissected ridges of the east.
The WebP images in the article are reduced for faster page viewing. The downloadable archive contains the corresponding JPG originals at 3638 × 2572 pixels each. Those larger files preserve road shields, small labels, stream names, and relief detail better when a map is printed or placed at a large size in a document. The archive is named benton_county_arkansas_4_map_jpg.zip, and each map is stored as a separate image so you can use only the file that supports your project.
Frequently Asked Questions
Which Benton County map is best for comparing Bentonville and Rogers?
Use the county overview when you need roads and nearby communities as well as the two city names. Use the city-index map when the main goal is to show how close Rogers and Bentonville are and how Centerton, Lowell, Bella Vista, and Siloam Springs relate to that central cluster. The two maps complement each other well in a short county profile.
Why does Beaver Reservoir look so branched on the water map?
The supplied water map shows the reservoir extending through narrow valleys along the White River system rather than occupying one round basin. The elevation map makes that relationship clearer because the reservoir arms sit in lower corridors between higher ridges. The maps are suitable for general geographic explanation, not for determining current shoreline or water level.
Can the 263–551 meter elevation range be used for a specific property?
No. The range summarizes the countywide values reported on the supplied elevation map. It is useful for comparing the lower west with the higher, more dissected east, but it does not provide parcel-level or construction-grade elevation. Site-specific work should use original elevation data and professional surveying when required.
Map File Information
The ZIP contains the high-resolution JPG versions of the Benton County overview, city-index, terrain-and-water, and elevation maps.
- Included Files: county map, city map, water map, elevation map
- Printable Size: 3638 × 2572 px each
- File Type: JPG
Related Maps
Sources and References
County administrative context was checked against the official Benton County Government site. Boundary, hydrography, and elevation explanations also use the supplied map package and the U.S. government geographic-data programs below. These links are useful starting points when a project requires authoritative source data beyond the simplified maps on this page.
- Benton County Government – official county government and local administrative information
- U.S. Census Bureau TIGER/Line Shapefiles – county-boundary and geographic reference data
- USGS National Hydrography – national river, stream, lake, and hydrography reference
- USGS 3D Elevation Program – elevation-data reference
Green Map images are edited visual materials based on open geographic data. They are appropriate for education, documents, presentations, printing, and general geographic reference, but they do not replace official legal boundaries, flood maps, current navigation products, engineering datasets, or professional surveys.
Green Map creates custom-edited map images using open geographic data sources such as geoBoundaries, Natural Earth, OpenStreetMap, and government open data.
These maps are edited visual materials, not raw data files, and are provided for education, documents, presentations, and graphic reference.