The Howard County Indiana Land Cover Map set shows a county that is mostly agricultural but visually centered on Kokomo. Agriculture accounts for 74.17% of the 2025 classification, while Kokomo forms the largest developed concentration and wooded or wetland cover follows parts of the Wildcat Creek system through the surrounding farm landscape.
Four views are provided here: current land cover, forest and farmland, impervious surface with developed land, and mapped class differences from 1985 to 2025. After reviewing the WebP versions on the page, you can download all four original JPG maps together in one ZIP for printing, classroom work, presentations, reports, or county-level comparison.
Table of Contents
A 74.17% agricultural county can still have a strong urban center
The 2025 county summary is dominated by agriculture at 74.17%. Developed cover is the next largest category at 18.90%, followed by forest at 4.87%, wetlands at 1.39%, and water at 0.47%. Grassland and shrubland are minor classes in the forest-and-farmland view, at 0.04% and 0.01% respectively. Those percentages describe the whole county, but they do not mean the classes are spread evenly from one edge to the other.
Kokomo occupies the most obvious break in the farm pattern. The central portion of the county contains a broad red developed area, with additional developed lines and patches extending outward along streets and built corridors. Farther east, a separate smaller developed concentration is visible, while scattered built patches appear in the southwest and west. The surrounding county remains largely yellow agricultural cover, so the contrast between the central city and the rural edges is easy to see even without municipal boundary lines.
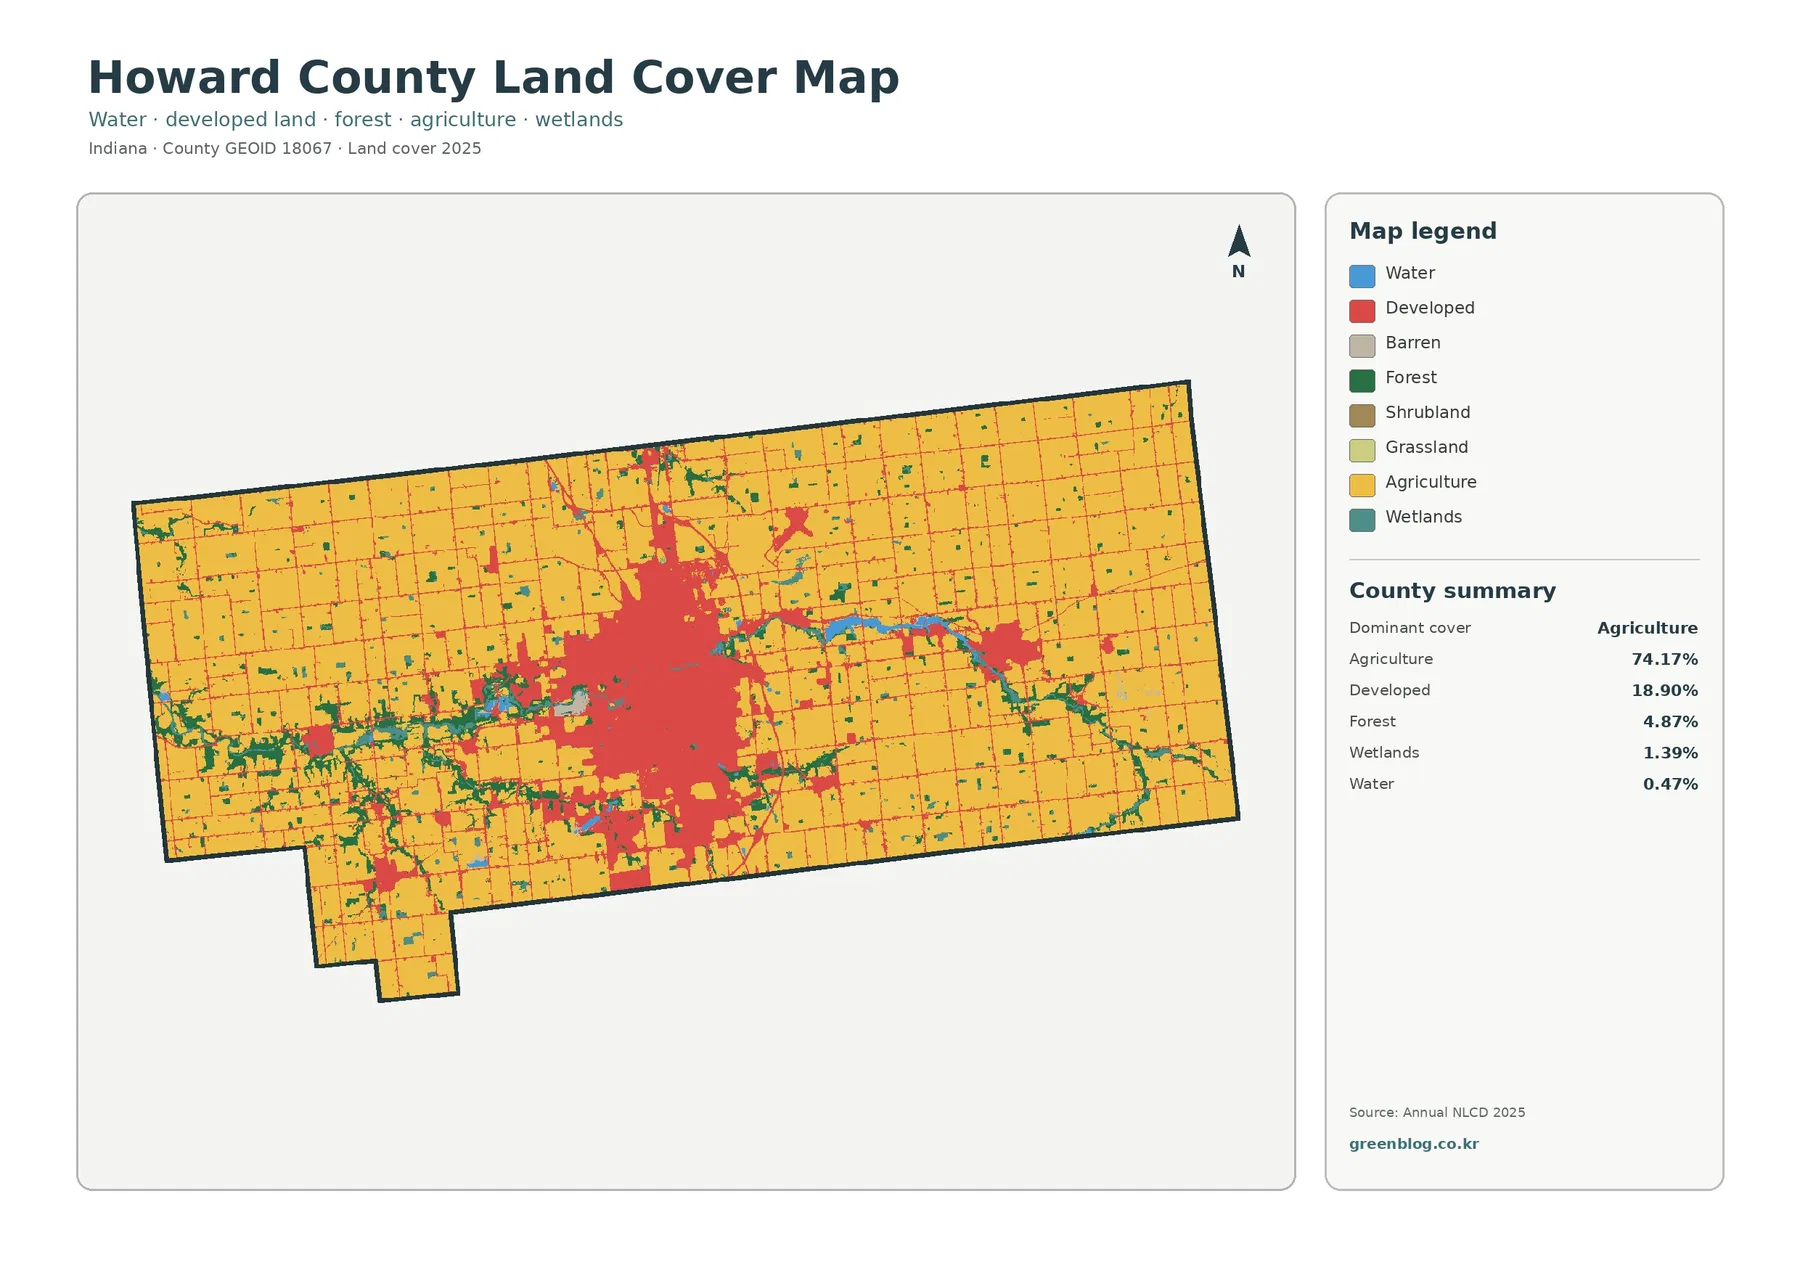
Outside Kokomo, the agricultural cover forms large blocks across the north, east, west, and south. Thin developed lines cross many of those blocks where roads and rural development are mapped, but they do not replace the countywide farm pattern. Small forest patches interrupt the agricultural color, especially near drainage features and creeks. This combination makes Howard County useful for comparing a concentrated urban footprint with a much larger agricultural setting.
Land cover should not be confused with zoning or legal land use. Annual NLCD classifies what covers the ground at the raster-cell scale. A developed class can include lawns, trees, and other surfaces around buildings, while an agricultural class does not define a farm parcel or ownership boundary. The Howard County Plan Commission maintains separate zoning, subdivision, site-plan, and permit processes for actual land-use decisions.
Impervious cover isolates the hard-surface footprint of Kokomo
Impervious surface means pavement, rooftops, parking areas, and similar surfaces that allow little water to soak into the ground. Howard County has a 2025 mean impervious value of 6.81%, and 4.81% of the county falls in the map’s 50% or greater impervious range. The developed land-cover class is much larger at 18.90%, which is expected because developed areas can contain grass, trees, yards, and other permeable surfaces.
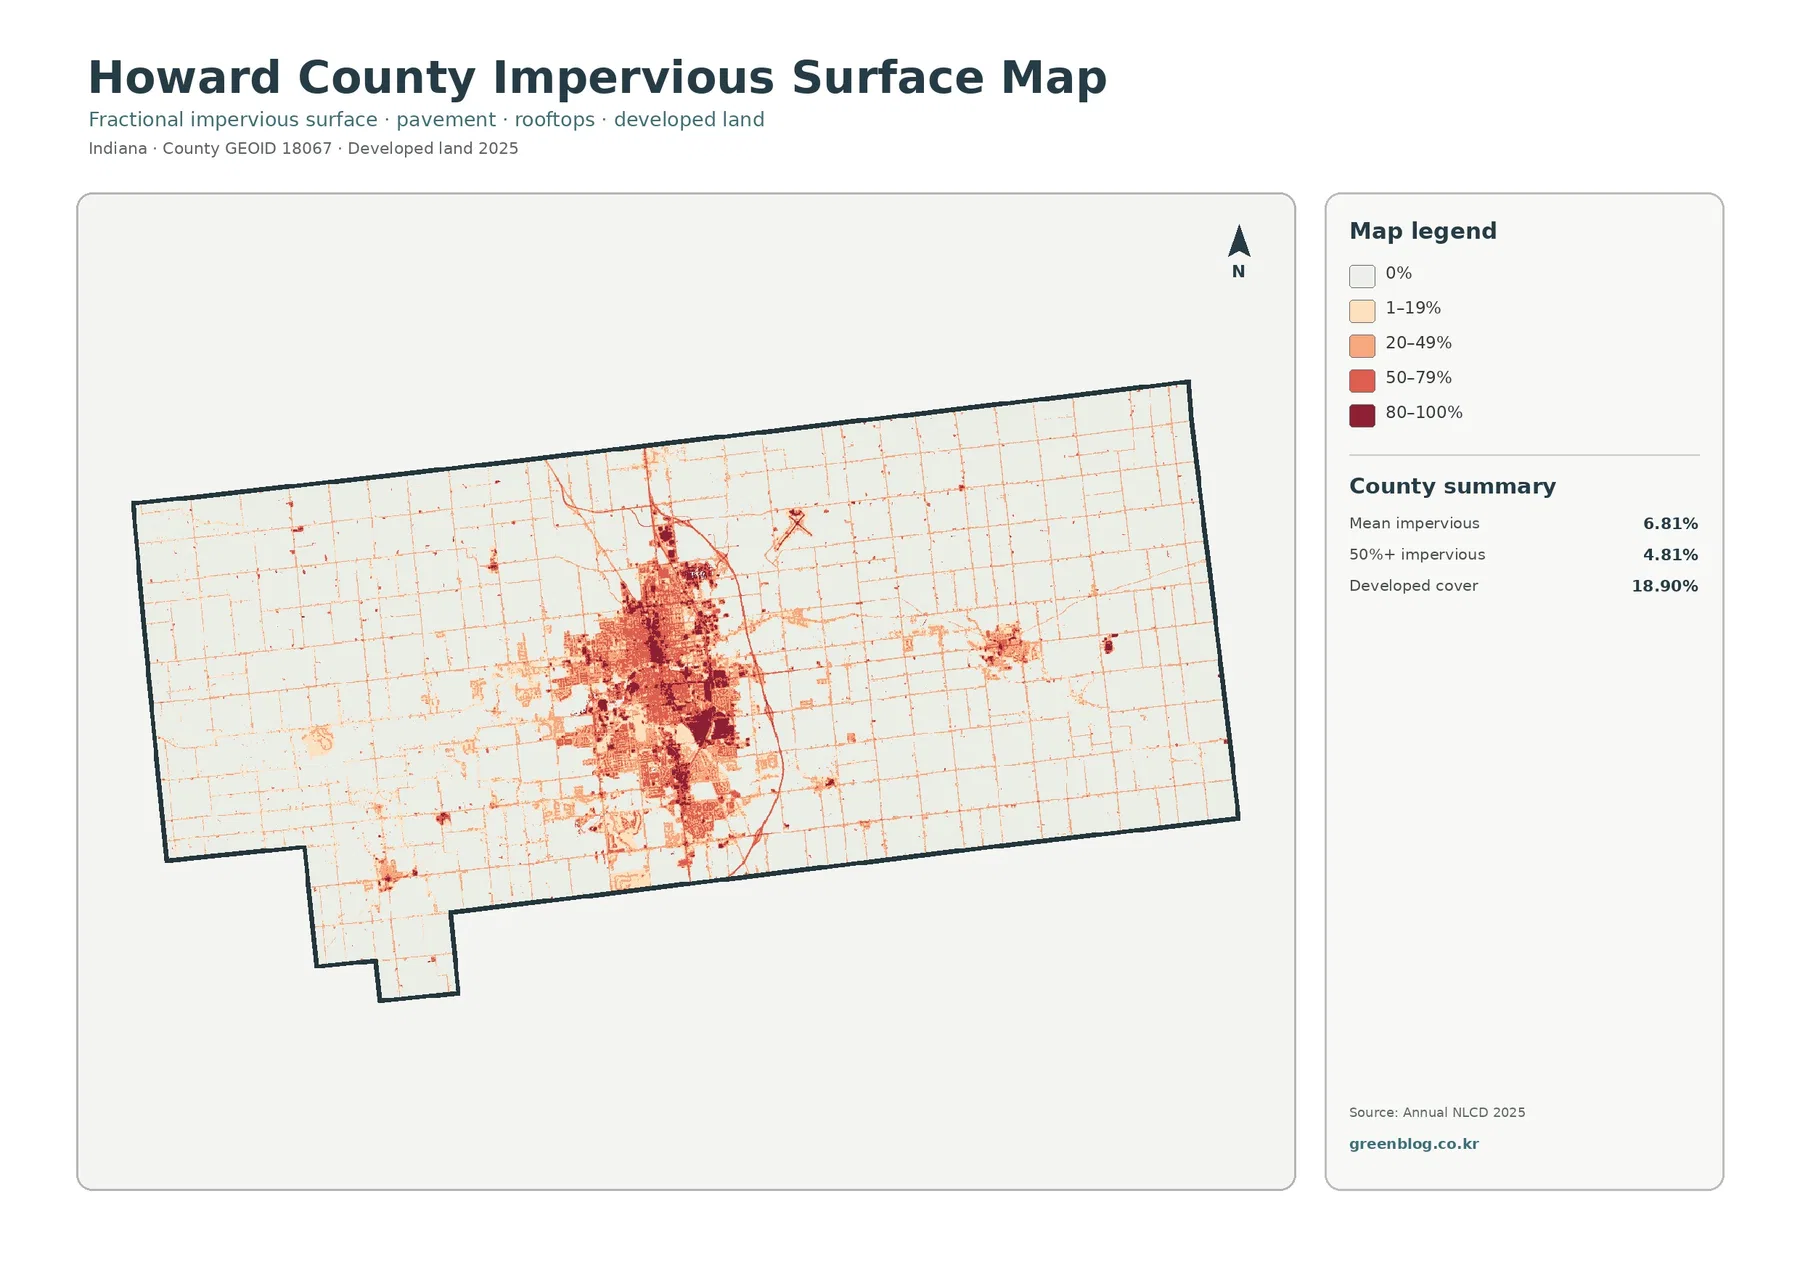
Kokomo becomes even more distinct in this layer than in the general land-cover map. Darker values cluster in the central city, while the built edge breaks into lighter blocks and road-shaped lines. A smaller concentration appears to the east, and several isolated high-value patches occur elsewhere. Large agricultural areas remain pale, so the map separates the county’s main hard-surface footprint from rural land more directly than the broad developed class can.
The pattern is useful for stormwater context, but it is not a flood-risk map. Runoff and flooding also depend on terrain, soils, drainage systems, stream levels, and rainfall. Indiana DNR maintains Wildcat Creek hydrologic publications for Kokomo and Howard County, and those sources are more appropriate when the question involves water levels or flood analysis. The impervious layer is best used to locate where hard surfaces are concentrated before adding those other datasets.
For presentations, pairing the land-cover and impervious maps prevents a common misunderstanding. The 18.90% developed figure describes a land-cover category, while 6.81% is the countywide mean fraction of hard surface. Seeing Kokomo in both maps makes it clear why the numbers differ: a developed neighborhood can contain roofs and pavement as well as lawns and trees.
Wildcat Creek adds wooded and wetland detail to the farm landscape
Forest covers only 4.87% of Howard County, yet the green class is noticeable because it often appears in elongated or irregular patches rather than one large block. Several of those patches follow the creek network through and around Kokomo and continue into rural areas. Wetlands, at 1.39%, often appear near the same general drainage settings, while water occupies 0.47% of the county.
Indiana DNR’s Wildcat Creek materials list streams used in Kokomo and Howard County flood studies, including Kokomo Creek, Little Wildcat Creek, Middle Fork Wildcat Creek, South Fork Wildcat Creek, and the east and west forks of Little Wildcat Creek. IDEM also places Howard County in the Upper Wildcat Creek watershed and identifies Wildcat Creek, Mud Creek, Kokomo Creek, and Turkey Creek among its major streams. Those official sources provide useful context for the narrow green and teal cover that appears through an otherwise agricultural county.
The mapped relationship is spatial rather than causal. Green or teal cover near a creek does not by itself prove why vegetation or wetlands occur there, and the image does not show the exact regulatory boundary of a stream or wetland. It simply lets a reader compare where forest and wetland classes occur relative to agriculture and developed land. More detailed wetland, floodplain, or habitat work requires the relevant DNR, IDEM, or local datasets.
Removing most urban colors makes the rural pattern easier to compare
The forest-and-farmland map simplifies the county by emphasizing agriculture, forest, water, wetlands, grassland, and shrubland while treating developed and other classes as a light background. The result makes the 74.17% agricultural share immediately obvious. Forest at 4.87% becomes easier to trace through creek corridors and scattered woodlots, and the smaller wetland and water classes stand out more clearly than they do in the full legend.
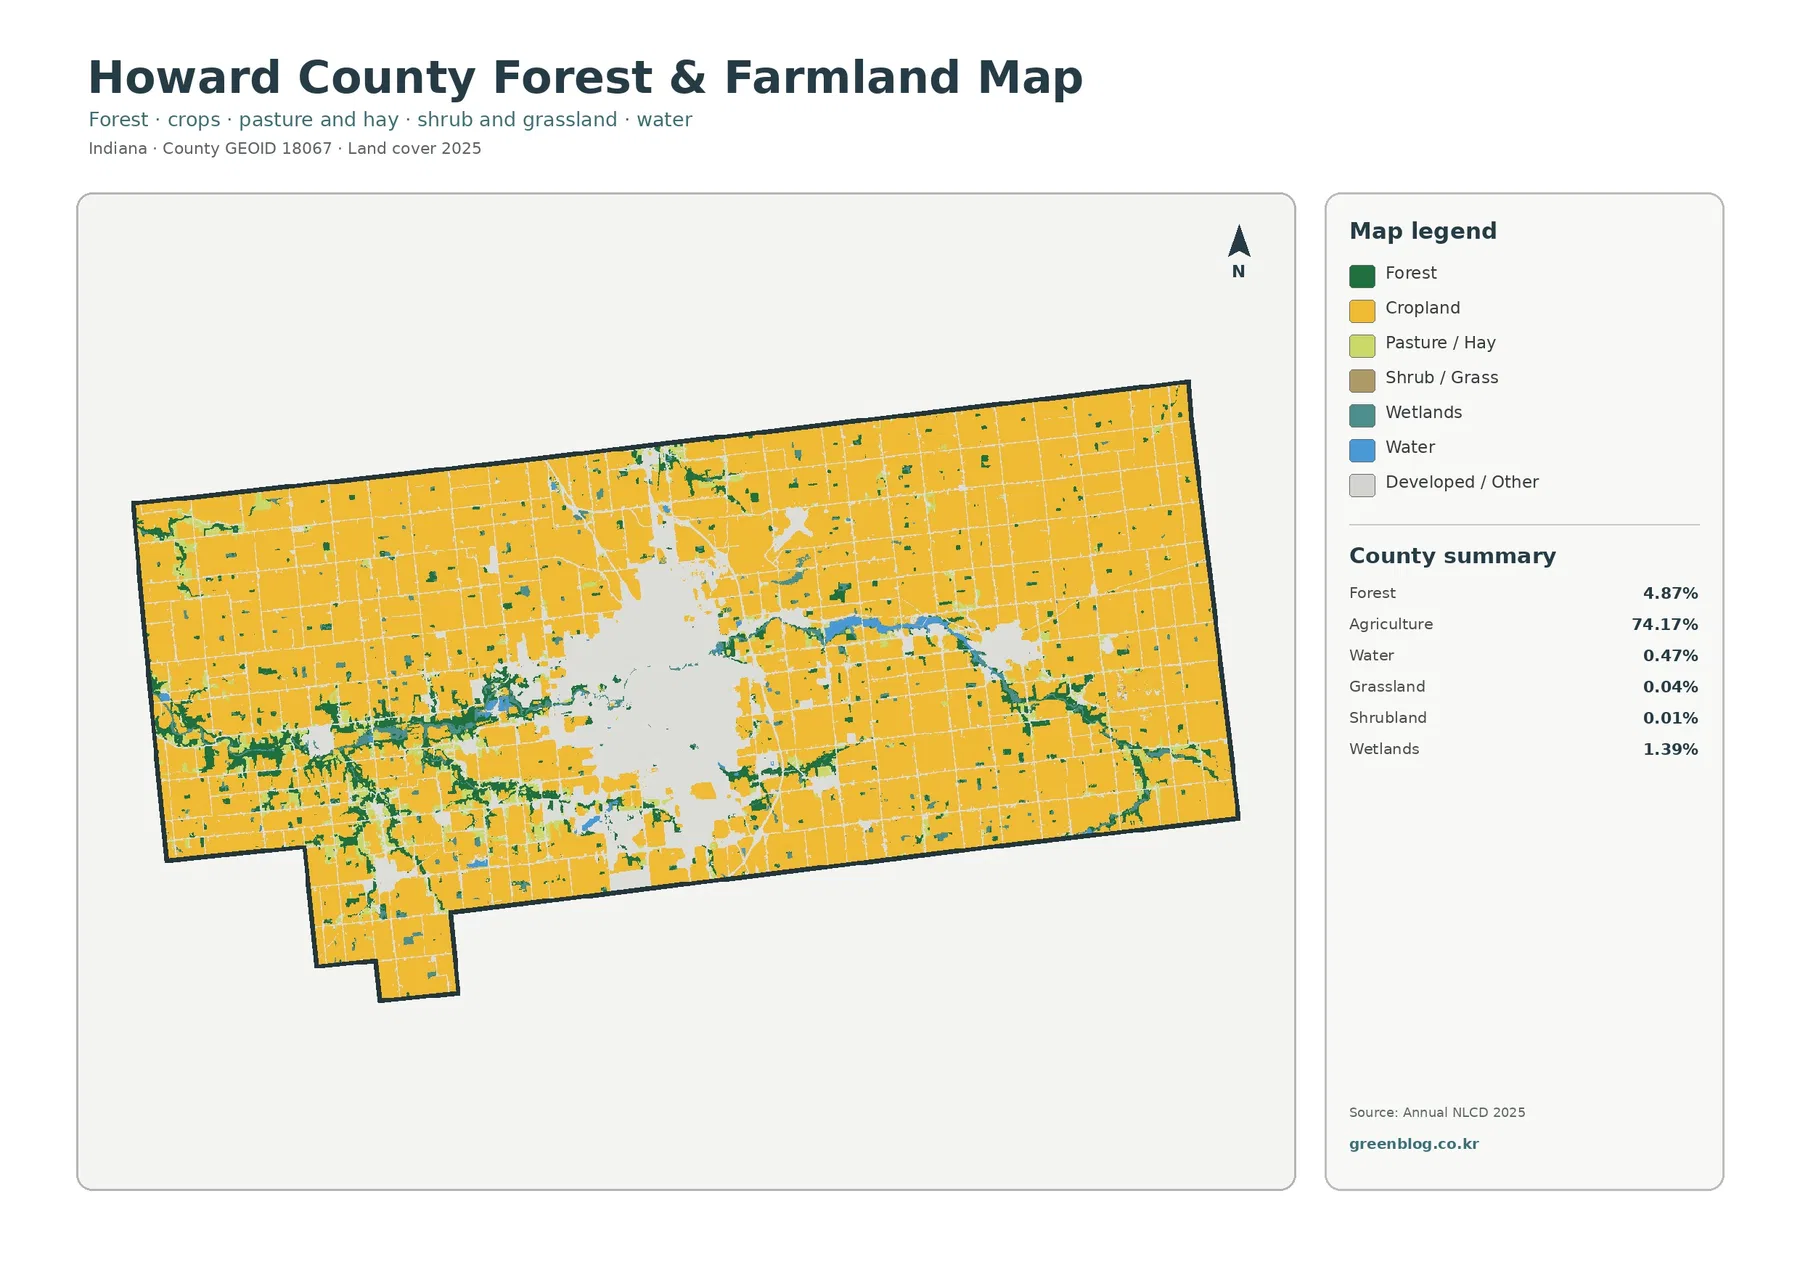
The large light area in the center marks where Kokomo’s developed and other cover has been de-emphasized. Around it, agriculture reaches close to the urban edge, especially toward the north, east, and south. Wooded patches are more visible west and southwest of the central area and along creek-like lines crossing farm country. The eastern half remains strongly agricultural, with smaller green and teal interruptions rather than a continuous forest block.
This version is helpful for agricultural or habitat discussions because it reduces visual competition from the developed class. Purdue Extension Howard County provides local Agriculture & Natural Resources resources that can complement the map when more context is needed. The image itself does not identify crop type, production, ownership, or conservation status, so those questions require separate agricultural or property data.
Small classes deserve careful reading. Grassland at 0.04% and shrubland at 0.01% occupy so little of the county that individual pixels can be hard to interpret at page scale. Water and wetlands also account for small countywide percentages, yet their location can matter in watershed or habitat studies. For that reason, a class with a small percentage should not automatically be dismissed as unimportant.
The 8.75% class difference is broader than development alone
The change layer compares mapped land-cover classes in 1985 and 2025. Howard County’s total class difference is 8.75%. The summary identifies 3.84% as changed to developed, 0.17% as forest loss, 0.66% as agricultural loss, and 3.95% as other class difference. Wetland difference is also shown as its own legend category. Those components matter because the total cannot be described as an 8.75% development rate.
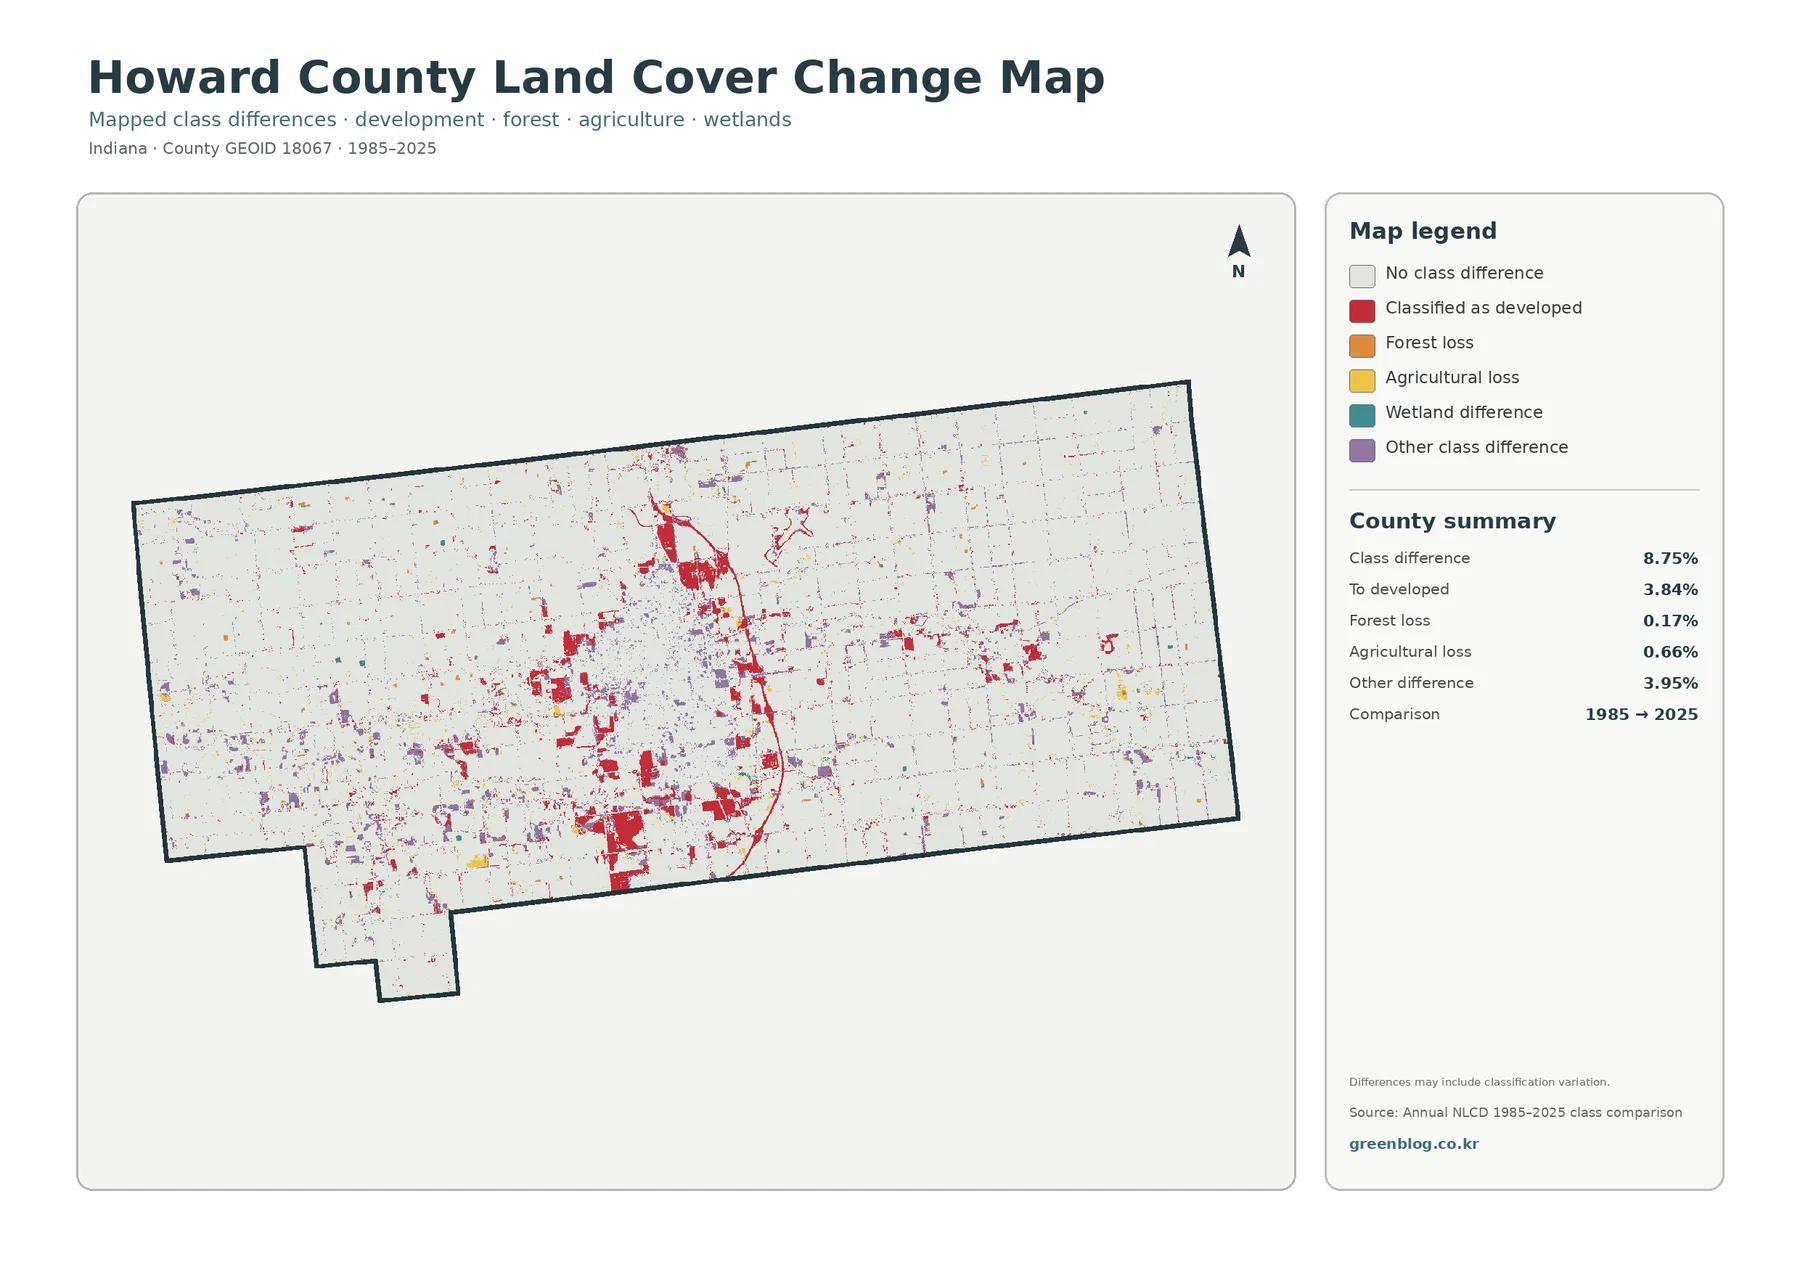
Changed-to-developed areas are concentrated most strongly around Kokomo. Red patches appear around the northern and southern edges of the central built area, with additional pieces to the west, southwest, and near the smaller eastern developed center. Other-class differences are more scattered across farm country, while the mapped forest-loss and agricultural-loss categories occupy much smaller shares of the county.
This is an endpoint comparison, not a year-by-year development history. A place shown as developed in 2025 will not necessarily be red on the change map if it was already in a similar class in 1985. Conversely, a colored difference can reflect changes in the mapped class without telling the reader the precise year or cause. Aerial imagery, local planning records, and parcel history are needed to establish when a specific site changed.
Raster classification adds another limitation. Annual NLCD assigns a representative class to grid cells, so narrow roads, field edges, tree rows, small wetlands, and mixed urban surfaces can be generalized. Some differences between two dates can reflect genuine land conversion, while others may involve how mixed cells were classified. The map is most useful for locating broad areas of change that deserve closer review.
Use each map for a different question, then compare them at the same county extent
A practical reading sequence begins with the general 2025 land-cover map because it establishes the countywide pattern. Locate Kokomo first, then follow the agricultural blocks outward and note where forest, wetlands, and water interrupt them. Once those reference points are familiar, the impervious map can isolate hard surfaces and the forest-and-farmland version can remove urban color to make rural cover easier to compare.
For watershed study, the Wildcat Creek-related forest and wetland pattern may be the most useful starting point. For urban-growth discussion, the general land-cover and impervious layers work better together. The 1985–2025 comparison belongs last because it answers a different question: where the mapped class differs between two dates rather than what the current surface looks like.
The original JPG files are especially convenient when the maps need to be placed side by side in a report or slide deck. Each image is 2480 × 1754 pixels, and all four use the same county outline, making it easier to compare the position of Kokomo, the rural farm matrix, and creek-associated natural cover. Keeping the legends visible is important because similar-looking colors can represent different measures from one map to another.
County-scale reference is also the correct level of precision. The maps are not parcel surveys, zoning maps, property-boundary maps, or legal wetland delineations. Construction or vegetation change after the 2025 observation period is not represented. When a decision depends on current conditions, the land-cover set should be supplemented with recent aerial imagery, Howard County planning information, and the appropriate environmental or cadastral records.
Together, the four layers separate cover, hard surface, and two-date change
Howard County is a good example of why a single map can be misleading when used alone. The general layer says that agriculture dominates and development is second. The impervious layer shows that the hard-surface fraction is much smaller than the developed class. The forest-and-farmland layer highlights natural cover that can be visually overshadowed by Kokomo, and the change layer separates current development from places whose class differs between 1985 and 2025.
Those distinctions are useful in education because they prevent different concepts from being collapsed into one number. A student can compare 18.90% developed cover with a 6.81% mean impervious value, then see why the two measures are not interchangeable. The same exercise works with the 8.75% class difference: only 3.84% is summarized as changed to developed, while the rest belongs to other change categories.
The local context keeps the exercise grounded in a real county rather than an abstract legend. Kokomo provides a clear central built reference, the surrounding agricultural grid shows the county’s dominant cover, and Wildcat Creek-related corridors add a natural pattern that crosses both rural and urban settings. Reading all four views together gives a more complete county picture without claiming parcel-level precision.
Frequently Asked Questions
Why is Kokomo so prominent if agriculture covers 74.17% of Howard County?
The percentage is calculated across the whole county, where agricultural land extends far beyond the central city. Developed cover is concentrated much more strongly around Kokomo, so it forms one large visual area even though agriculture remains the dominant countywide class. The 18.90% developed share is also large enough to make that central contrast obvious.
What should I use to study Wildcat Creek and nearby natural cover?
Start with the forest-and-farmland map to locate wooded and wetland cover near the creek network, then compare it with the general land-cover map to see nearby agriculture and development. For stream boundaries, hydrology, water quality, or flood questions, use the official Indiana DNR and IDEM resources listed below because the land-cover maps do not replace those datasets.
Does the 8.75% class difference mean 8.75% of Howard County became urban?
No. The total combines several categories. The summary reports 3.84% changed to developed, 0.17% forest loss, 0.66% agricultural loss, 3.95% other class difference, and a separate wetland-difference category in the legend. It is a two-date classification comparison rather than a single urban-growth percentage.
Map File Information
The ZIP contains four original JPG maps for Howard County: 2025 land cover, forest and farmland, impervious surface/developed land, and the 1985–2025 land-cover class comparison.
- Printable Size: 2480 × 1754 px each
- File Type: ZIP containing 4 JPG files
- Intended Use: printing, reports, classroom work, presentations, and county land-cover reference
Related Maps
- Adams County Indiana Land Cover Map
- Allen County Indiana Land Cover Map
- Bartholomew County Indiana Land Cover Map
Sources and references
- MRLC Annual NLCD Data – official source for Annual NLCD data
- USGS Annual NLCD Land Cover Classification – class definitions and dataset guidance
- U.S. Census Bureau TIGER/Line Shapefiles – official county boundary source
- Howard County Plan Commission – local zoning, subdivision, site-plan, and development information
- Indiana DNR – Wildcat Creek – official Wildcat Creek and Kokomo/Howard County stream information
- IDEM – Upper Wildcat Creek Watershed – official watershed context including Howard County and major tributaries
Green Map creates custom-edited map images using open geographic data sources such as geoBoundaries, Natural Earth, OpenStreetMap, and government open data. These maps are edited visual materials, not raw data files, and are provided for education, documents, presentations, and graphic reference.