North Dakota is sparsely populated at the statewide scale, but its residents are not spread evenly across the map. Fargo and West Fargo form the strongest concentration on the eastern border. Bismarck and Mandan create another major cluster near the center of the state, while Grand Forks, Minot, Williston, Dickinson, and several smaller cities act as separate regional anchors. The supplied 2024 ACS 5-year estimates put the state population at 784,841. The county-density map reports about 68,994 square miles of land and an average density of roughly 11 people per square mile.
That statewide average is useful only if it is kept separate from the other measures in the map set. A large proportional circle on the city or county-population map means a large total population, not a high density. County density divides population by land area. The detailed map goes one step further by showing density at the census-tract level, where a small city can stand out inside an otherwise sparse county. The 2010–2020 change map uses two decennial censuses, so its growth rates belong to that decade rather than to the 2024 ACS estimate.
Table of Contents
Fargo and Bismarck stand out most clearly on the census-tract density map
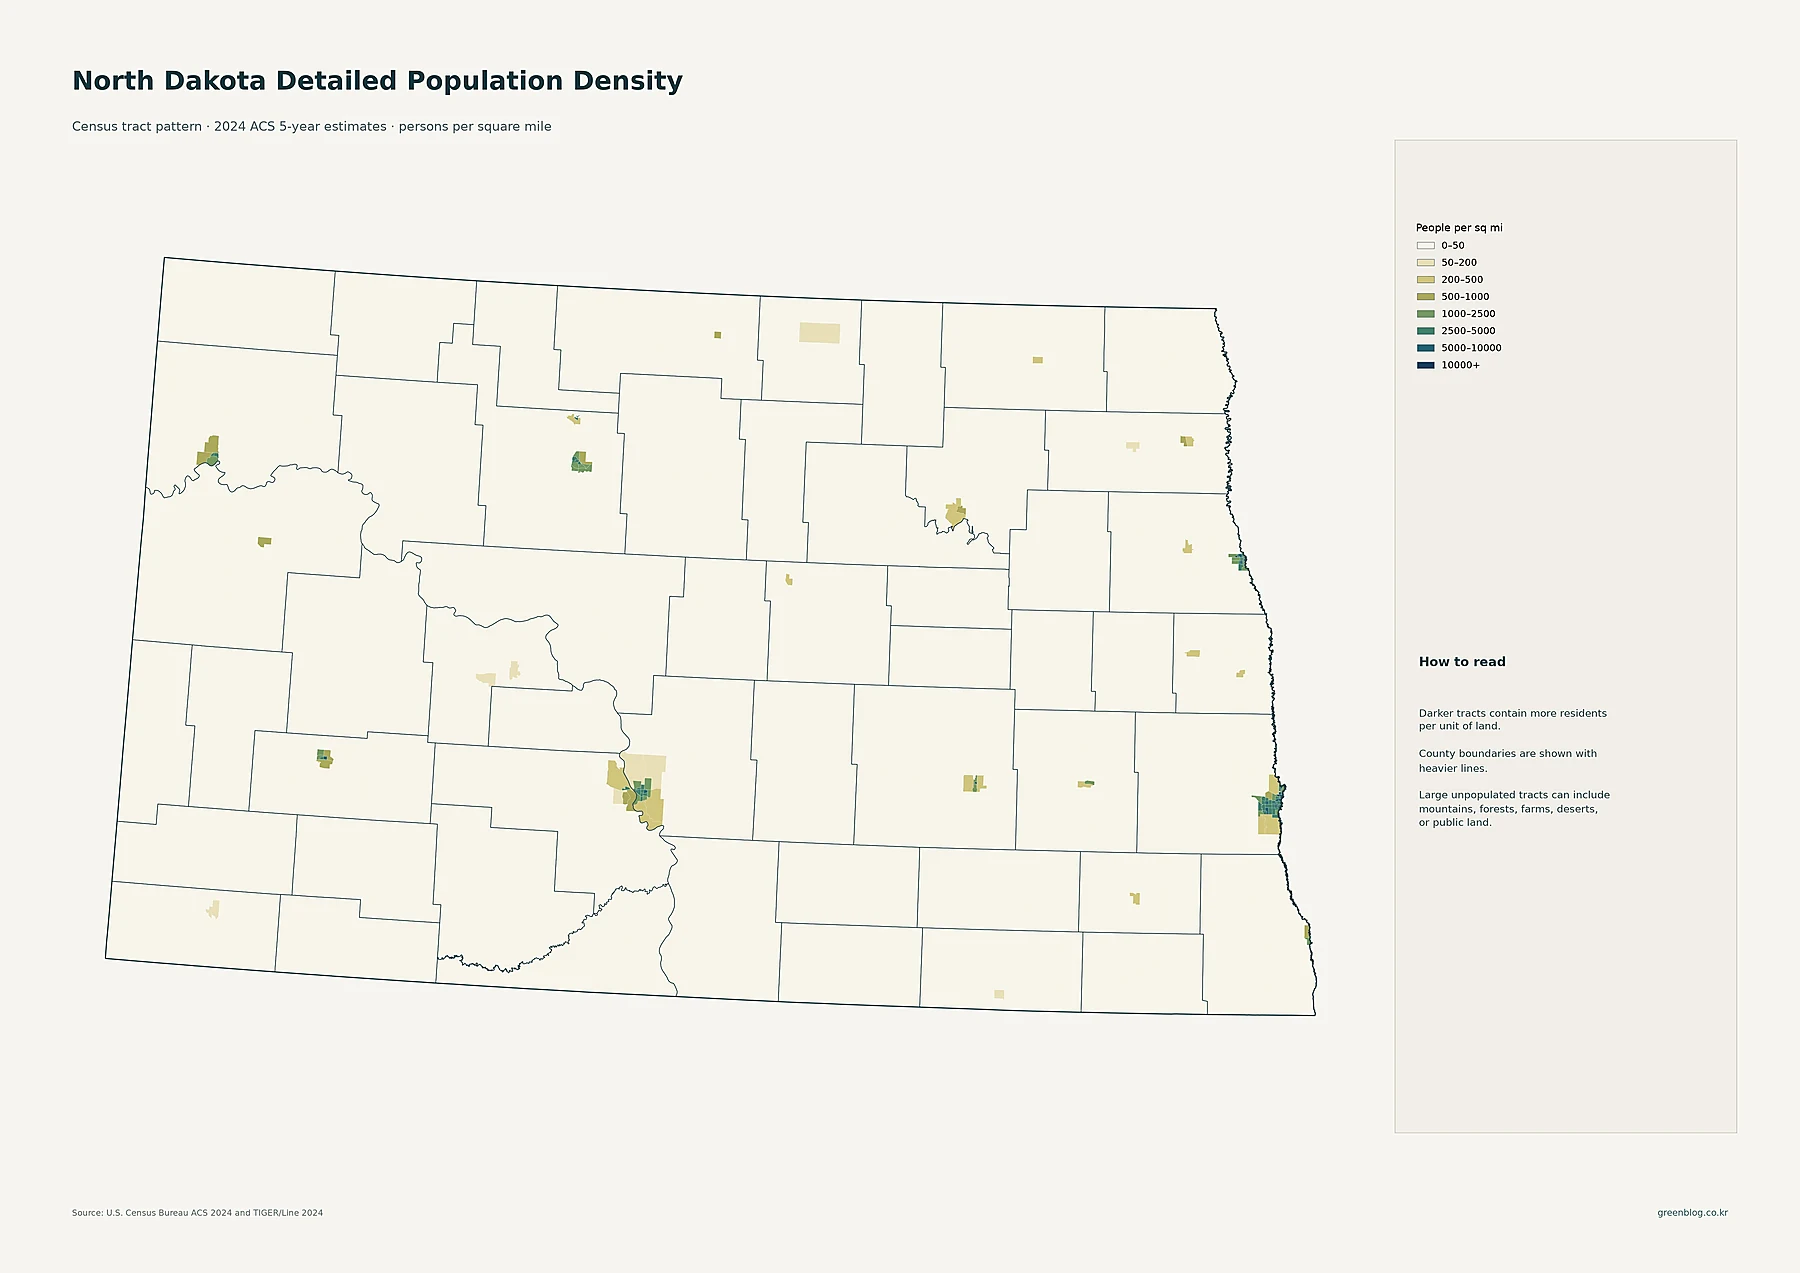
The broadest cluster of dark tracts is around Fargo in Cass County. Fargo and West Fargo form a compact urban area along the Minnesota border, with several tracts in the higher density classes. Grand Forks creates another distinct concentration farther north on the eastern edge of the state. Wahpeton appears as a smaller cluster in the southeast. These places stand out sharply because much of eastern North Dakota outside the cities remains in the lightest tract-density classes.
Near the center of the state, Bismarck and Mandan form another clear concentration on opposite sides of the Missouri River. Minot stands out in the north-central region. In western North Dakota, Williston, Dickinson, and Watford City are visible as compact pockets of higher density. Jamestown and Valley City create smaller central and eastern clusters, and Devils Lake appears as a localized northern center. The map therefore shows a network of separated settlements rather than one continuous high-density corridor.
Most census tracts are shaded in the 0–50 people-per-square-mile class. This does not mean every rural county is uniformly empty. A county can contain a small city or town with much higher tract density while the surrounding land remains very lightly populated. That is why the tract map is particularly useful in North Dakota: it separates the actual built-up settlement from the broad county average.
Fargo is the largest census place, followed by Bismarck, Grand Forks, and Minot
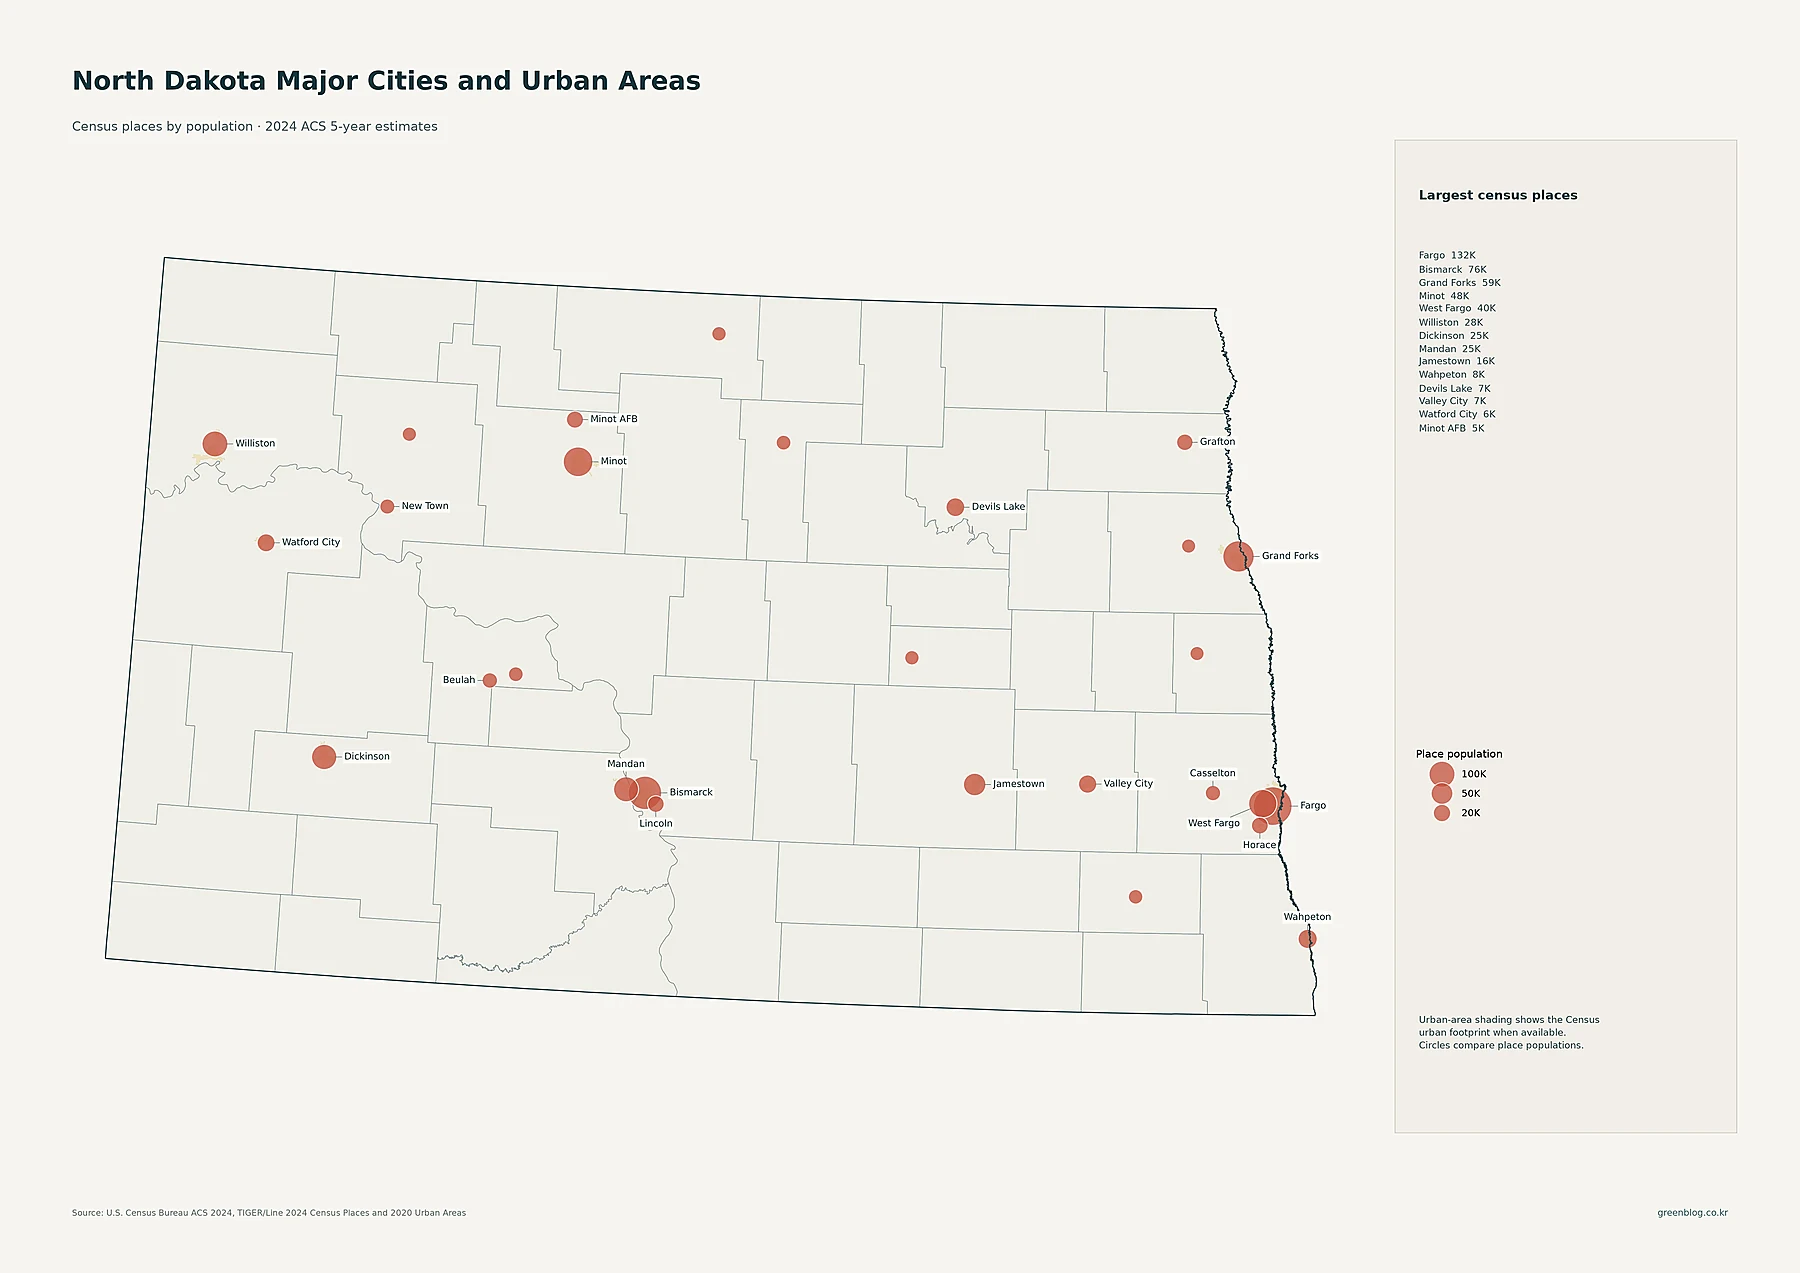
Fargo has 131,627 residents in the supplied census-place data, making it the largest place in the state. Bismarck is second at 75,556, followed by Grand Forks at 59,042 and Minot at 47,791. West Fargo has 40,094 residents, strengthening the eastern concentration around Fargo. Williston has 28,056, Dickinson 25,357, Mandan 24,522, and Jamestown 15,787. Wahpeton has 8,010, Devils Lake 7,308, Valley City 6,541, and Watford City 6,039.
The proportional circles make the spacing of North Dakota’s population centers easy to see. Fargo–West Fargo sits on the eastern edge, Bismarck–Mandan is near the center, Minot is north-central, and Williston and Dickinson anchor the west. The circles represent total place population. They should not be read as density symbols, because the land area inside each place boundary differs. The tract map is the better layer for comparing how tightly residents occupy space within and around those cities.
Cass County has the largest total population by a wide margin
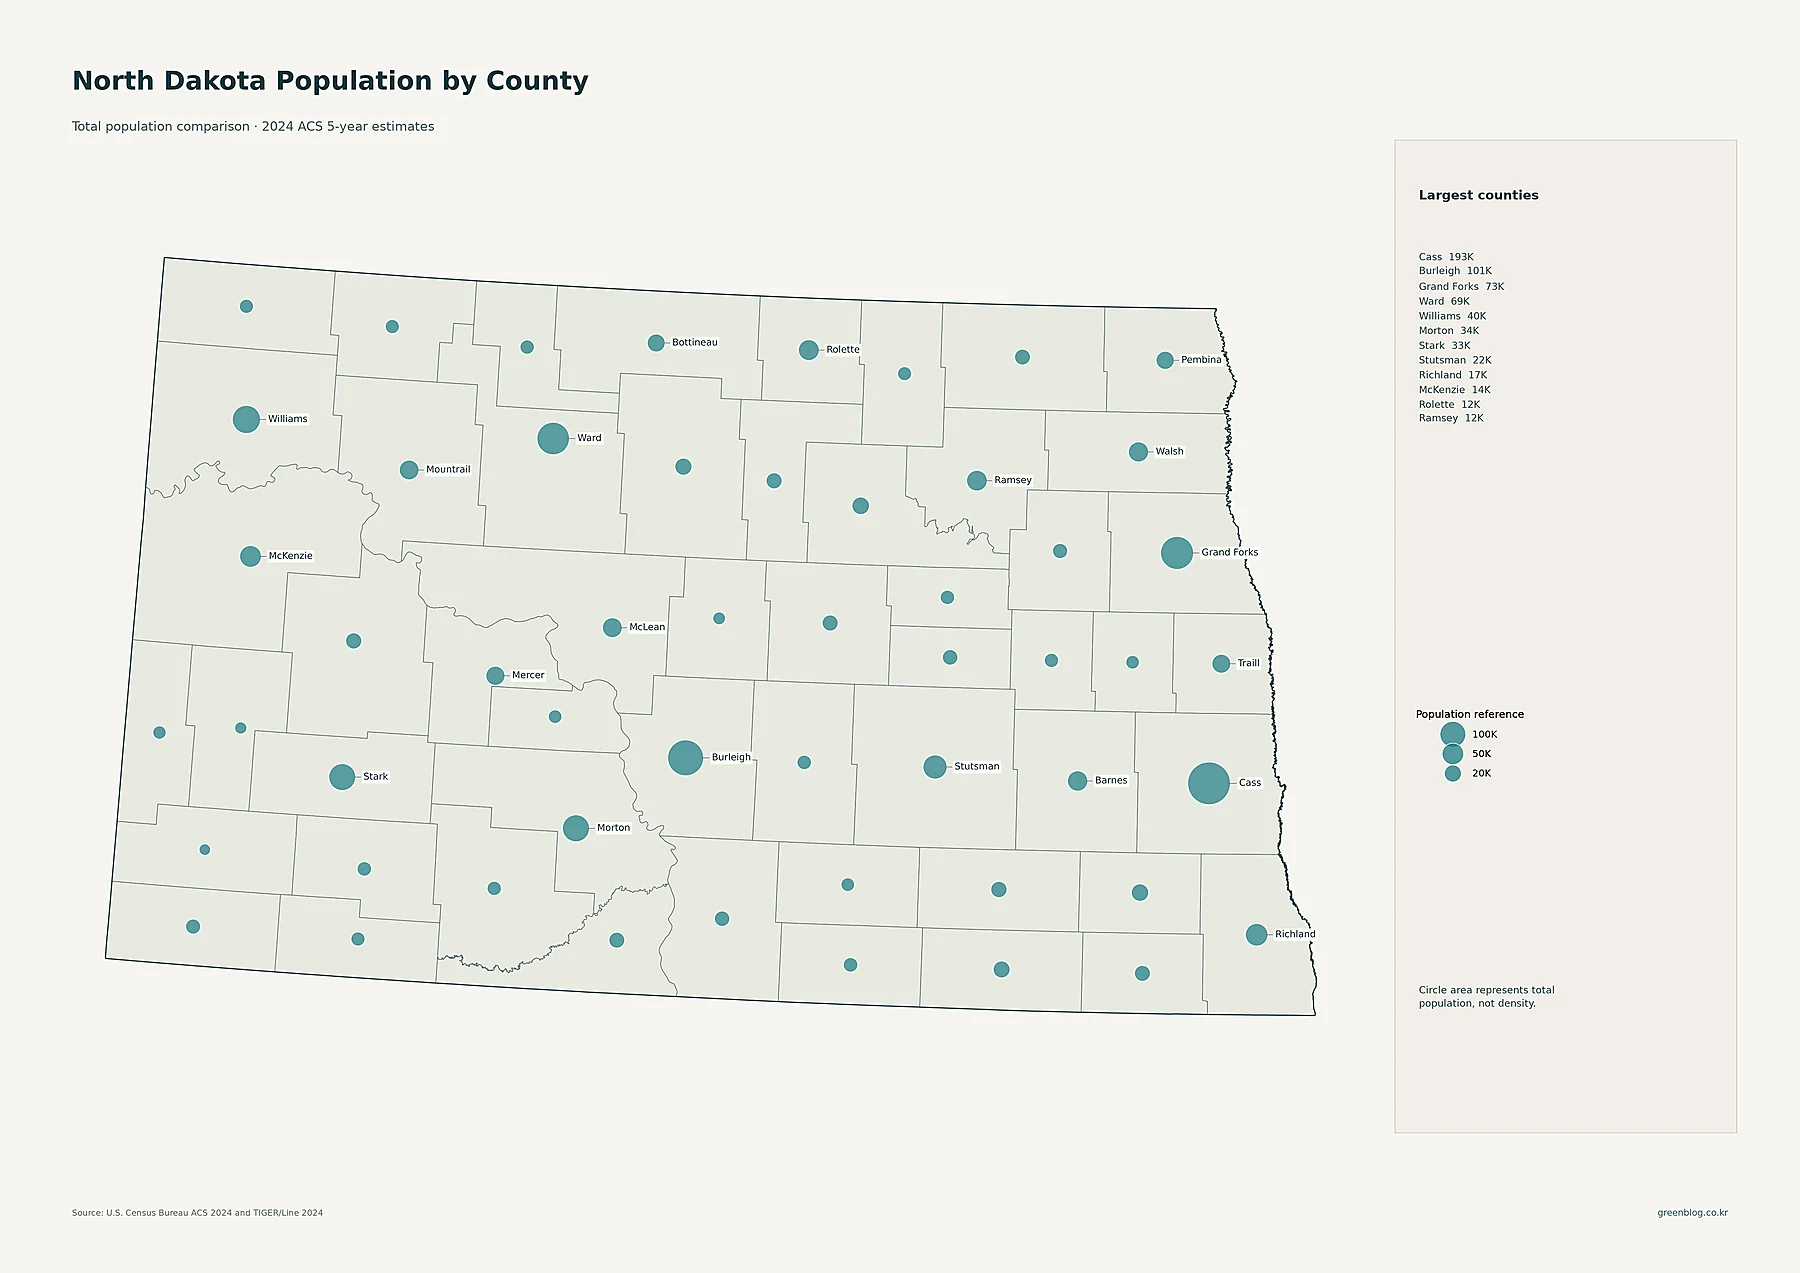
Cass County has 193,400 residents, the largest county total in the supplied 2024 ACS data. Burleigh County is second at 100,600. Grand Forks County has 72,923 residents and Ward County 68,973. The next tier includes Williams at 39,555, Morton at 33,777, and Stark at 33,302. Stutsman has 21,549 residents, Richland 16,584, McKenzie 14,321, Rolette 11,924, Ramsey 11,556, and Barnes 10,773.
The ranking closely reflects the locations of the largest cities. Cass contains Fargo and West Fargo, Burleigh contains Bismarck, Grand Forks County contains Grand Forks, and Ward contains Minot. Western counties such as Williams, Stark, and McKenzie also show relatively large circles compared with many rural counties. Still, county population totals answer only how many people live inside a county boundary. The density map changes the comparison by including land area.
Cass also leads county density, while most counties remain below 10 people per square mile
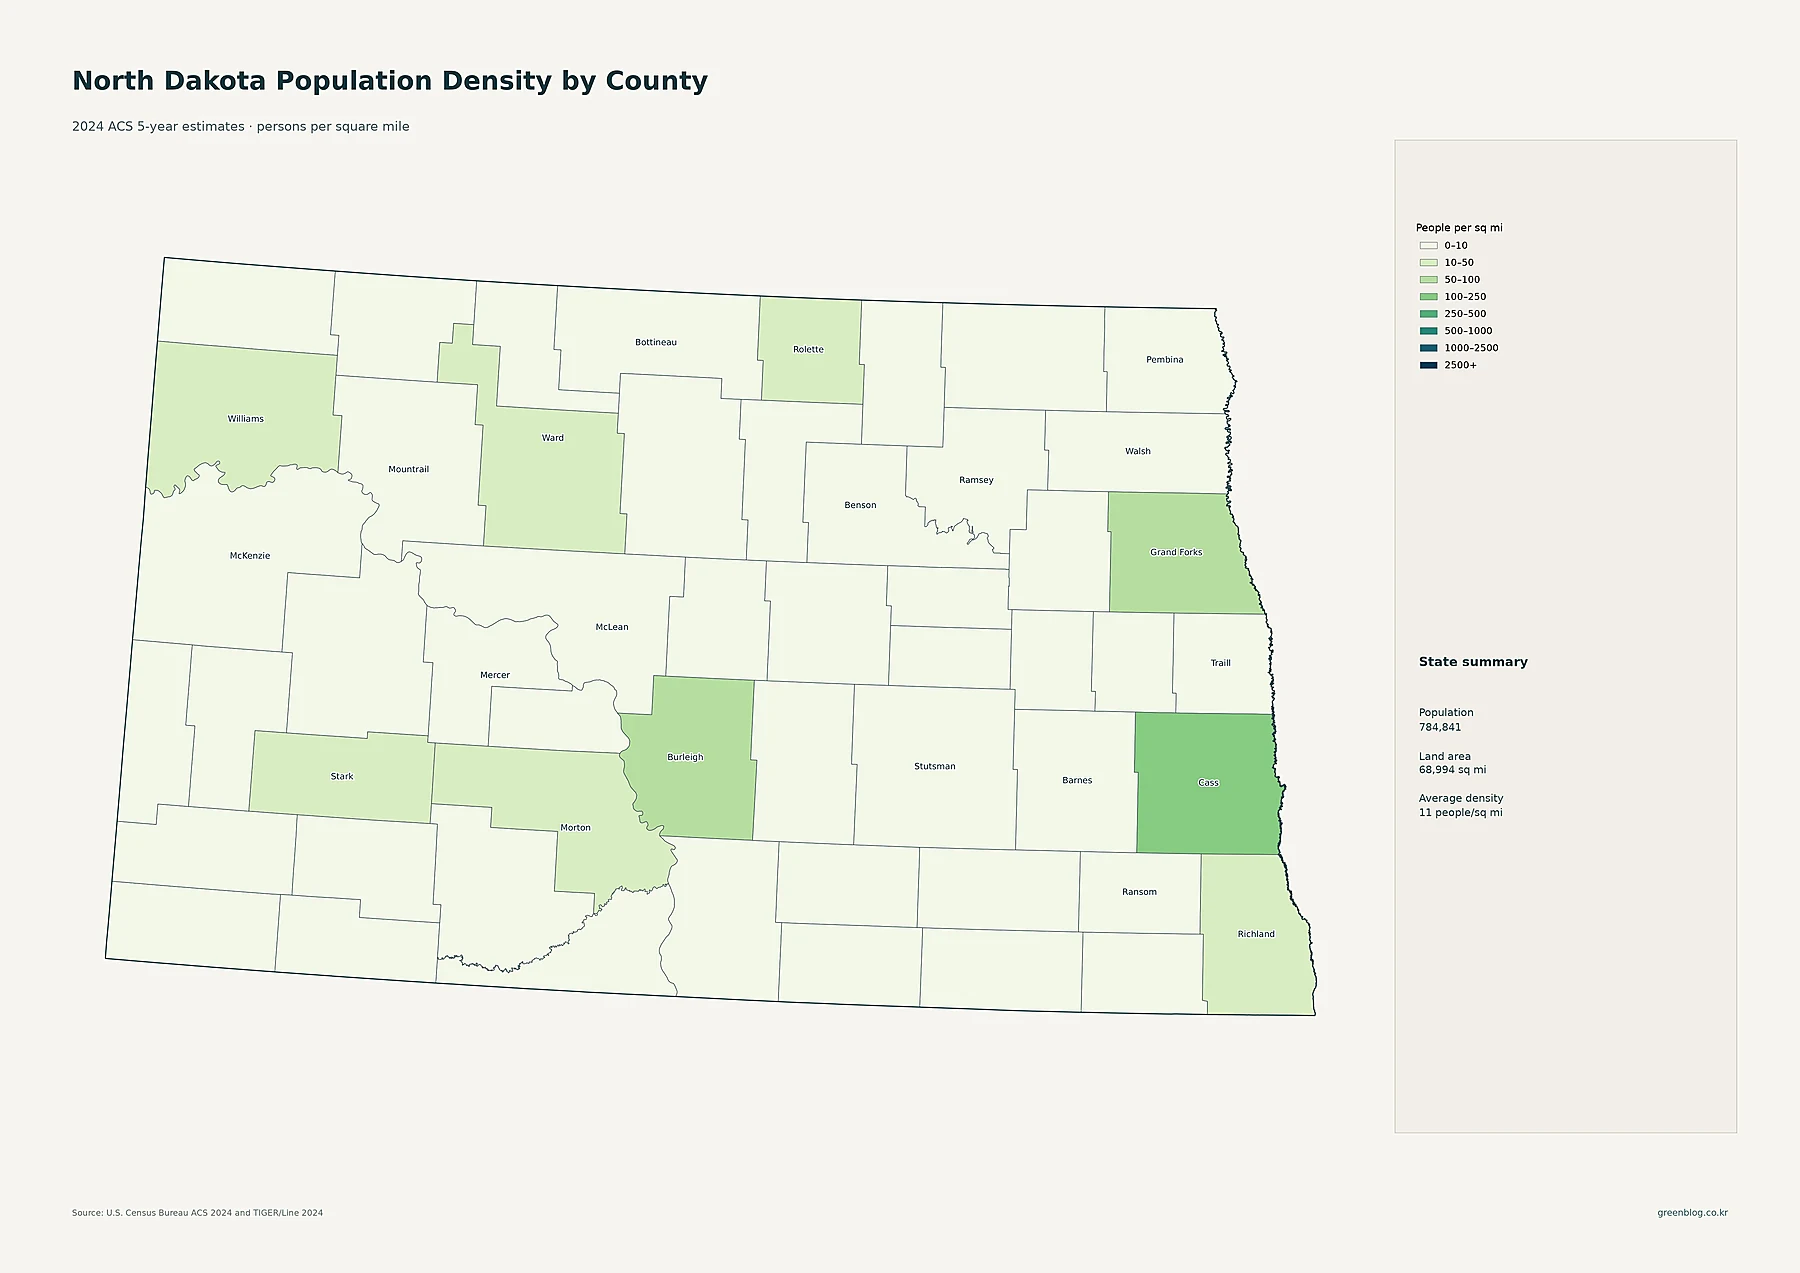
Cass County has the highest average density at about 109.6 people per square mile. Burleigh follows at about 61.6, Grand Forks at 50.8, Ward at 34.3, and Stark at 24.9. Williams averages about 19.0 people per square mile and Morton 17.5. Rolette is about 13.2 and Richland 11.6, placing them near or above the statewide average.
Many counties average fewer than 10 people per square mile, and several are below three. Sheridan County is about 1.34, Logan 1.83, Burke 1.95, Emmons 2.16, and Bowman 2.50. The contrast between Cass and these rural counties is substantial. North Dakota’s statewide average of about 11 people per square mile is therefore not a description of a uniform landscape. It combines a small number of relatively concentrated counties with a large number of sparsely settled ones.
| Measure | Leading area | Value in supplied data |
|---|---|---|
| State population | North Dakota | 784,841 |
| Largest county population | Cass County | 193,400 |
| Highest county density | Cass County | about 109.6/sq mi |
| Fastest 2010–2020 growth | McKenzie County | +131.2% |
| Largest 2010–2020 decline | Rolette County | -12.6% |
Western counties recorded the largest percentage gains from 2010 to 2020
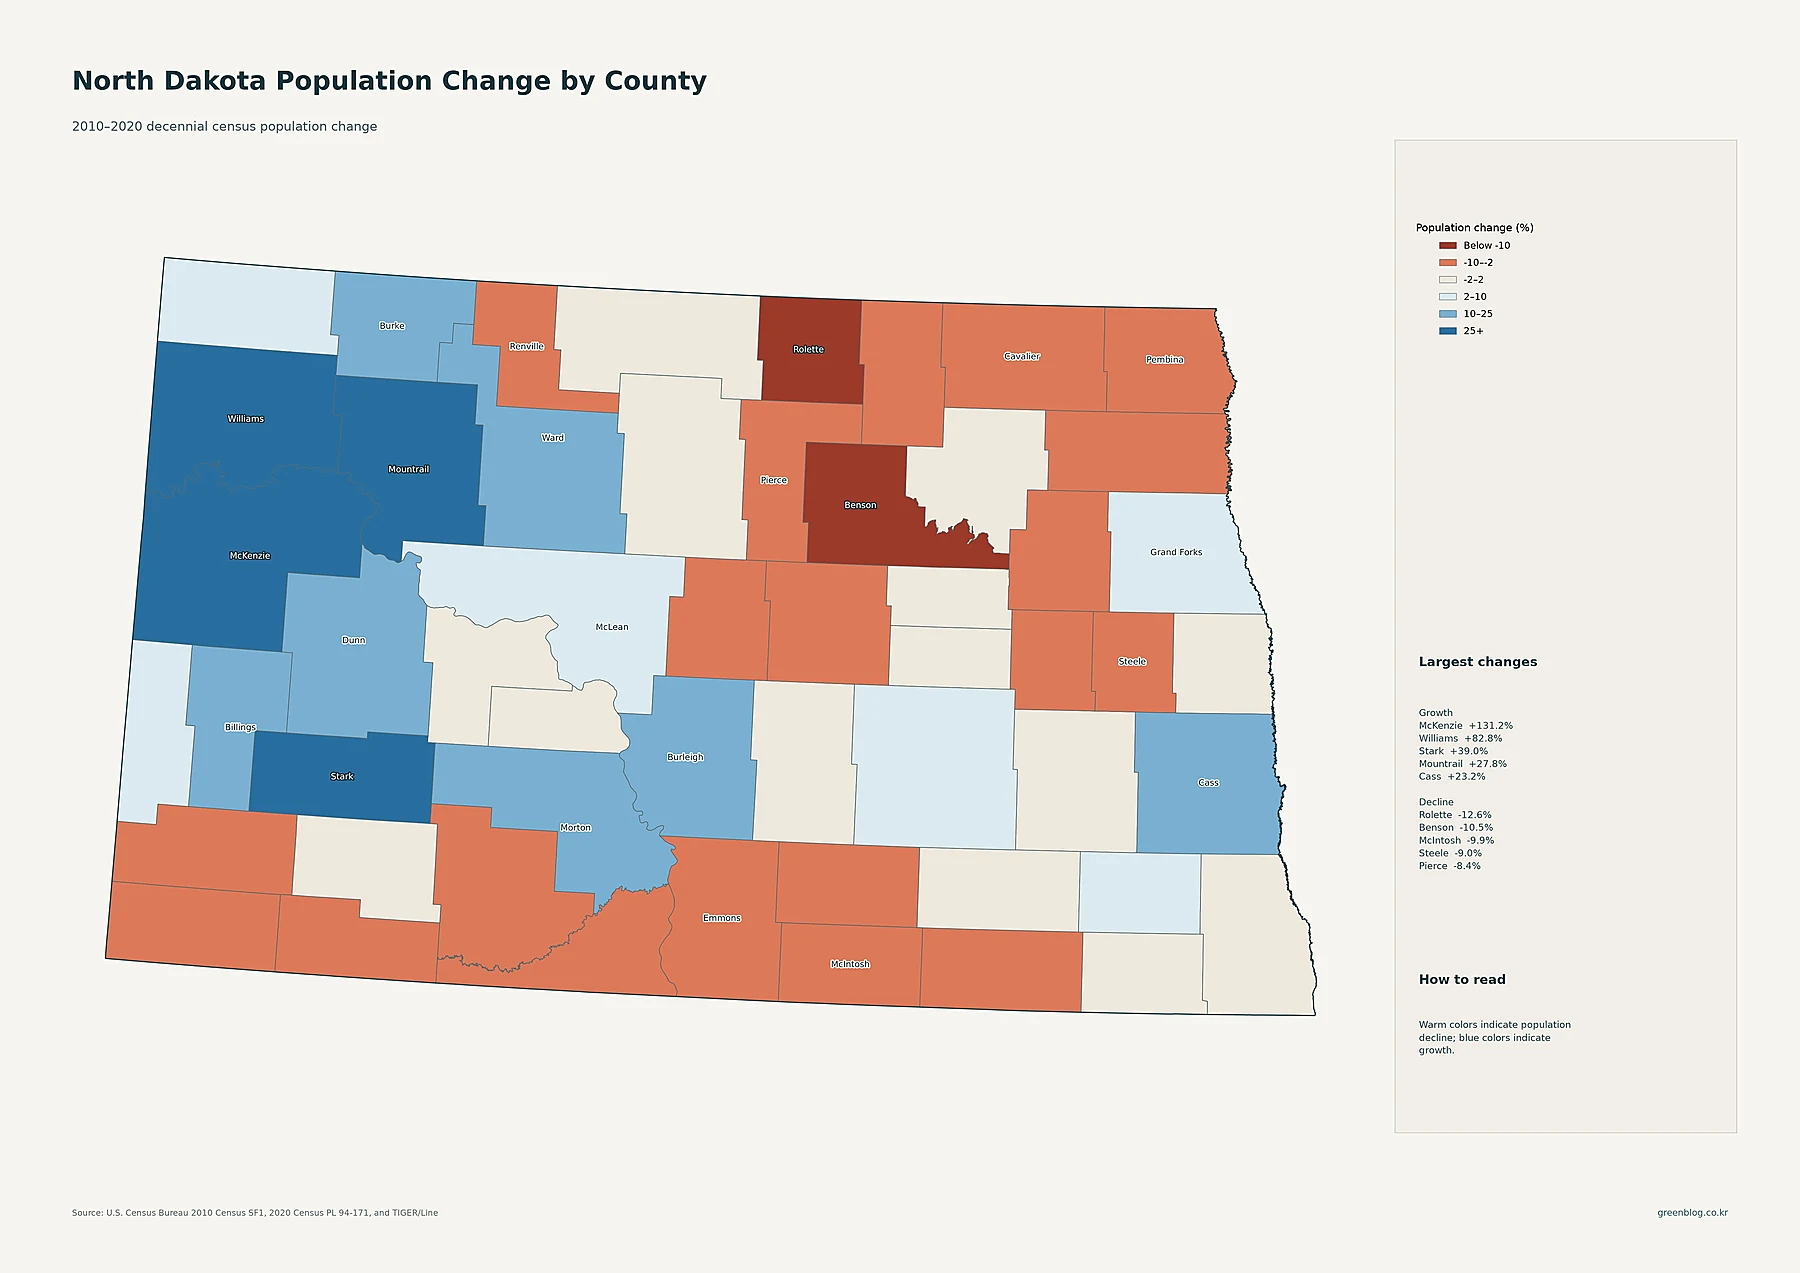
McKenzie County recorded the largest percentage increase in the supplied decade data. Its population rose from 6,360 in 2010 to 14,704 in 2020, an increase of about 131.2%. Williams County grew from 22,398 to 40,950, or 82.8%. Stark County increased 39.0% and Mountrail County 27.8%. Cass grew 23.2%, Morton 21.2%, Burleigh 21.1%, Billings 20.7%, Dunn 15.8%, and Ward 13.4%.
The map makes the western concentration of growth especially clear. McKenzie, Williams, Stark, and Mountrail form a cluster of strong blue shades, while the Fargo area in Cass and the Bismarck–Mandan area in Burleigh and Morton also grew substantially. This is an important distinction from current population size. Cass is the state’s largest county today, but McKenzie and Williams grew much faster in percentage terms during the 2010s.
Several counties declined during the same decade. Rolette County fell from 13,937 residents in 2010 to 12,187 in 2020, a decrease of about 12.6%. Benson declined 10.5%, McIntosh 9.9%, Steele 9.0%, Pierce 8.4%, Pembina 7.7%, Renville 7.6%, and Cavalier 7.2%. The warm colors are spread across portions of the north-central, northeast, and southeast. These figures are 2010–2020 decennial-census changes and should not be presented as changes in the 2024 ACS estimates.
North Dakota combines a few strong population centers with a sparse statewide landscape and sharply different county trends
The five maps reveal a consistent geography while measuring different parts of it. Fargo is the largest census place, and Cass County leads both county population and county-average density. Bismarck–Mandan, Grand Forks, and Minot form additional major centers, while Williston, Dickinson, and Watford City stand out in western North Dakota. At the tract level, each of these cities appears as a compact area of higher density surrounded by extensive low-density land.
The historical change layer adds a second major pattern. Western counties such as McKenzie and Williams posted extraordinary percentage gains between 2010 and 2020, while Rolette, Benson, and several other counties declined. That means a large current population, a high density, and a fast growth rate are not interchangeable measures. Reading the city circles, county totals, tract density, county density, and decade change separately gives a much more accurate picture of where North Dakotans live and how that geography changed during the 2010s.
Download the North Dakota population map collection
The ZIP includes detailed census-tract density, major cities and urban areas, county population totals, 2010–2020 county population change, and county population density.
FAQ
Which North Dakota county has the largest population?
Cass County is the largest in the supplied 2024 ACS 5-year estimates, with 193,400 residents. Burleigh County has 100,600 and Grand Forks County 72,923.
Which North Dakota county has the highest population density?
Cass County has the highest county-average density at about 109.6 people per square mile. Burleigh is about 61.6 and Grand Forks about 50.8 people per square mile.
Which North Dakota county grew fastest from 2010 to 2020?
McKenzie County grew about 131.2%, followed by Williams County at 82.8%, Stark County at 39.0%, and Mountrail County at 27.8%. These percentages compare the 2010 and 2020 decennial censuses.
Related Maps
Sources
- U.S. Census Bureau — American Community Survey (ACS): 2024 5-year population and density estimates
- U.S. Census Bureau — TIGER/Line Shapefiles: 2024 state, county, census tract, place geography and mapped boundaries
- U.S. Census Bureau — Decennial Census: 2010 and 2020 county population comparison
Green Map creates custom-edited map images using open geographic data sources such as geoBoundaries, Natural Earth, OpenStreetMap, and government open data. These maps are edited visual materials, not raw data files, and are provided for education, documents, presentations, and graphic reference.