North Carolina does not have a single dominant population core. Instead, the maps show several major concentrations spread across the Piedmont and beyond. Charlotte anchors the southwest, while Raleigh, Durham, Cary, and nearby communities form another major cluster in the Triangle. Greensboro, Winston-Salem, and High Point create a third concentration across the Piedmont Triad. Asheville, Fayetteville, Wilmington, Greenville, and Jacksonville stand out as regional centers separated by broader areas of lower density.
The supplied 2024 ACS 5-year estimates put North Carolina’s population at 10,730,404. The county-density map reports about 48,624 square miles of land and a statewide average of roughly 221 people per square mile. That average is only a starting point. Mecklenburg County averages more than 2,200 people per square mile, while Hyde and Tyrrell average fewer than 10. The five maps also show that the largest county population, the highest density, and the fastest 2010–2020 growth belong to different counties.
Table of Contents
The tract map shows two especially large density clusters around Charlotte and the Triangle
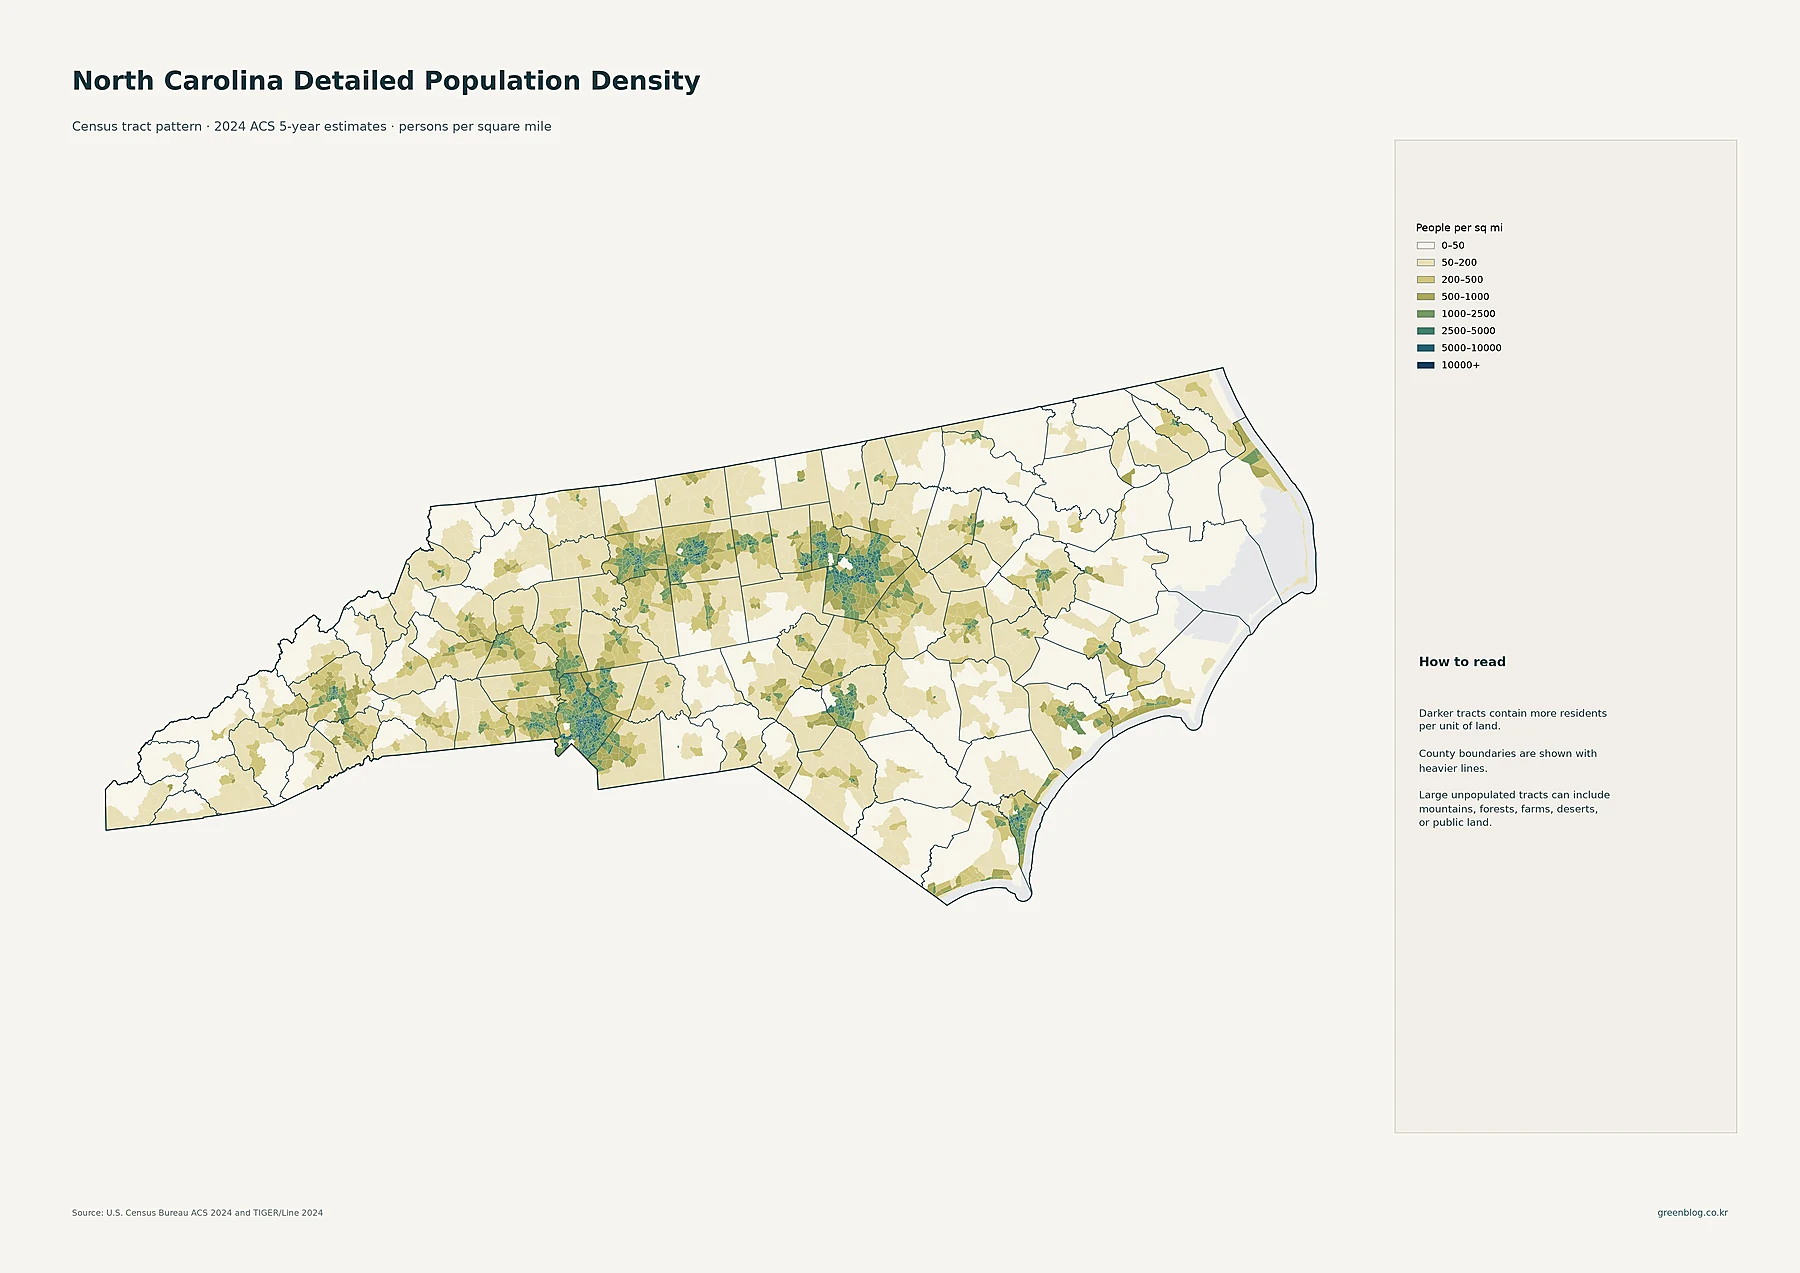
The most extensive dark tract clusters appear around Charlotte in Mecklenburg County and around Raleigh and Durham in the Triangle. Central Charlotte and its surrounding suburbs contain many tracts in the 1,000–2,500, 2,500–5,000, and higher density classes. The Triangle shows a broad pattern rather than a single dot: higher-density tracts around Raleigh and Durham continue through suburban communities such as Cary and Apex, producing one of the largest continuous settlement areas on the map.
Between those two anchors, Greensboro, Winston-Salem, and High Point each form distinct dark clusters. Their proximity creates a recognizable Piedmont urban band. Asheville stands out in the mountain west against a much lighter background. Fayetteville is a separate concentration farther southeast, while Greenville, Jacksonville, and Wilmington create additional pockets in eastern and coastal North Carolina. The tract pattern makes it clear that population is not evenly spread across county boundaries.
The lightest tracts are common in portions of the western mountains, the northeastern coastal plain, and several rural interior areas. A light tract does not mean an entire county is empty. Census tracts are small enough to separate compact towns and suburban areas from surrounding low-density land. That distinction matters in North Carolina because several counties contain both sizable population centers and large rural sections.
Charlotte is the largest census place, but the state has several substantial urban centers
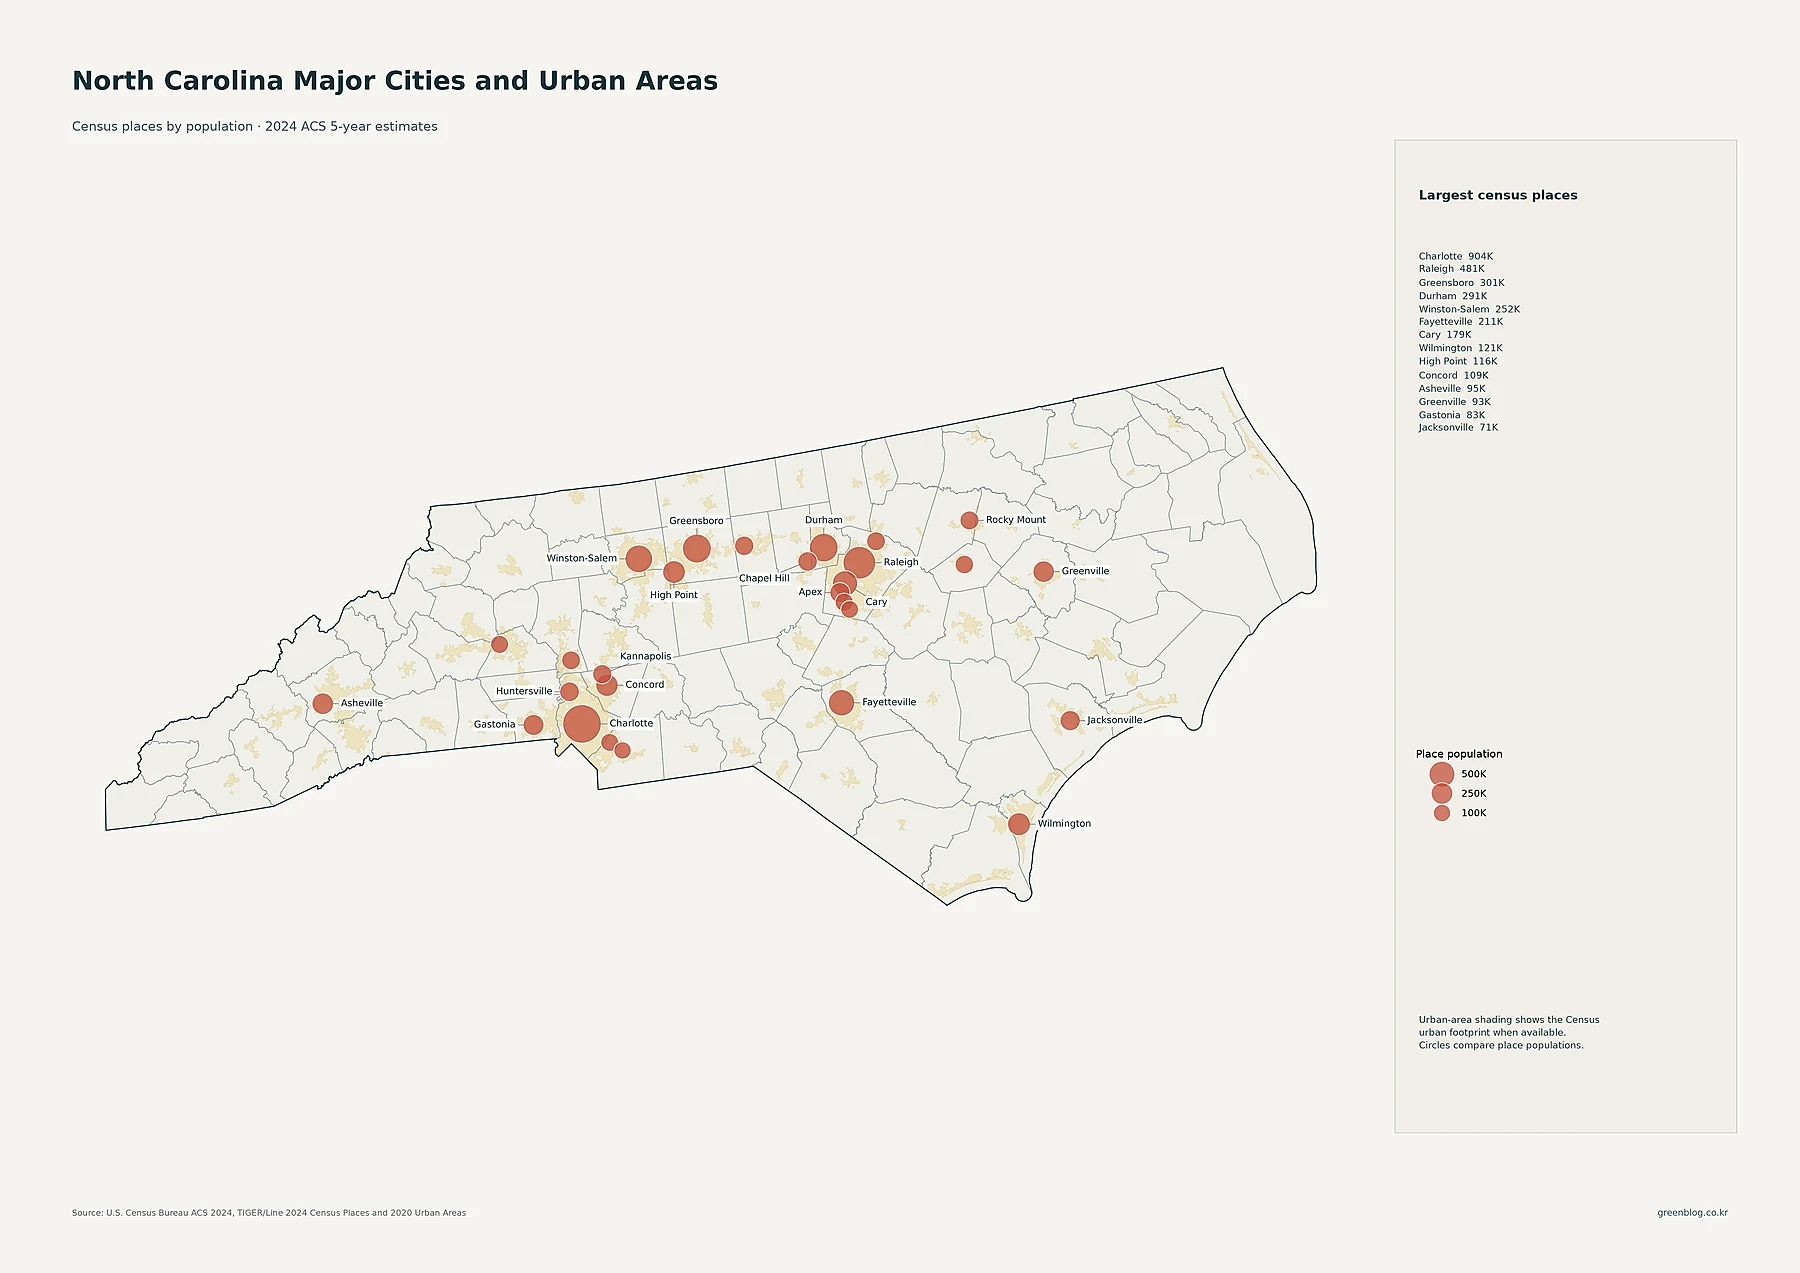
Charlotte is the largest census place in the supplied data with 903,844 residents. Raleigh is second at 481,031. Greensboro has 301,198, Durham 291,467, Winston-Salem 252,037, and Fayetteville 210,815. Cary has 179,306 residents, Wilmington 120,805, High Point 116,245, and Concord 108,719. Asheville has 94,535, Greenville 92,857, Gastonia 82,884, Jacksonville 71,279, and Apex 70,630.
The proportional circles represent total place population, not density. Charlotte’s very large circle therefore says that more people live within its census-place boundary than in any other place shown. It does not by itself establish the highest number of people per square mile. The same distinction matters around Raleigh, Cary, and Apex: the city map draws separate circles, while the tract map shows how the surrounding settlement forms a broader connected urban area.
Wake narrowly leads Mecklenburg in county population
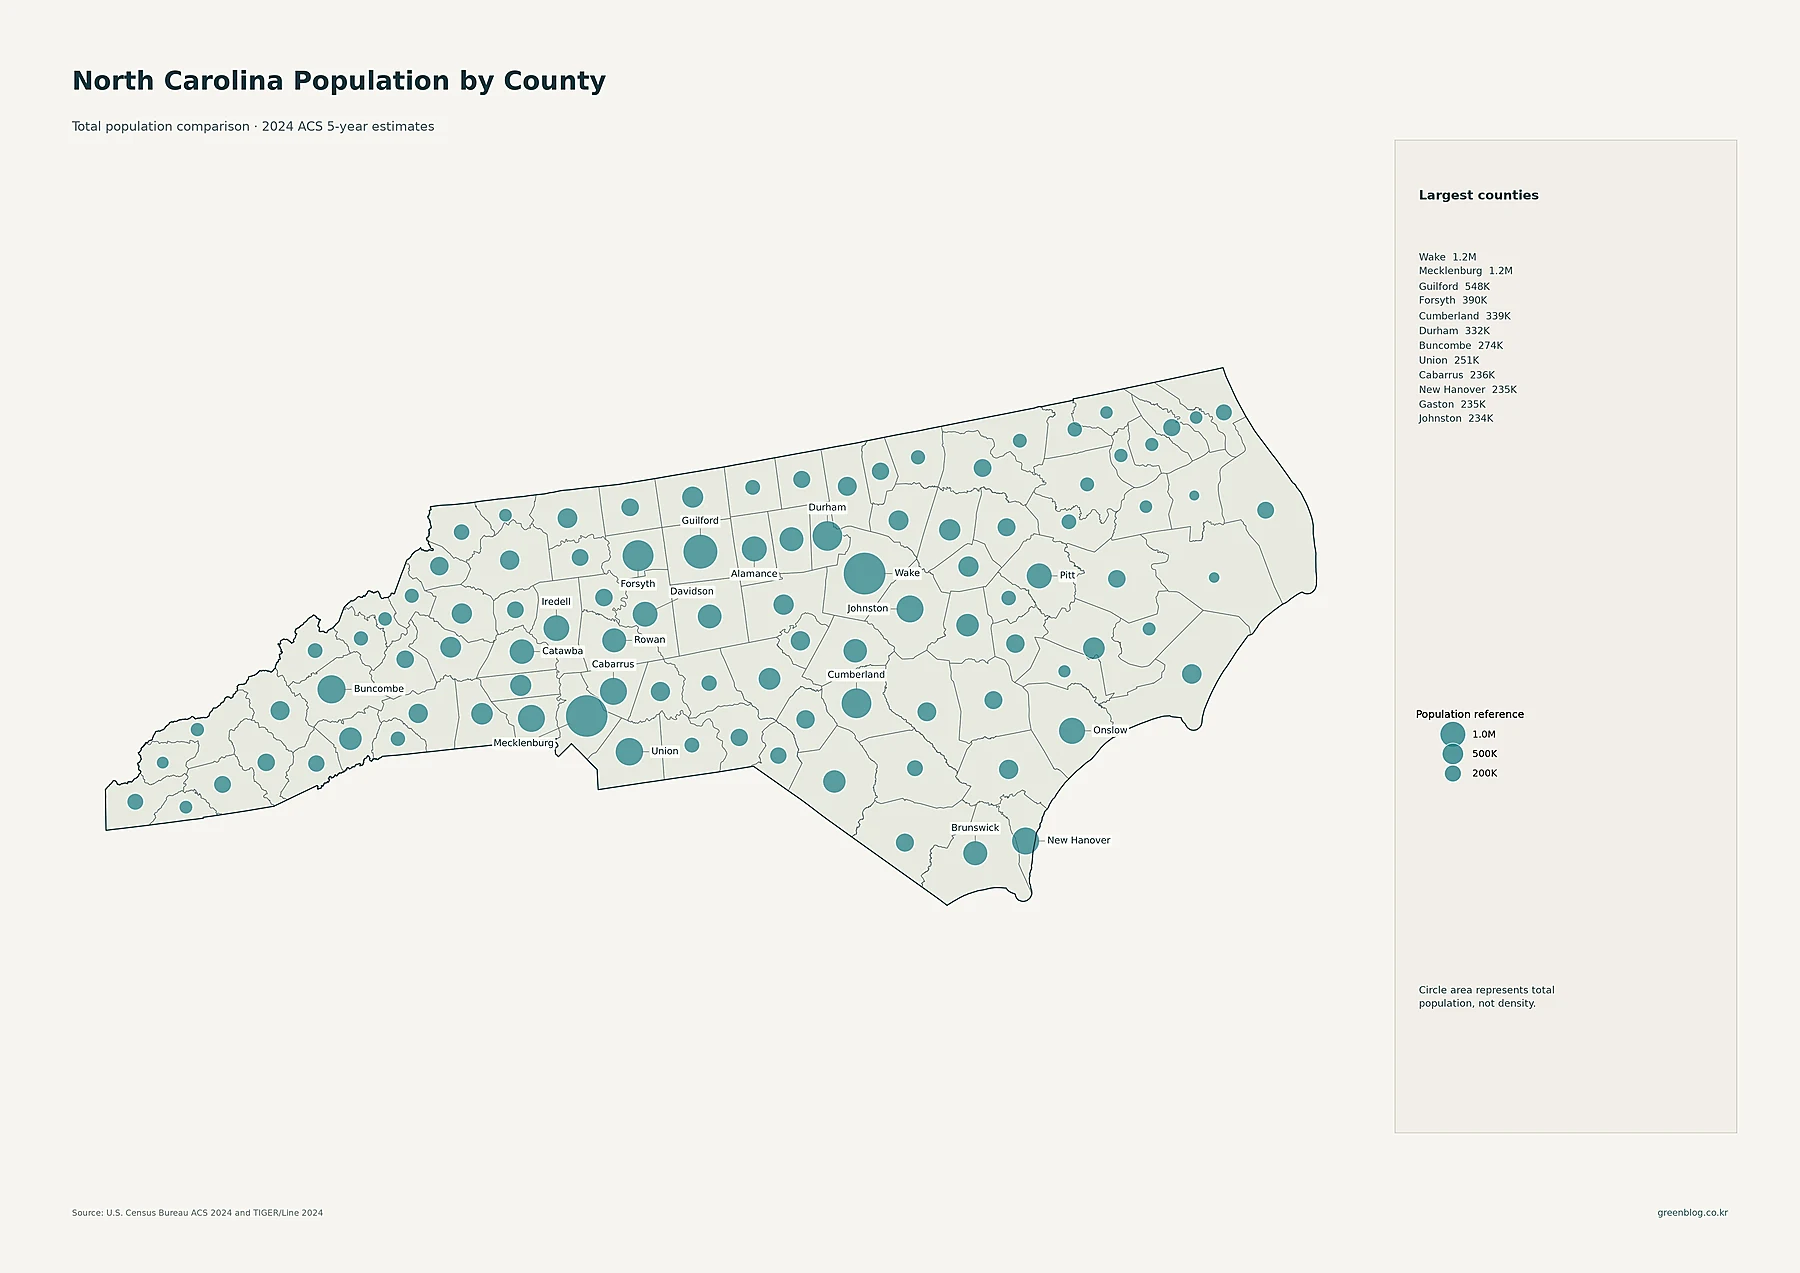
Wake County has the largest current county population at 1,178,653, only slightly ahead of Mecklenburg County at 1,154,681. Guilford is third at 547,940. Forsyth has 389,977 residents, Cumberland 338,545, and Durham 332,353. Buncombe has 274,360, Union 250,958, Cabarrus 236,133, New Hanover 235,229, Gaston 234,881, and Johnston 234,263.
The largest circles reinforce the importance of the Triangle and Charlotte, but they also show sizable populations in other parts of the state. Guilford and Forsyth stand out in the Piedmont Triad, Buncombe anchors the Asheville area, Cumberland contains Fayetteville, and New Hanover stands out on the southeast coast. County population totals measure how many residents live within each county. Because county land areas vary, the density ranking changes when population is divided by land area.
Mecklenburg has the highest county density, while New Hanover ranks above several larger counties
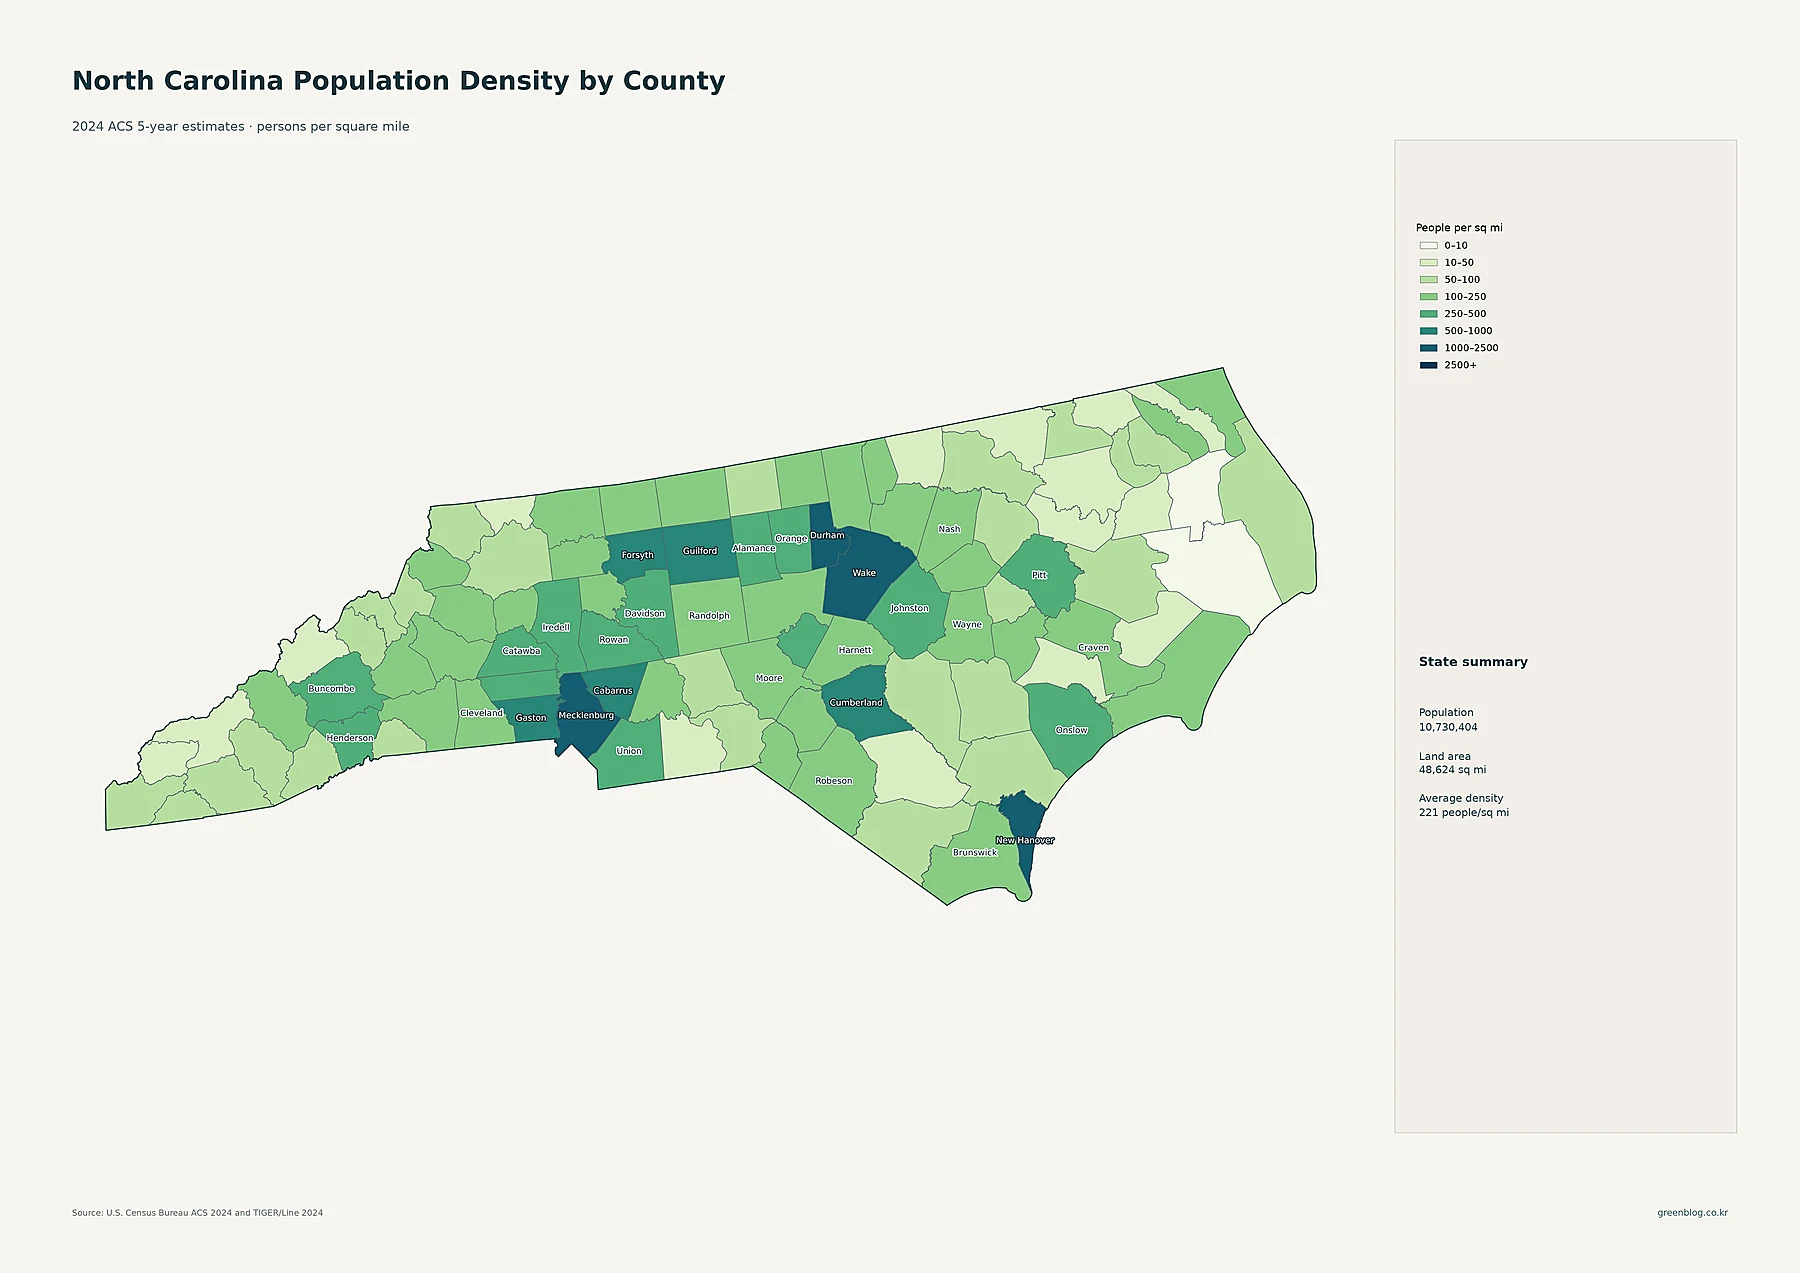
Mecklenburg County has the highest average density in the supplied data at about 2,205.2 people per square mile. Wake County is about 1,412.2, New Hanover 1,223.7, and Durham 1,155.8. Forsyth averages about 955.7 and Guilford 848.2, followed by Gaston at 660.2 and Cabarrus at 653.7. New Hanover’s high ranking is important because its total population is far below Wake or Mecklenburg, yet its smaller land area produces a county-average density above 1,200 people per square mile.
At the other end, Hyde County averages about 7.5 people per square mile and Tyrrell about 8.8. Jones is about 19.7, Bertie 24.6, Swain 26.6, and Graham 27.6. These values show how much variation sits behind the statewide average of 221. North Carolina combines very dense metropolitan counties, moderately dense regional centers, and broad mountain, rural, and coastal counties with much lower average densities.
| Measure | Leading area | Value in supplied data |
|---|---|---|
| State population | North Carolina | 10,730,404 |
| Largest county population | Wake County | 1,178,653 |
| Highest county density | Mecklenburg County | about 2,205.2/sq mi |
| Fastest 2010–2020 growth | Johnston County | +27.9% |
| Largest 2010–2020 decline | Tyrrell County | -26.4% |
Johnston, Brunswick, Cabarrus, and Wake led growth during the 2010s
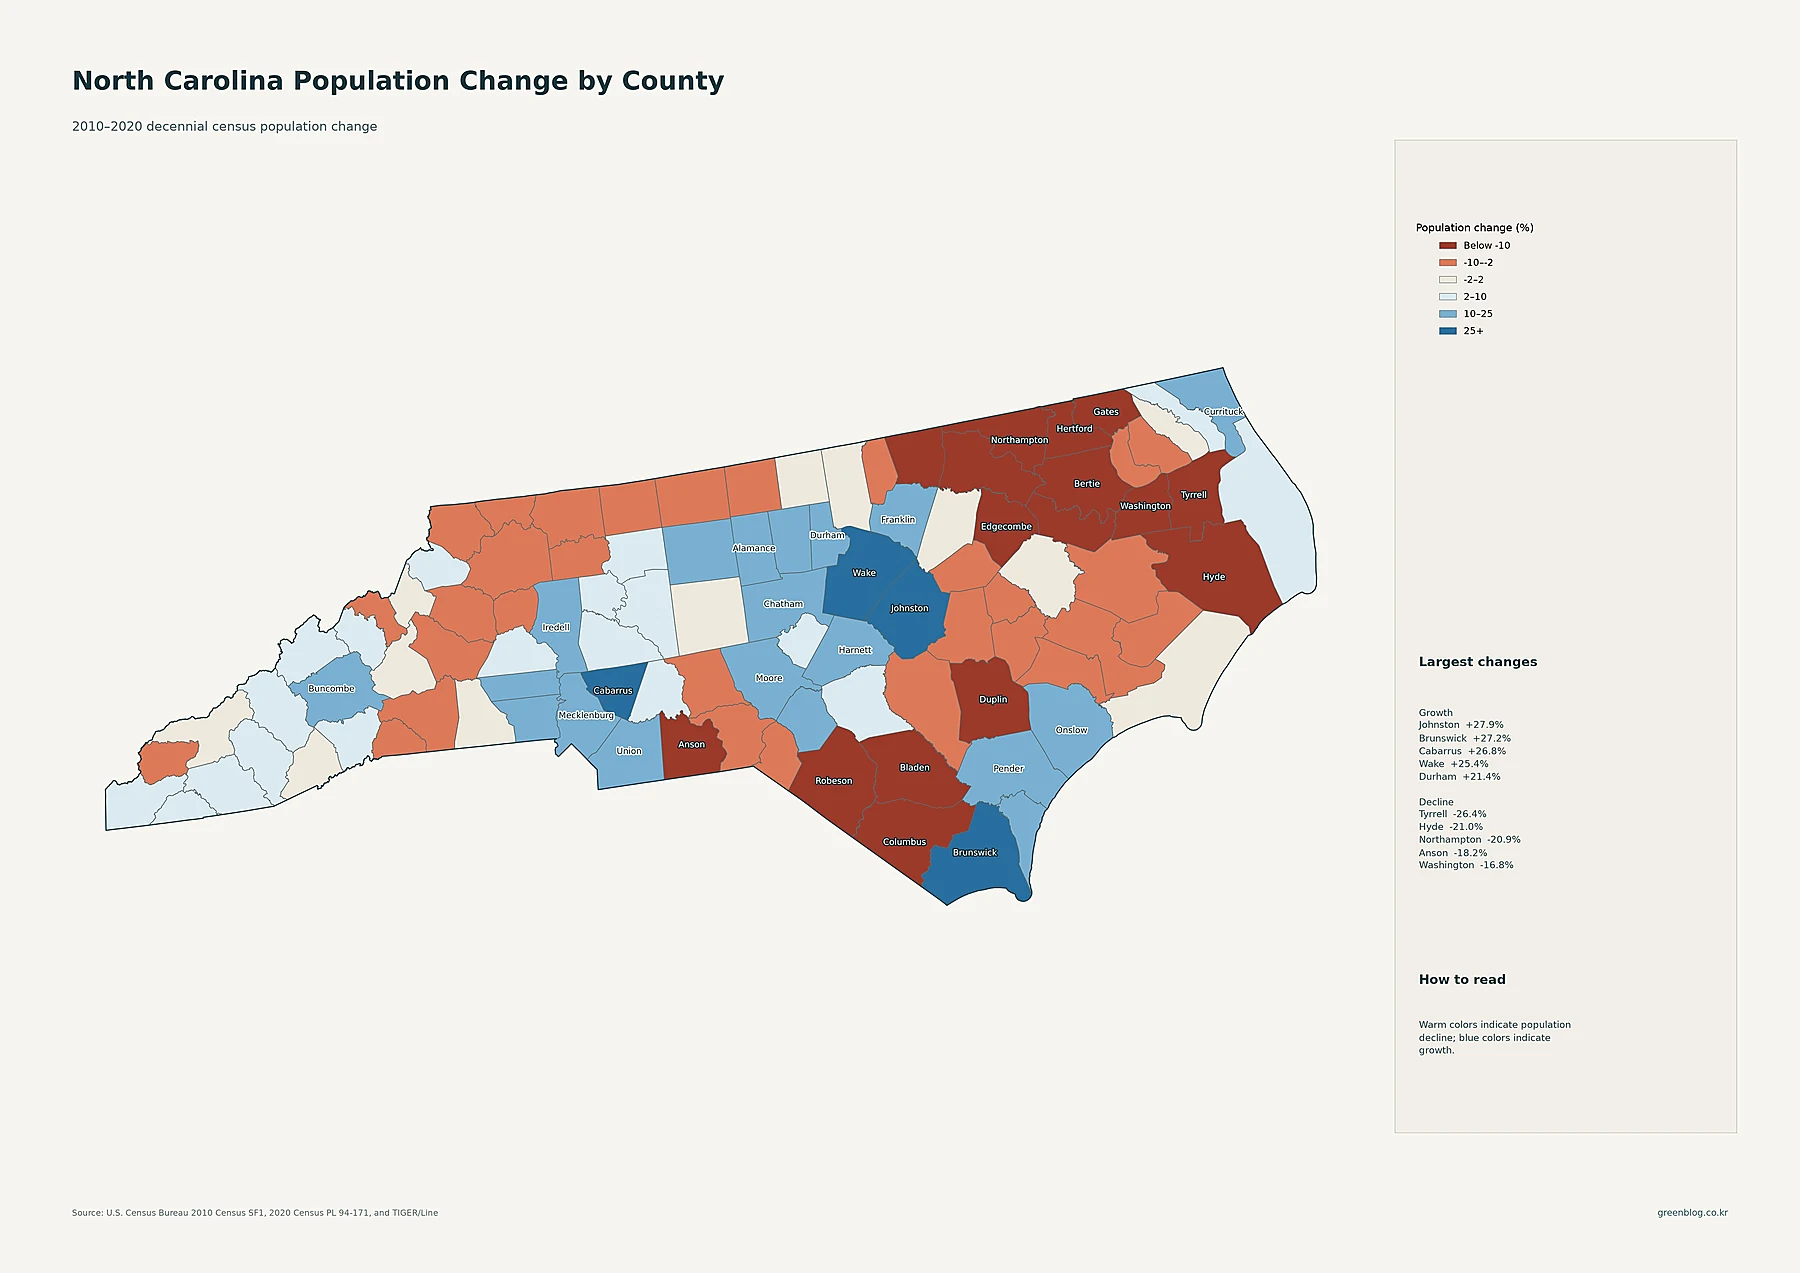
Johnston County recorded the fastest percentage growth in the supplied decade data. Its population rose from 168,878 in 2010 to 215,999 in 2020, an increase of about 27.9%. Brunswick County grew from 107,431 to 136,693, or about 27.2%. Cabarrus increased 26.8% and Wake 25.4%. Durham grew 21.4%, Mecklenburg 21.3%, Chatham 20.1%, Currituck 19.3%, Union 18.4%, and Iredell 17.1%.
The geography of growth is broader than the location of the two largest cities. Johnston lies beside Wake, Cabarrus and Union sit near the Charlotte area, and Chatham is adjacent to the Triangle. Brunswick on the southeast coast also posted one of the strongest gains, while Currituck grew in the far northeast. The map therefore shows both metropolitan-edge growth and selected coastal growth rather than one simple statewide direction.
Several counties moved sharply the other way. Tyrrell fell from 4,407 residents in 2010 to 3,245 in 2020, a decline of about 26.4%. Hyde declined 21.0%, Northampton 20.9%, Anson 18.2%, Washington 16.8%, Duplin 16.7%, Bladen 15.9%, and Bertie 15.7%. Warm colors are especially common across parts of northeastern and eastern interior North Carolina. These percentages are 2010–2020 decennial-census comparisons and should not be described as 2024 ACS changes.
North Carolina’s population pattern is best understood as several urban systems with very different county trajectories
The map set separates three rankings that could otherwise be mistaken for one another. Charlotte is the largest census place. Wake is the largest county by total population. Mecklenburg is the densest county on average. The tract map adds another layer by showing that Charlotte and the Triangle are broad clusters made up of many high-density neighborhoods and suburbs rather than single points. The Piedmont Triad and regional centers such as Asheville, Fayetteville, Wilmington, and Greenville add further structure.
The 2010–2020 change map makes the pattern even more varied. Johnston, Brunswick, and Cabarrus grew faster in percentage terms than either of the two largest counties, while Tyrrell, Hyde, Northampton, and other counties lost substantial shares of their populations. The most accurate way to read North Carolina is therefore to keep place totals, county totals, density, tract-level settlement, and historical change as separate measures. Together they show where people live now without turning every large circle or dark color into the same claim.
Download the North Carolina population map collection
The ZIP includes detailed census-tract density, major cities and urban areas, county population totals, 2010–2020 county population change, and county population density.
FAQ
Which North Carolina county has the largest population?
Wake County is the largest in the supplied 2024 ACS 5-year estimates, with 1,178,653 residents. Mecklenburg County is close behind at 1,154,681.
Which North Carolina county has the highest population density?
Mecklenburg County has the highest county-average density at about 2,205.2 people per square mile. Wake is about 1,412.2 and New Hanover about 1,223.7 people per square mile.
Which North Carolina county grew fastest from 2010 to 2020?
Johnston County grew about 27.9%, followed by Brunswick at 27.2%, Cabarrus at 26.8%, and Wake at 25.4%. These percentages compare the 2010 and 2020 decennial censuses.
Related Maps
Sources
- U.S. Census Bureau — American Community Survey (ACS): 2024 5-year population and density estimates
- U.S. Census Bureau — TIGER/Line Shapefiles: 2024 state, county, census tract, place geography and mapped boundaries
- U.S. Census Bureau — Decennial Census: 2010 and 2020 county population comparison
Green Map creates custom-edited map images using open geographic data sources such as geoBoundaries, Natural Earth, OpenStreetMap, and government open data. These maps are edited visual materials, not raw data files, and are provided for education, documents, presentations, and graphic reference.