New York State combines one of the world’s largest urban concentrations with vast areas of comparatively sparse settlement. The supplied 2024 ACS 5-year estimates put the state population at 19,852,366. The county-density map reports about 47,123 square miles of land and a statewide average near 421 people per square mile. That average is useful only as a starting point. New York City and the western end of Long Island reach extraordinary densities, while large parts of the Adirondacks, North Country, and central upstate counties fall into the lowest density classes.
The five maps also use several different geographic units. The detailed density map is based on census tracts. The city map compares census places. The county maps use county or county-equivalent boundaries. This matters particularly in New York City: the place labeled New York on the city map represents the city as a whole, while New York County in the county data is Manhattan. Kings County corresponds to Brooklyn, Queens County to Queens, Bronx County to the Bronx, and Richmond County to Staten Island. Total population and density should therefore be compared only within the correct geography.
Table of Contents
Census tracts expose the huge density gap between New York City and much of upstate New York
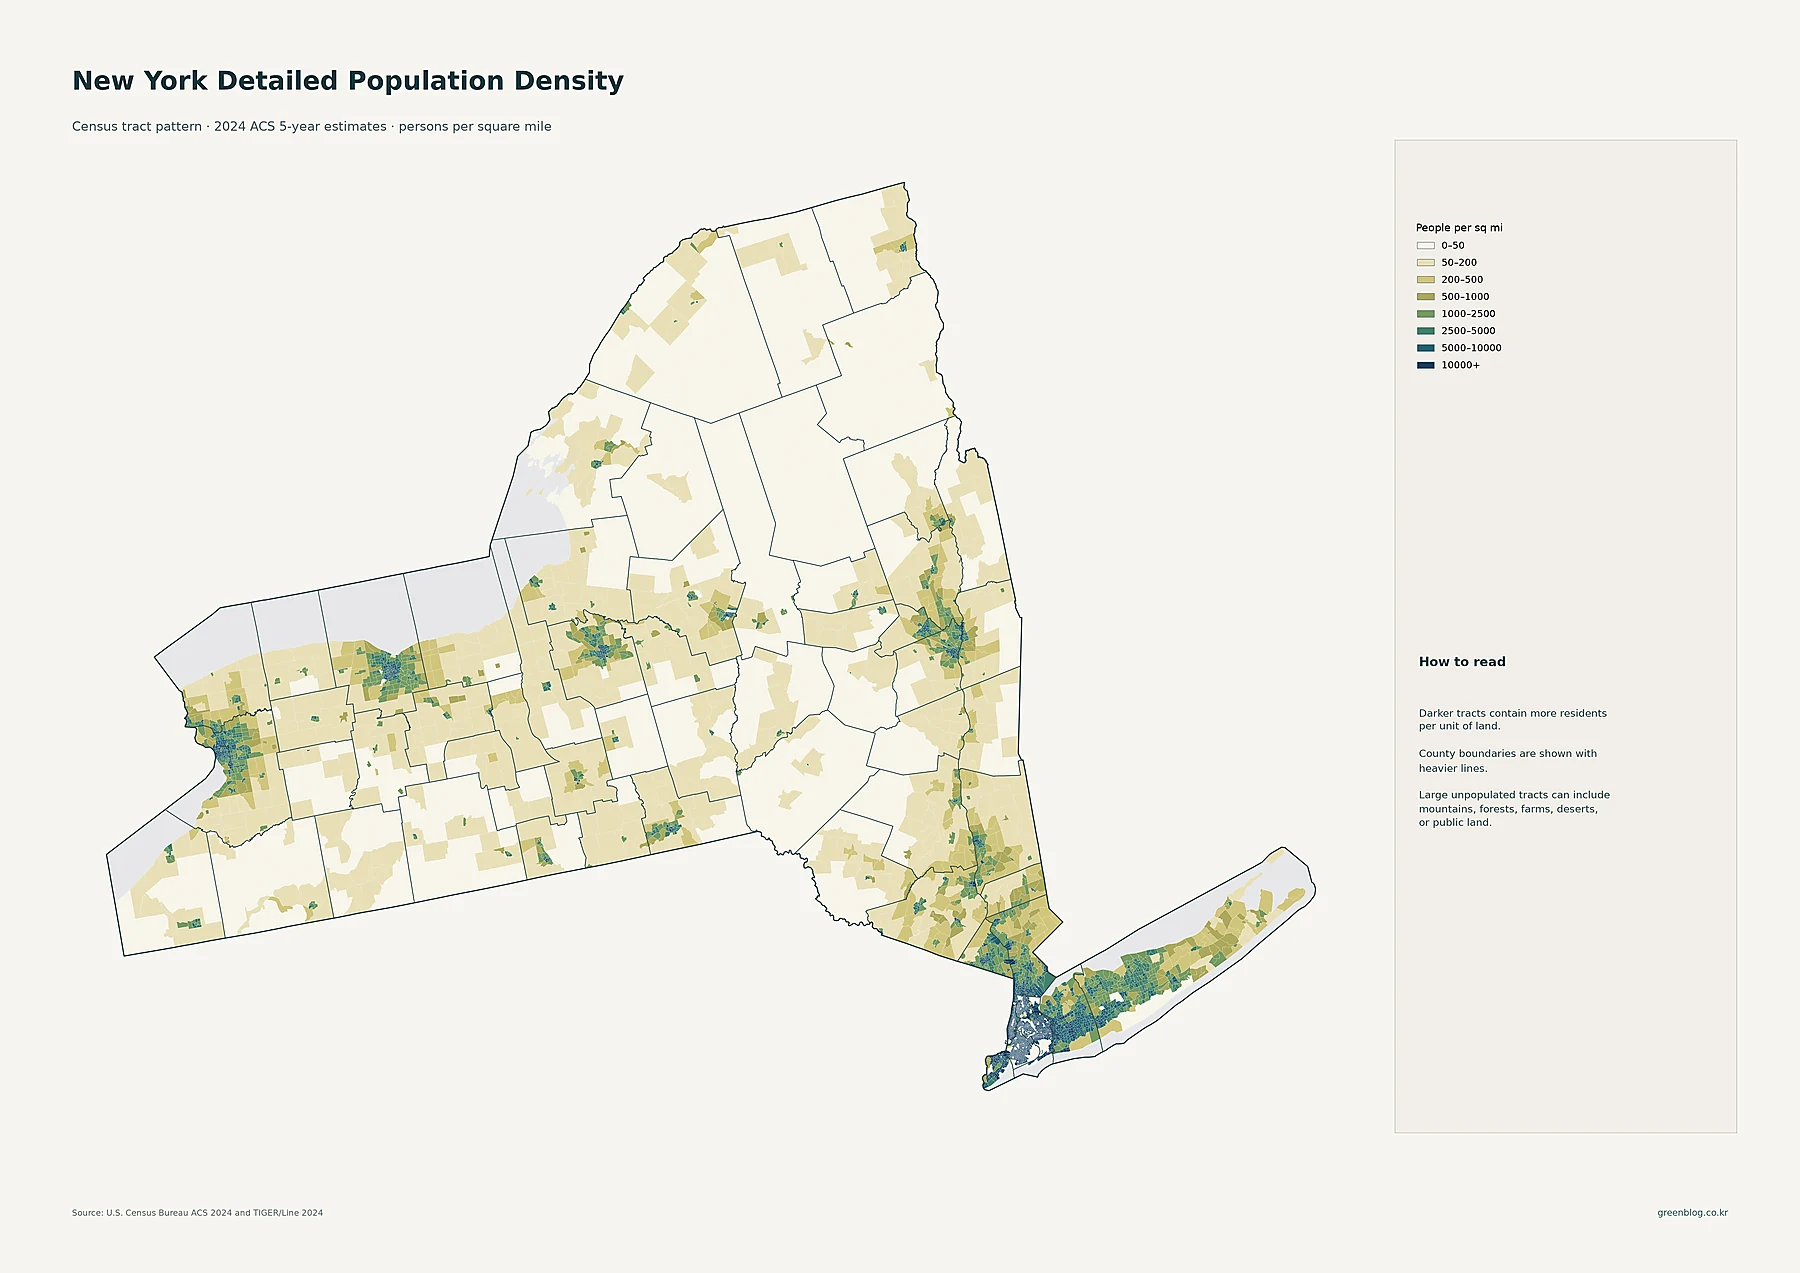
The darkest and most continuous tract pattern is concentrated at the southeastern tip of the state. Manhattan, Brooklyn, the Bronx, and Queens contain broad areas above 10,000 people per square mile. High-density tracts continue east through Nassau County and along developed parts of Long Island. Westchester and Rockland show additional concentrations close to New York City. The result is a large metropolitan cluster that is visually unlike any other part of the state.
Upstate New York is not uniformly sparse, however. Buffalo and Niagara Falls create a dense western cluster. Rochester, Syracuse, Utica, and the Albany–Schenectady–Troy area each form separate concentrations. Binghamton is visible near the Pennsylvania border, and smaller urban pockets appear throughout western and central New York. What distinguishes these areas from the New York City region is the amount of lightly populated land between them. The northern Adirondack and North Country counties contain especially broad tracts in the 0–50 or 50–200 people-per-square-mile classes.
New York City has 8.48 million residents, dwarfing every other census place in the state
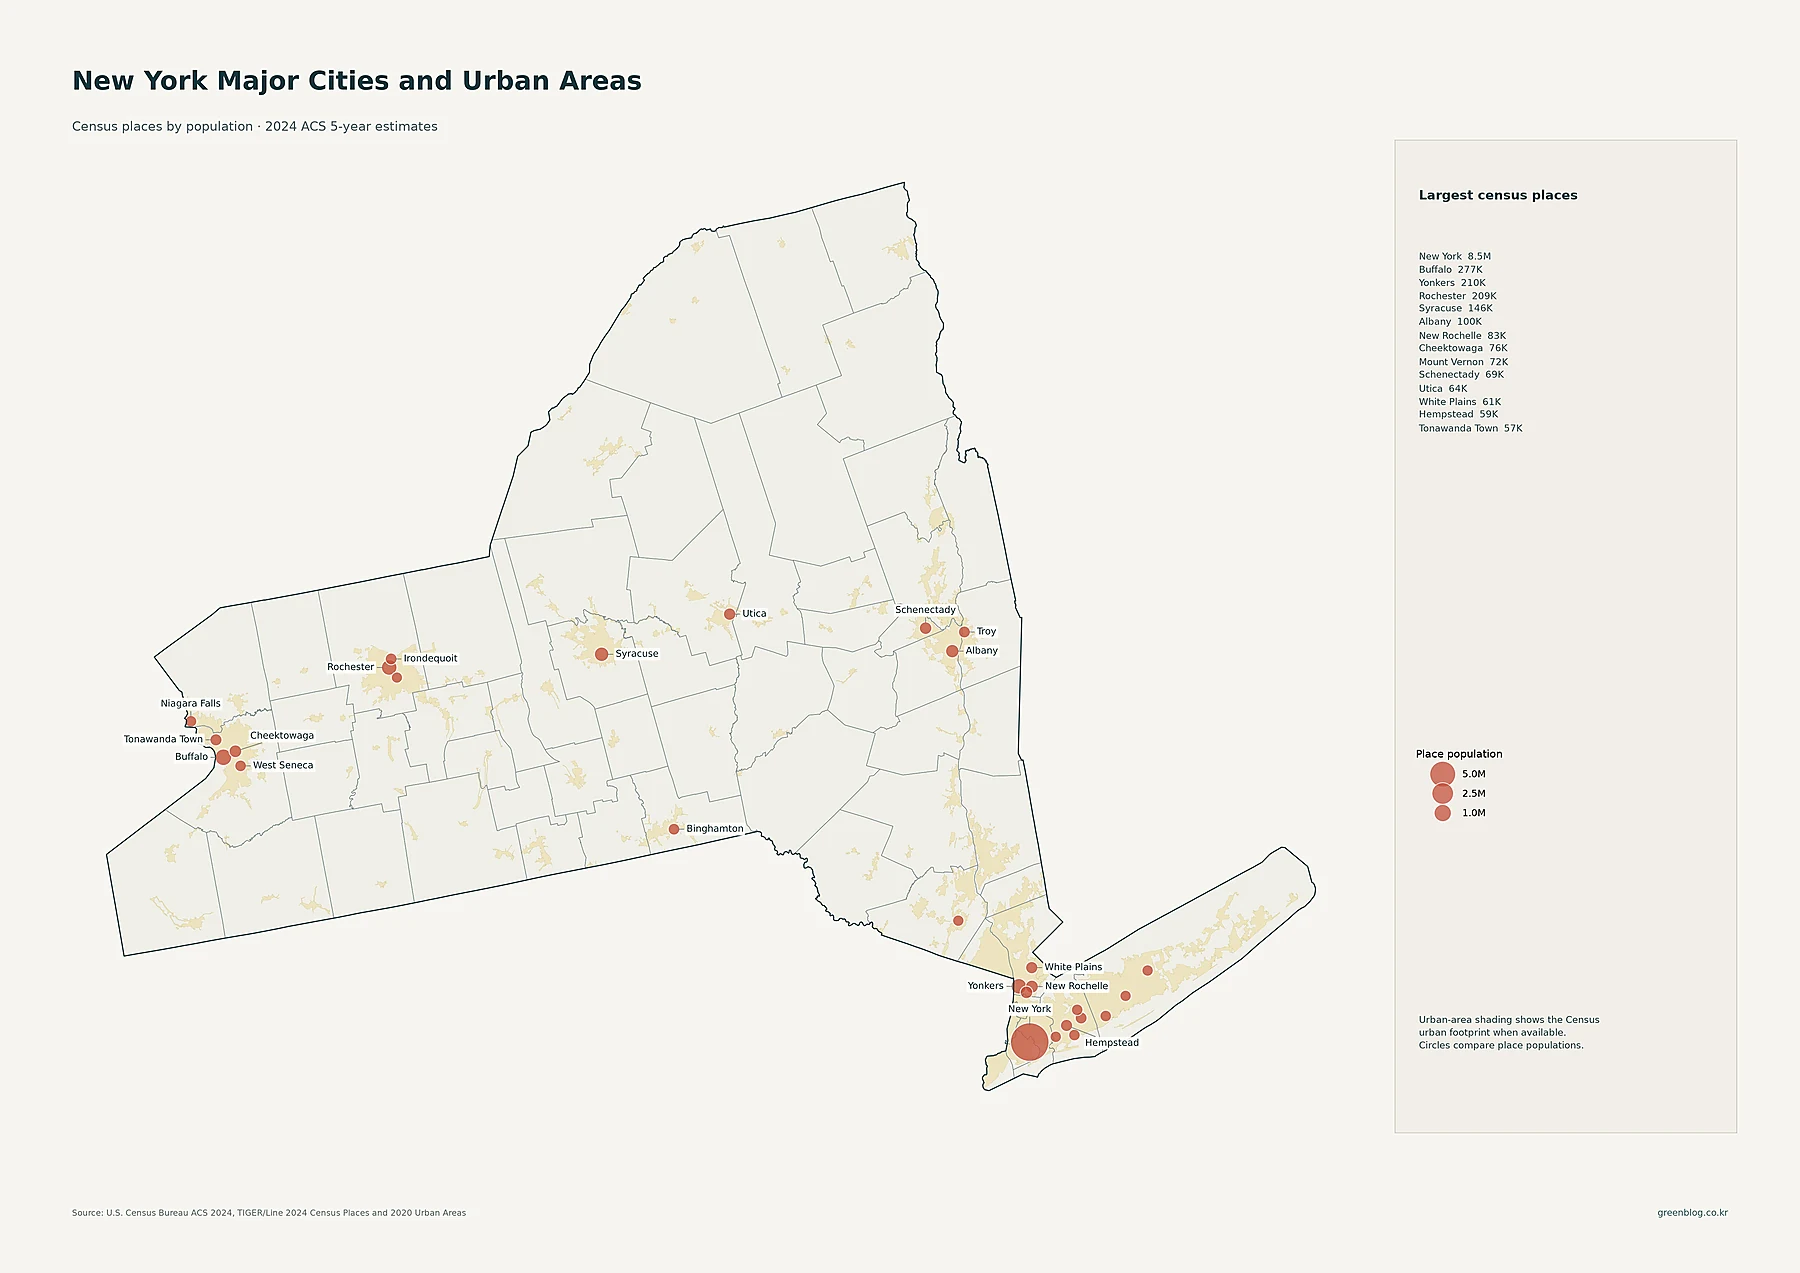
New York is by far the largest census place in the supplied file at 8,483,844 residents. Buffalo is second at 276,854. Yonkers has 209,978 residents and Rochester 208,772, followed by Syracuse at 146,384 and Albany at 100,492. New Rochelle has 82,769, Cheektowaga 76,056, Mount Vernon 72,427, Schenectady 68,847, Utica 64,217, and White Plains 60,666. The New York City circle therefore dominates the southeastern corner while upstate cities appear as much smaller regional centers.
Circle size represents total place population, not population density. That is an important distinction because municipal land areas vary greatly. A compact city may have a high density even if its total population is modest, while a larger place can contain more people but spread them across more land. The city map is best for answering where the state’s largest named population centers are located; the tract and county-density maps answer how tightly residents occupy space.
Kings County has the largest county population, followed by Queens and New York County
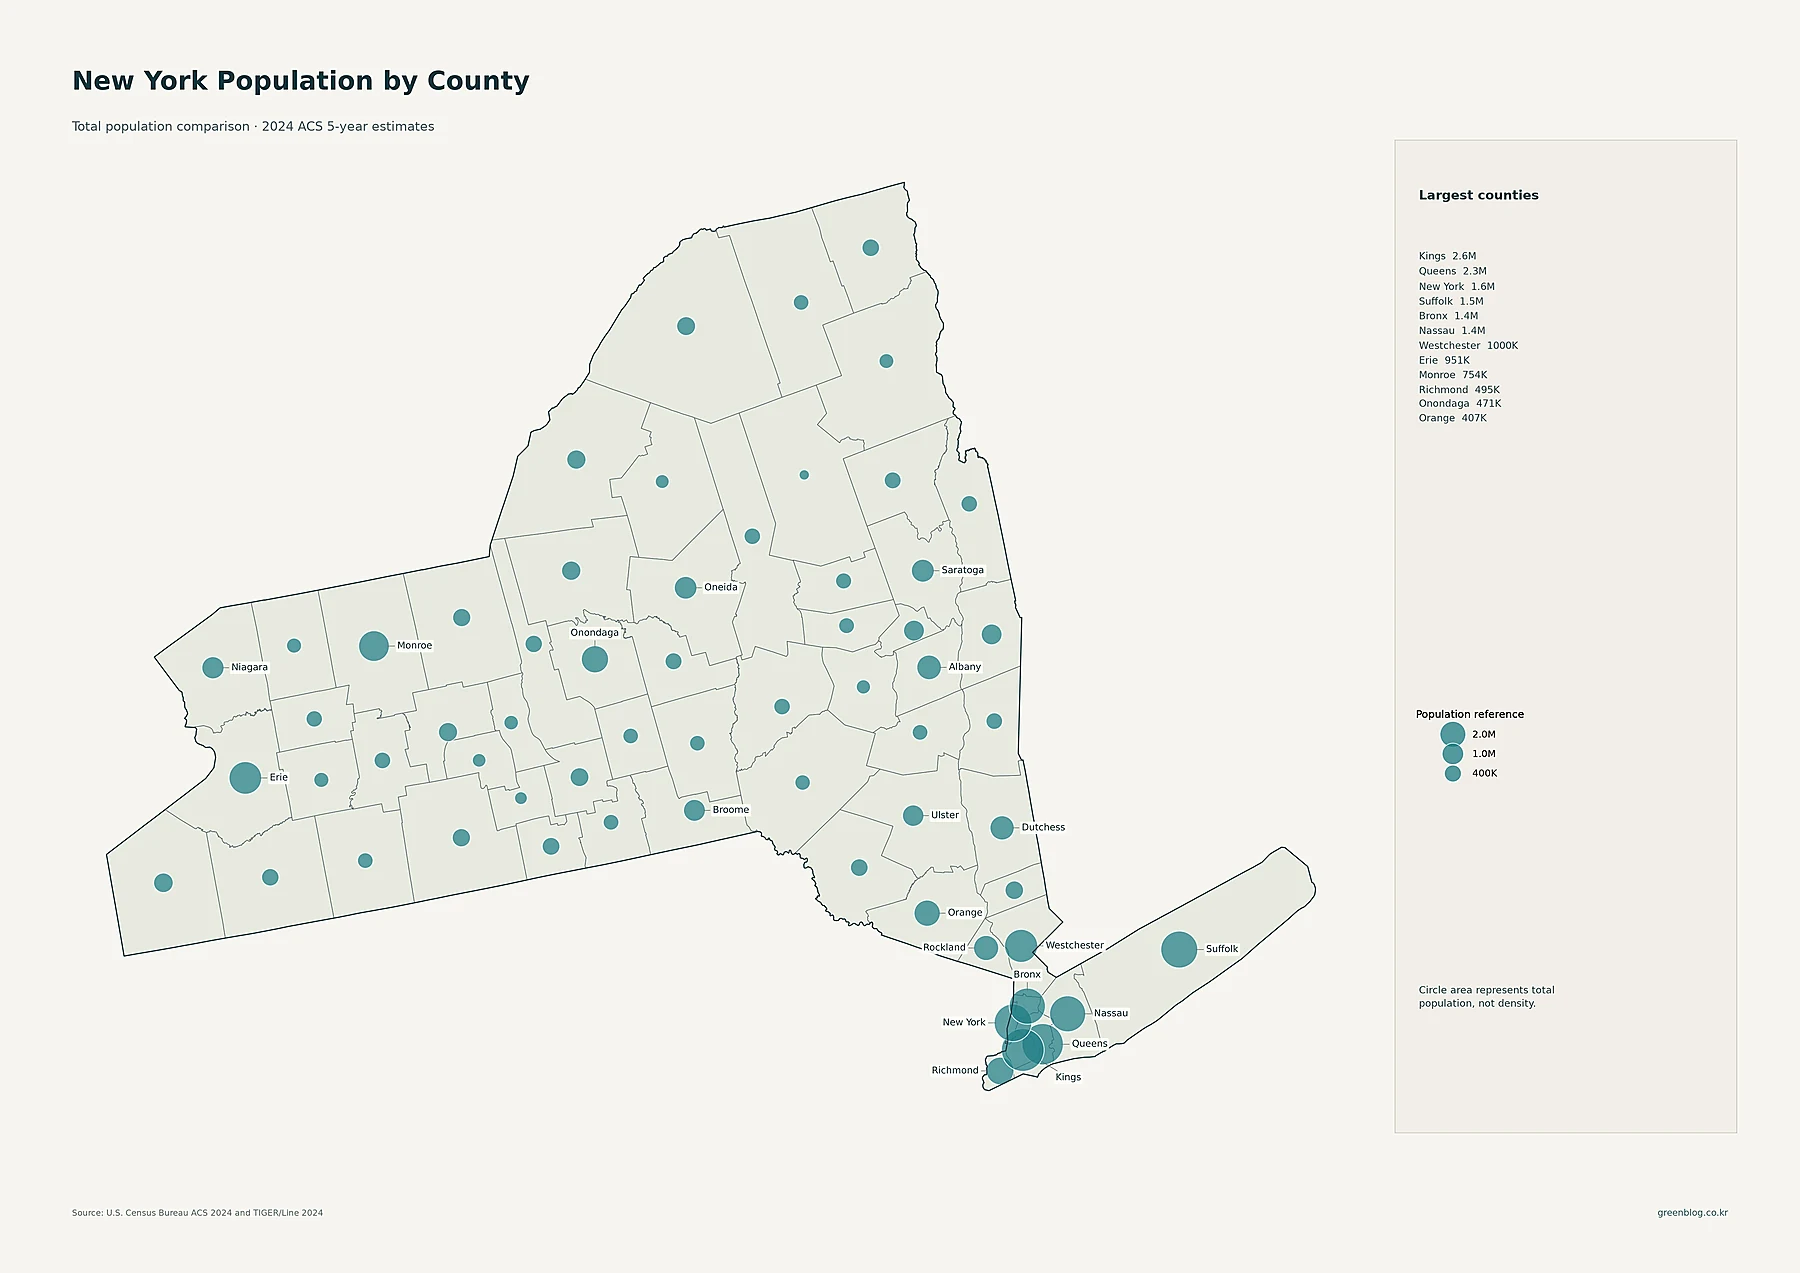
Kings County, corresponding to Brooklyn, has 2,631,580 residents and ranks first in the supplied county data. Queens County has 2,323,052 and New York County, Manhattan, has 1,629,477. Suffolk County has 1,530,146, Bronx County 1,404,779, and Nassau County 1,389,591. Westchester is close to one million at 999,677. Those figures explain the cluster of very large circles around New York City and Long Island.
Upstate, Erie County has 950,622 residents and Monroe County 753,753. Richmond County has 494,956, Onondaga 471,129, and Orange 406,616. At the other extreme, Hamilton County has only 5,089 residents, followed by Schuyler at 17,562, Yates at 24,526, and Lewis at 26,607. The map therefore captures a county-population range stretching from a few thousand people to more than 2.6 million.
Manhattan’s county-average density exceeds 71,000 people per square mile
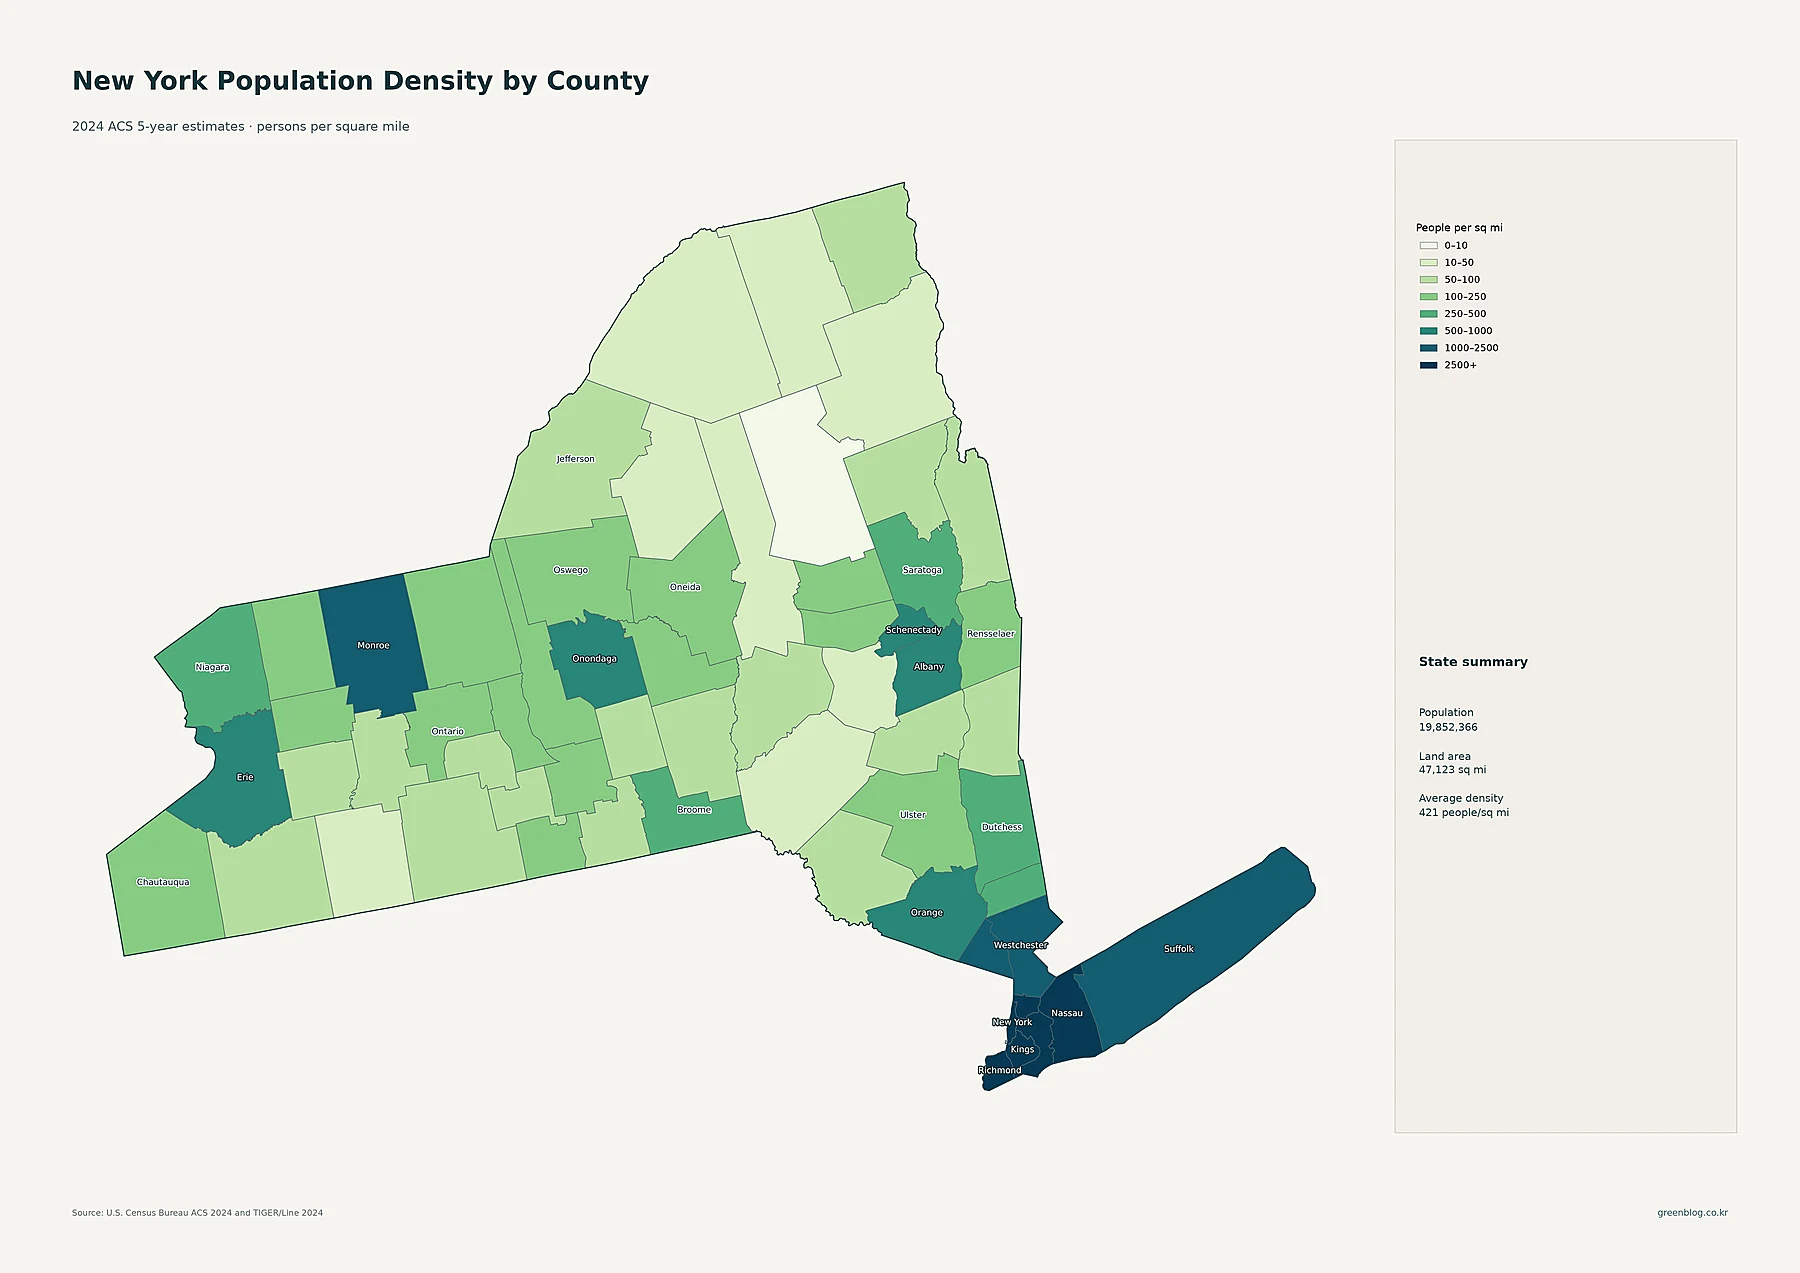
New York County has the highest average density at about 71,916 people per square mile. Kings County follows at about 37,932, the Bronx at 33,307, Queens at 21,366, and Richmond at 8,605. Nassau County averages about 4,884 people per square mile, Westchester 2,320, Rockland 1,968, and Suffolk 1,680. Even within the New York metropolitan region, density varies substantially, but every one of these counties stands well above most of the state.
Among major upstate counties, Monroe averages about 1,147 people per square mile, Erie about 912, Schenectady about 784, and Albany about 606. Hamilton County is at the opposite end with roughly 3.0 people per square mile. Essex and Lewis are near 21, Franklin around 29, Delaware about 31, and St. Lawrence about 40. New York’s statewide average of 421 therefore combines some of the nation’s densest county-equivalents with large rural counties that have fewer than 50 residents per square mile.
| Measure | Leading area | Value in supplied data |
|---|---|---|
| State population | New York State | 19,852,366 |
| Largest county population | Kings County | 2,631,580 |
| Highest county density | New York County | about 71,916/sq mi |
| Fastest 2010–2020 growth | Kings County | +9.2% |
| Largest 2010–2020 decline | Schoharie County | -9.3% |
The 2010s brought growth to much of the New York City region while many upstate counties declined
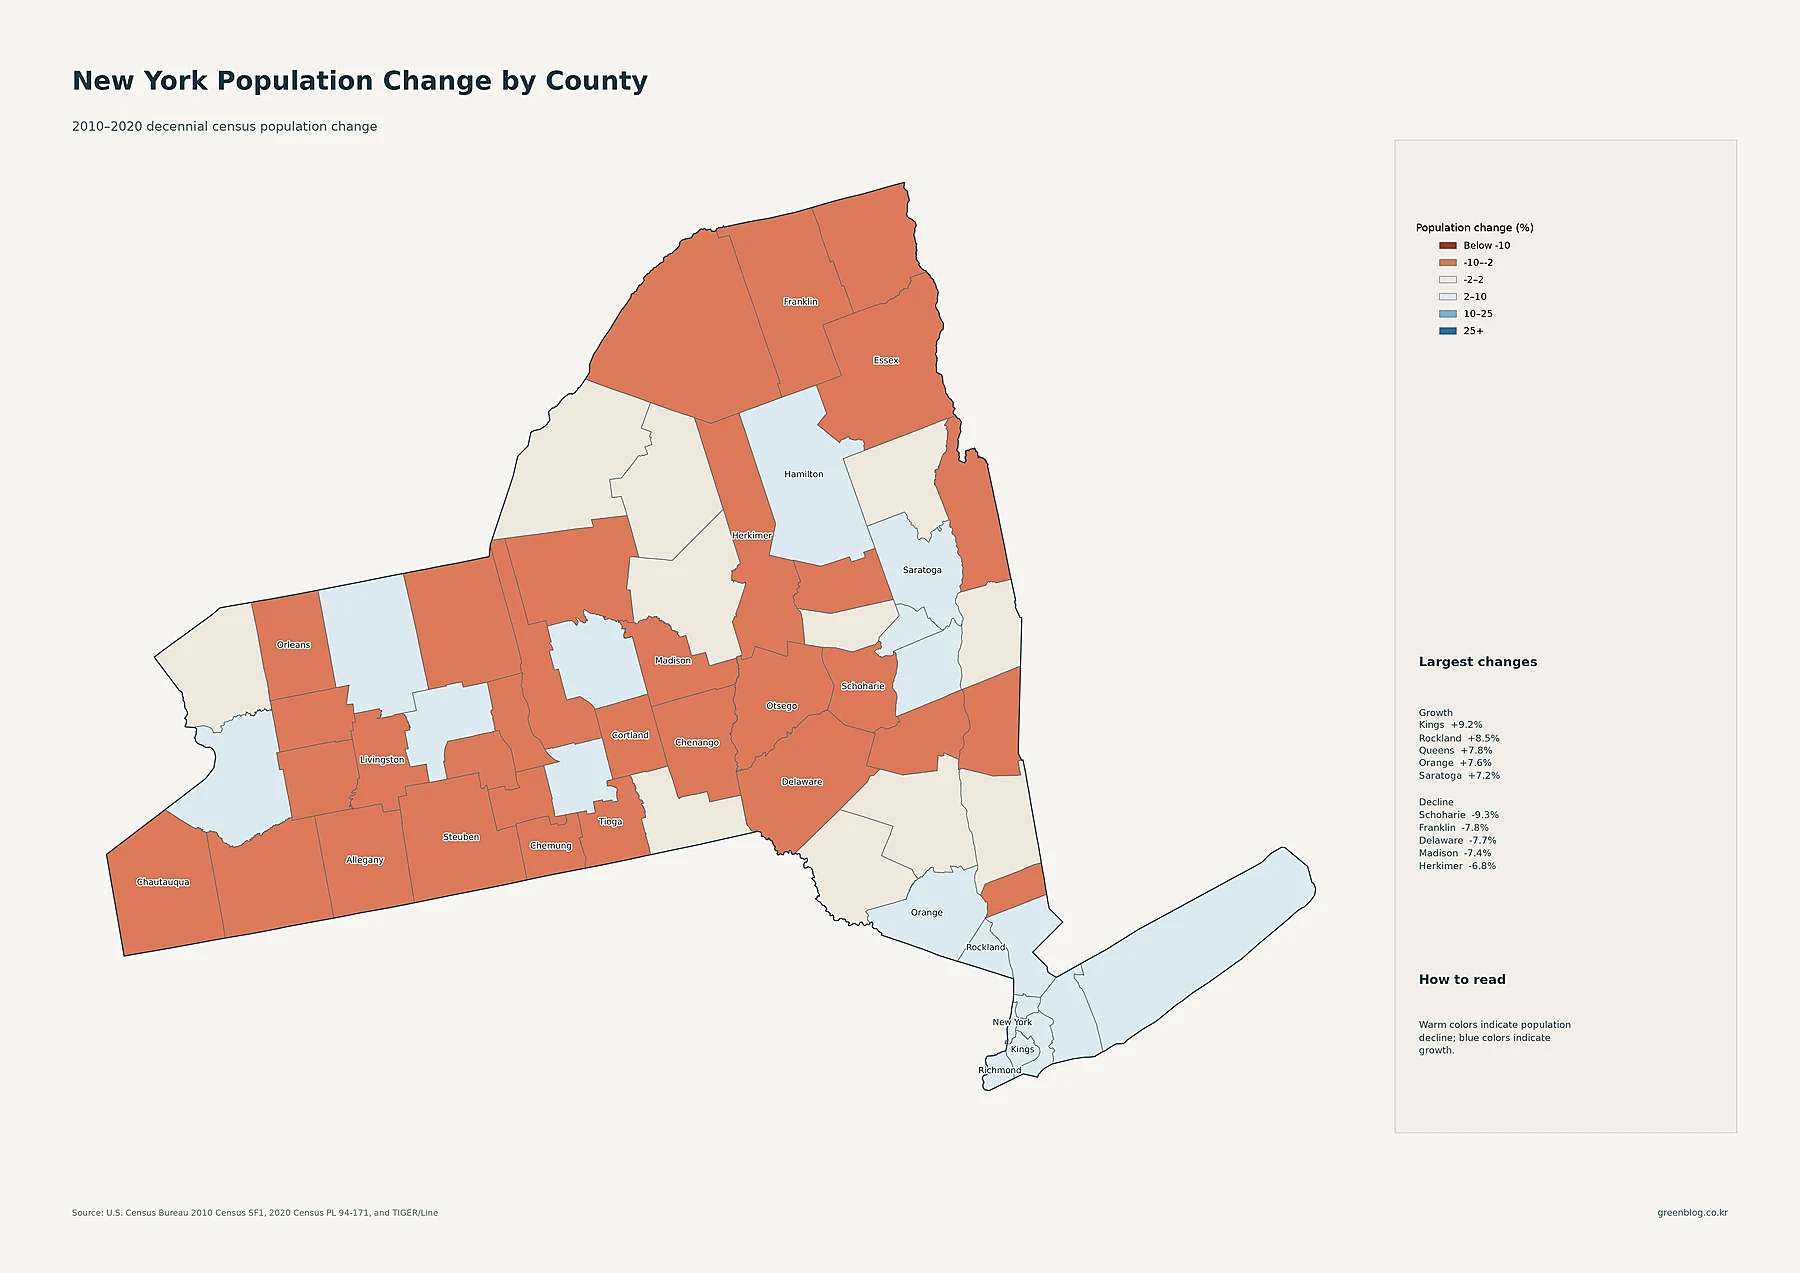
Kings County recorded the strongest percentage growth in the supplied decade data, rising from 2,504,700 residents in 2010 to 2,736,074 in 2020, or about 9.2%. Rockland County grew 8.5%, Queens 7.8%, Orange 7.6%, and Saratoga 7.2%. New York County grew 6.8%, the Bronx 6.3%, Westchester 5.8%, and Richmond 5.8%. The map therefore shows growth not only across much of New York City but also in selected Hudson Valley and Capital Region counties.
Many upstate counties moved in the opposite direction. Schoharie County fell from 32,749 residents in 2010 to 29,714 in 2020, a decline of about 9.3%, the largest in the supplied data. Franklin declined 7.8%, Delaware 7.7%, Madison 7.4%, Herkimer 6.8%, Chenango 6.5%, and Otsego 6.0%. Warm colors appear across substantial parts of central, northern, and western New York. These percentages describe the 2010–2020 census decade and should not be presented as change through the 2024 ACS estimate.
New York’s population geography is best understood as a dense metropolitan extreme plus separate upstate urban islands
The strongest lesson from the map set is the scale of the internal contrast. New York County’s average density is more than 170 times the statewide average, while Hamilton County averages only about three people per square mile. Kings has the largest county population, New York County has the highest county density, and the New York census place contains about 8.48 million residents. Those are three different measures and three different geographic concepts even though all are tied to the same metropolitan region.
Upstate New York adds another layer to the story. Buffalo, Rochester, Syracuse, Albany, and several smaller cities form recognizable density clusters, and counties such as Erie, Monroe, Onondaga, and Albany carry substantial populations. Yet the distance between those centers is filled by much lower-density counties, especially toward the North Country and Adirondacks. Reading the tract pattern, place totals, county totals, county density, and 2010s population change separately provides a much more accurate picture of where New Yorkers live and how the state’s settlement pattern differs from one region to another.
Download the New York population map collection
The ZIP includes detailed census-tract density, major cities and urban areas, county population totals, 2010–2020 county population change, and county population density.
FAQ
Which New York county has the largest population?
Kings County, corresponding to Brooklyn, has the largest population in the supplied 2024 ACS 5-year estimates at 2,631,580. Queens County is second at 2,323,052.
Which New York county has the highest population density?
New York County, corresponding to Manhattan, has the highest county-average density at about 71,916 people per square mile. Kings is about 37,932 and the Bronx about 33,307.
Which New York county grew fastest from 2010 to 2020?
Kings County grew about 9.2%, followed by Rockland at 8.5% and Queens at 7.8%. These figures compare the 2010 and 2020 decennial censuses.
Related Maps
Sources
- U.S. Census Bureau — American Community Survey (ACS): 2024 5-year population and density estimates
- U.S. Census Bureau — TIGER/Line Shapefiles: 2024 state, county, census tract, census place geography and mapped boundaries
- U.S. Census Bureau — Decennial Census: 2010 and 2020 county population comparison
Green Map creates custom-edited map images using open geographic data sources such as geoBoundaries, Natural Earth, OpenStreetMap, and government open data. These maps are edited visual materials, not raw data files, and are provided for education, documents, presentations, and graphic reference.