A New Jersey map has to fit 21 counties into a narrow north-to-south frame while preserving a highly detailed coastline. The supplied collection does this in three styles: a labeled color map, a labeled black-and-white map, and an unlabeled county-boundary map. The published previews measure 1200 × 1974 or 1200 × 1975 pixels and share the same county geometry.
The state’s county pattern is compact in the northeast, broadens through the central section, and opens into larger southern coastal and Delaware Bay counties. New York, Pennsylvania, and Delaware are labeled outside the state, while Delaware Bay and the Atlantic Ocean provide water context. Roads, railways, cities, terrain, a scale bar, coordinates, and a north arrow are not included.
One visible error must be understood before using either labeled New Jersey map. The county between Essex, Hudson, Middlesex, Somerset, and Morris is Union County, but the artwork labels that polygon “Elizabeth.” Elizabeth is a city in Union County, not the county name. The outline version keeps the boundary without the incorrect text and is therefore the safer base for a corrected labeling exercise.
Table of Contents
New Jersey Map Collection Overview
New Jersey officially has 21 counties: Atlantic, Bergen, Burlington, Camden, Cape May, Cumberland, Essex, Gloucester, Hudson, Hunterdon, Mercer, Middlesex, Monmouth, Morris, Ocean, Passaic, Salem, Somerset, Sussex, Union, and Warren. The color and monochrome images contain 21 county polygons, but Union is the one county whose correct name is absent because “Elizabeth” appears in its place.
The northern end begins with Sussex, Passaic, and Bergen. Warren lies along the Pennsylvania side, Morris fills much of the north-central interior, and Essex and Hudson sit near the northeastern edge. Hunterdon, Somerset, Union, and Middlesex form the next band south. Their shapes make the transition from the densely divided north to the wider central counties easy to follow.
Mercer occupies the west-central bend, with Monmouth on the Atlantic side and Burlington extending through a large portion of the interior. Ocean forms a long coastal county, while Camden and Gloucester sit along the southwestern side. Atlantic, Cumberland, Salem, and Cape May complete the southern section around the lower coast and Delaware Bay.
Trenton, Newark, Jersey City, Paterson, and Atlantic City are not plotted. Trenton is in Mercer County, but the images do not mark the capital or any county seat. The word “Elizabeth” should not be interpreted as a city point either: it is placed and styled like a county label inside the Union County polygon, which is precisely why the correction matters.
- Color version: pastel county fills, county labels, neighboring-state labels, and two water labels.
- Black-and-white version: the same labels and boundaries without county fill colors.
- Blank version: county boundaries and surrounding geographic shapes without county or neighbor labels.
Color-Coded County Layout on a New Jersey map
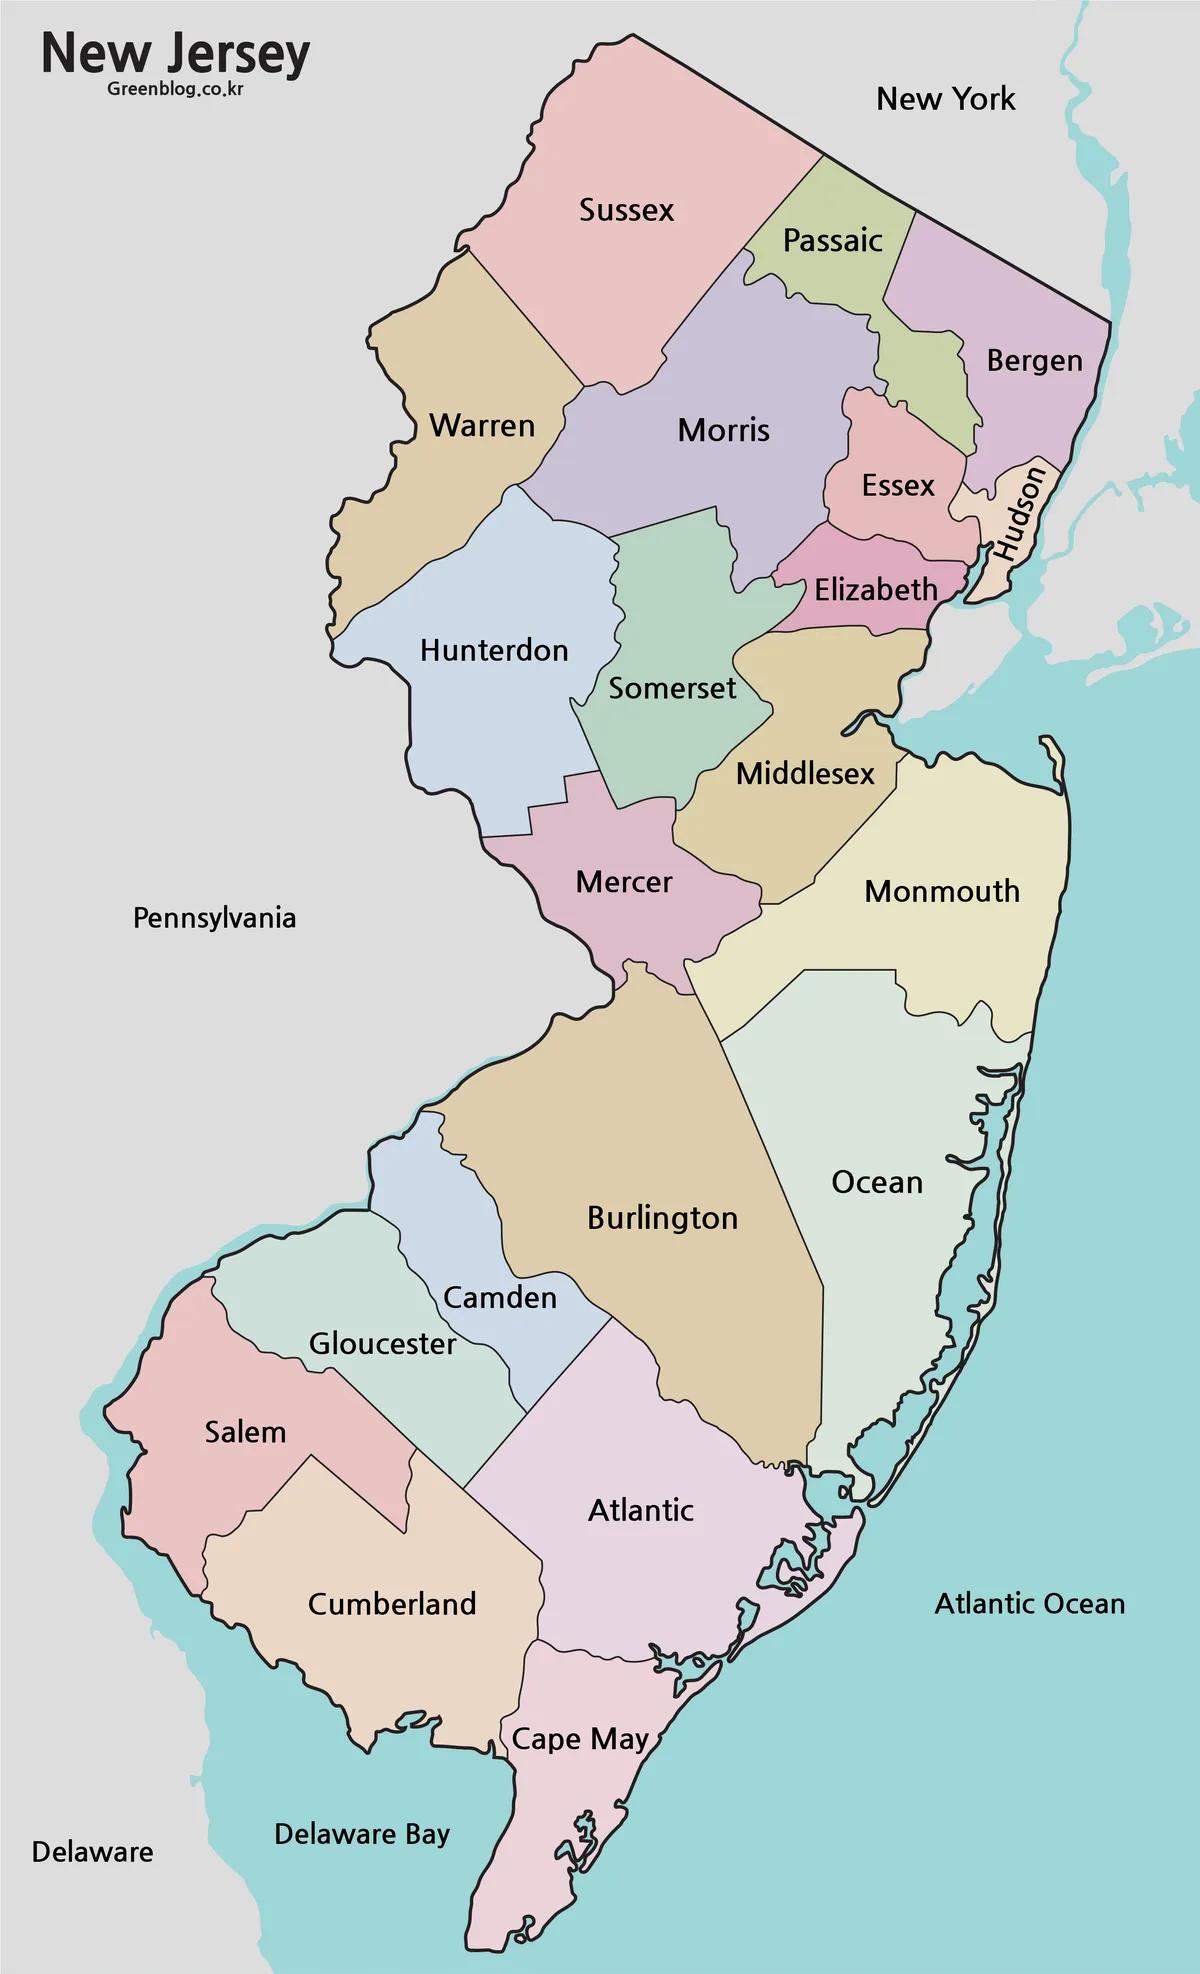
The color New Jersey map uses separate pastel fills to distinguish adjacent counties. These colors are categorical only. They do not encode population, elevation, land use, election results, transportation access, or any other measured variable. Larger polygons such as Burlington and Ocean are visually prominent because of their shapes and areas, not because their colors represent higher values.
The palette is especially helpful in the northeast, where Bergen, Passaic, Hudson, Essex, Morris, and Union meet within a small portion of the page. In the center, the contrast separates Middlesex, Mercer, Monmouth, Burlington, and Ocean. Along the south, it makes the shared borders among Salem, Gloucester, Camden, Cumberland, Atlantic, and Cape May easier to trace.
Water is shown in cyan along the eastern and southern edges. The Atlantic Ocean and Delaware Bay are named, but the Delaware River and New York Harbor are not labeled. The coastline contains useful bays, inlets, and barrier-island shapes, yet the image has no scale or hydrographic legend. It should orient a discussion rather than support shoreline measurement.
Before showing the color version in class or a presentation, cover or correct the “Elizabeth” label and replace it with “Union.” A small note can explain that Elizabeth is a city within Union County. This turns a production mistake into a useful distinction between county geography and municipal geography without allowing the error to become part of the lesson.
Black and White Printable Version
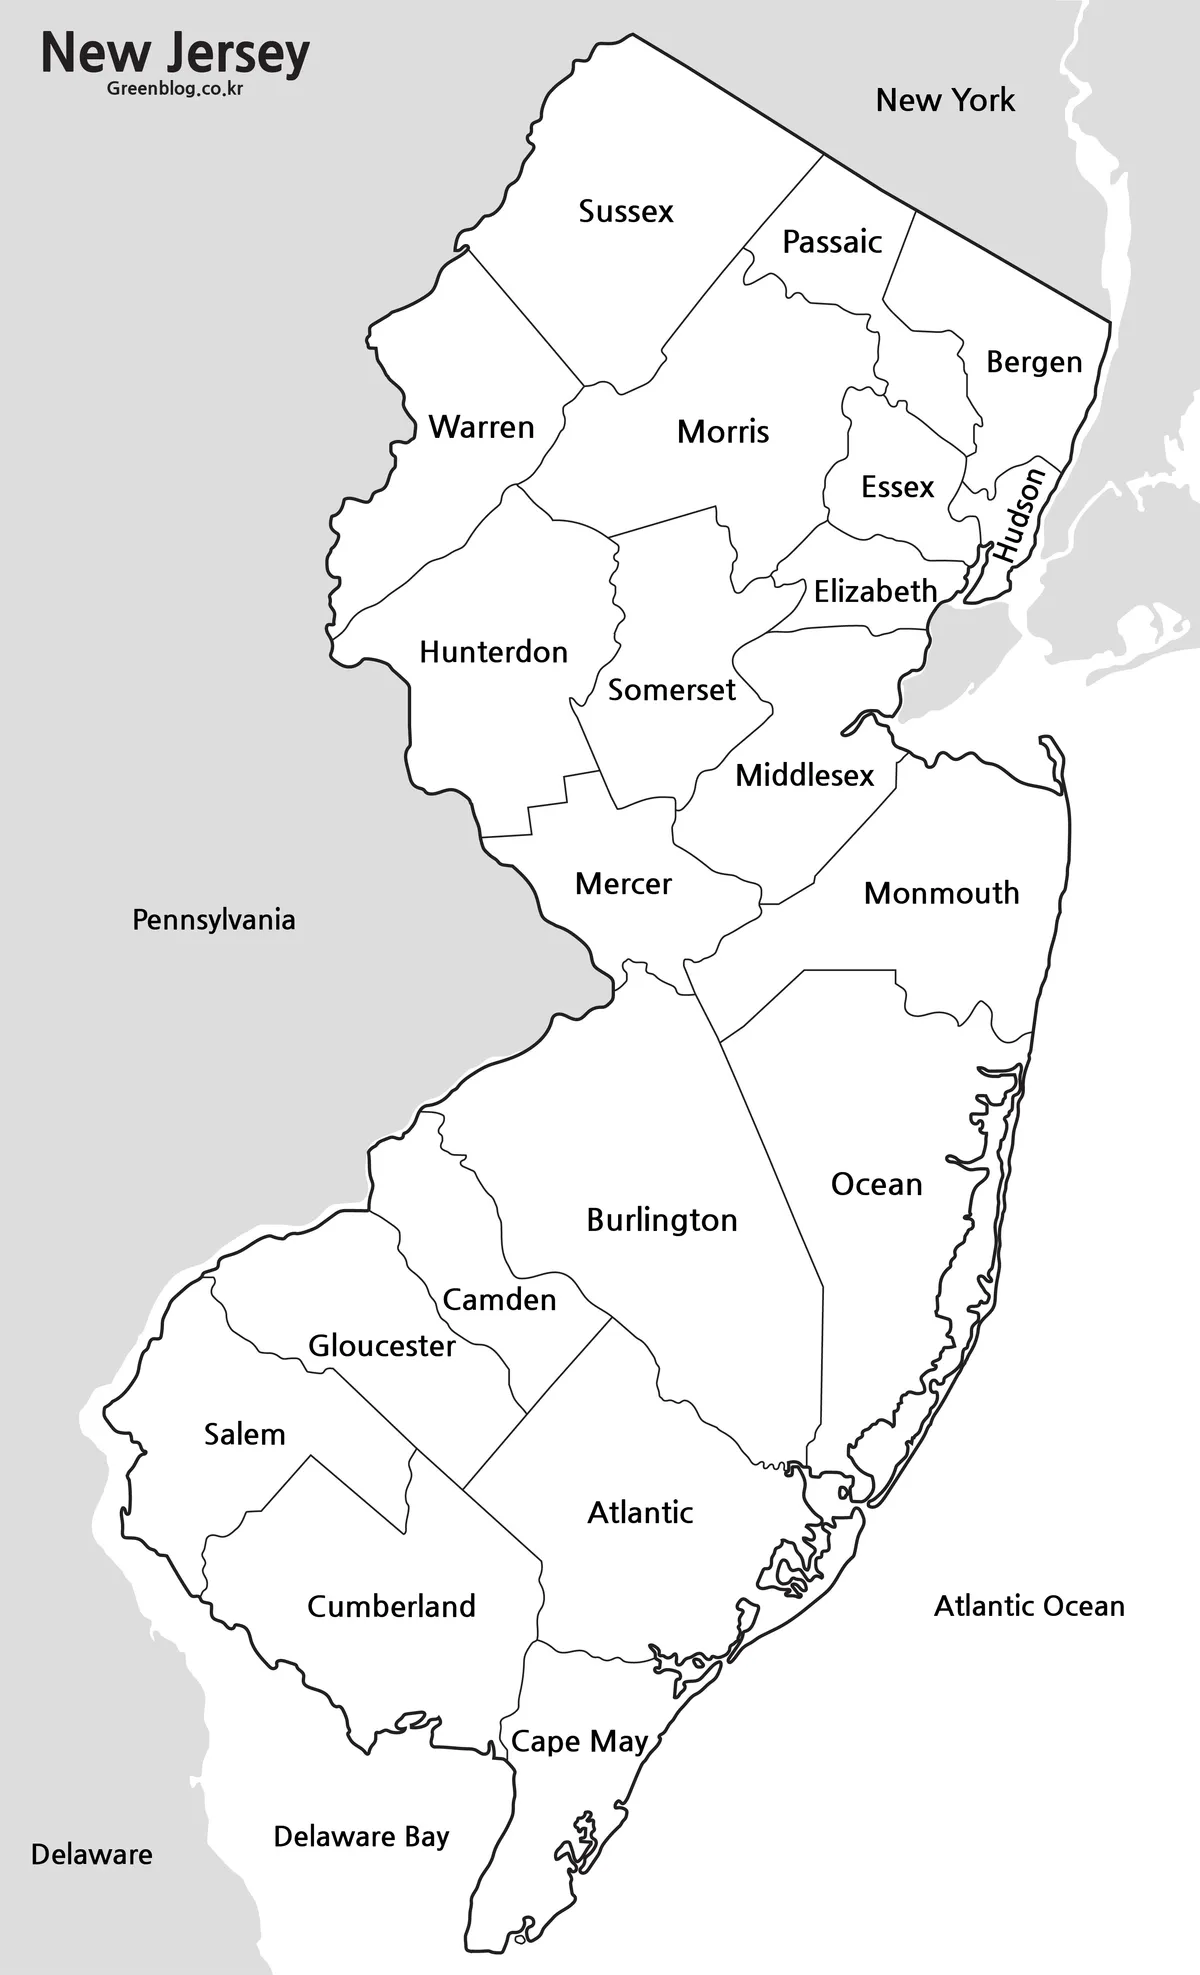
The black-and-white New Jersey map preserves the county lines, county text, surrounding-state names, Delaware Bay label, and Atlantic Ocean label. Removing the pastel fills shifts attention to the boundary network and makes the page suitable for grayscale reports, answer sheets, and photocopies. It is still a labeled reference, not a blank worksheet.
Label placement is generally spacious because the portrait frame gives the state room to extend vertically. Hudson is rotated inside its narrow northeastern polygon, while Cape May fits near the southern tip. The same Union County error remains: “Elizabeth” occupies the polygon where “Union” should appear. Correct that word before treating the map as an answer key.
A test print is still necessary. The published preview’s ratio is close to the protected A3-oriented source described in the FAQ, but reducing it to a small page can make the narrow northeastern boundaries harder to distinguish. Preserve the image’s portrait ratio, avoid stretching, and use a full-width placement when county spelling is part of the task.
Blank Outline Map for Editing
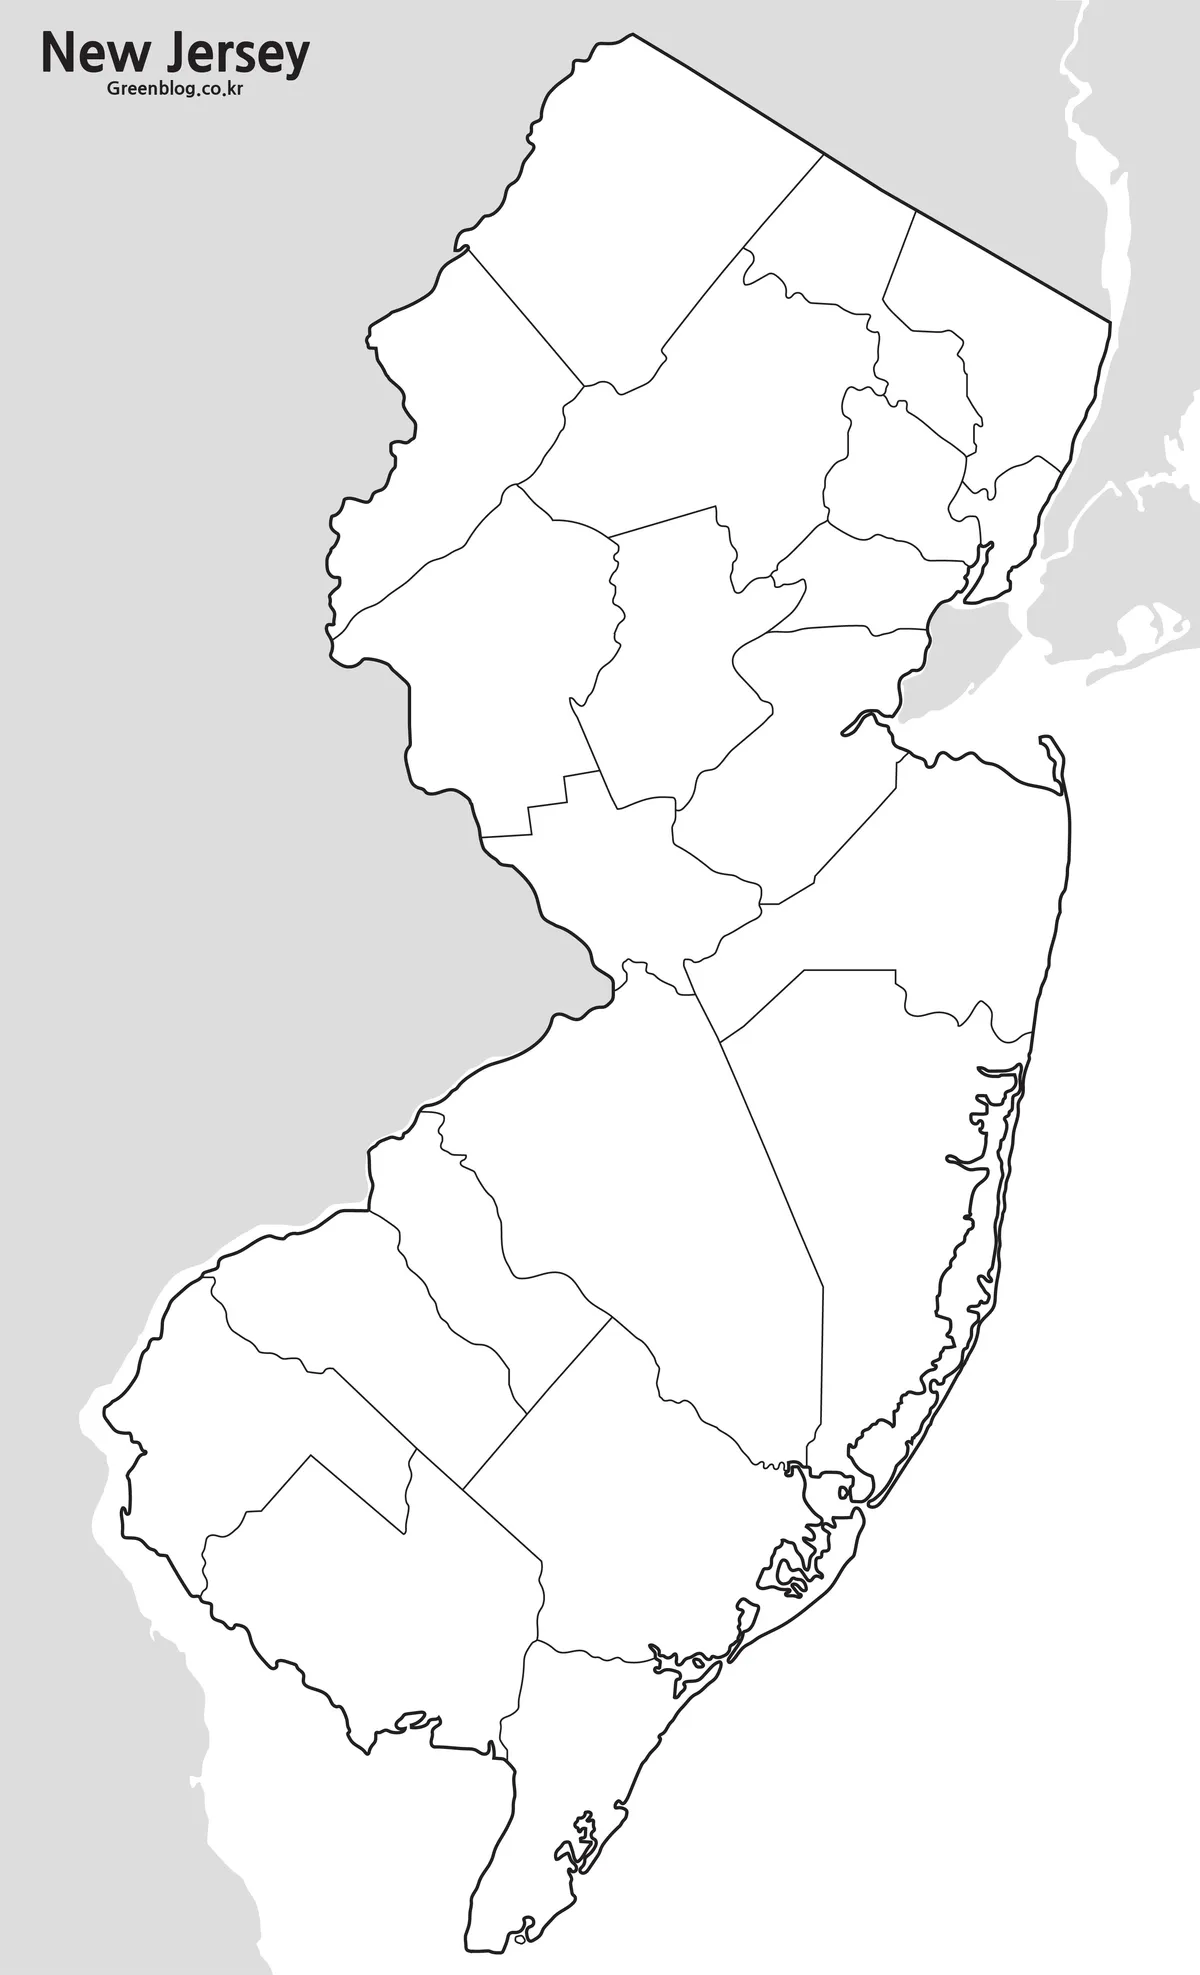
The blank New Jersey map removes all county names, neighboring-state text, and water labels while preserving the state outline, internal county boundaries, and surrounding coastal shapes. It is therefore the best of the three previews for a corrected county-labeling task. Students can supply “Union” in the proper polygon instead of inheriting the error from the labeled versions.
The outline is also useful for sequential study. Begin with Sussex at the top, identify Bergen and Hudson on the northeastern edge, move through the central Mercer–Middlesex–Monmouth band, and finish with Atlantic, Cumberland, and Cape May in the south. The distinctive Burlington and Ocean shapes provide additional anchors when no text is present.
There is a second visible production issue in this version: the upper title is cropped, leaving only part of “New Jersey” and clipped site text. For a polished slide or handout, crop away the incomplete header or add a new title in a separate text layer. Keep the state and county lines unchanged when making that correction.
For thematic shading, attach every color to a verified county-level value from the same source and date. Add a legend, state the unit, explain missing values, and do not mix counties with municipalities. Elizabeth, Newark, Jersey City, Trenton, and Atlantic City are places within counties; they should be plotted as city points only after their coordinates are checked elsewhere.
Designed for Printing, Slides, and Regional Comparison
Choose a New Jersey map version according to the reader’s job. Use color for quick county separation, monochrome for a corrected labeled reference, and outline for recall or custom data. A presentation can show the complete state first, enlarge the northeast or southwest on a duplicate slide, and then return to the statewide frame so viewers retain geographic context.
The protected FAQ identifies the downloadable files as 3016 × 4962 pixels and prepared for A3-oriented use. The three body previews are smaller web images, so their dimensions should not be presented as the archive’s complete technical specification. Print from the downloaded source when maximum label clarity is required, and keep an untouched copy before editing.
These graphics are not transportation or navigation maps. They omit highways, rail lines, ferry routes, travel times, municipal boundaries, and street networks. They also lack elevation, land cover, rivers, county seats, and a projection statement. Pair them with an official state map whenever a project depends on current routes, precise location, distance, or legal boundary analysis.
Practical Ways to Use the Maps
A New Jersey map can support a three-stage classroom exercise. First, use the corrected color map to recognize county groups. Second, review names on the corrected monochrome version. Third, label the outline from memory. Ask learners to explain why “Elizabeth” belongs as a city name within Union County rather than as one of the state’s 21 county names.
For regional comparison, divide the state into broad reading zones rather than presenting them as official regions. The north emphasizes Sussex, Passaic, Bergen, Warren, Morris, Essex, Hudson, and Union; the center connects Hunterdon, Somerset, Middlesex, Mercer, Monmouth, Burlington, and Ocean; the south includes Camden, Gloucester, Salem, Atlantic, Cumberland, and Cape May.
When a New Jersey map becomes a data graphic, verify the county list before importing values. The dataset should contain Union County and must not create a fictional Elizabeth County. Match values by a stable county identifier when possible, check that all 21 counties are present exactly once, and review the legend in grayscale before publishing.
Frequently Asked Questions
Can I print the New Jersey map on a standard printer?
Yes. The black and white version is designed to keep boundaries and labels clear on ordinary printers. The A3 layout can also be scaled to smaller paper sizes when needed.
Which version is best for a classroom worksheet?
The black and white map works well as a reference sheet. Choose the outline version for county labeling, coloring, and annotation exercises.
Can I add my own routes or regional data?
Yes. The outline map provides a clean base for travel paths, city markers, population shading, tourism points, and presentation highlights.
Will the labels and lines remain clear when enlarged?
The files were prepared at 3016 × 4962 pixels for A3-oriented use, helping boundaries and labels remain readable in typical print and presentation projects.
Map File Information
This download contains color, black-and-white, and blank county-boundary maps for printing, lessons, presentations, and custom annotation.
- Included Versions: Color labeled map, black-and-white labeled map, blank county-boundary map
- Printable Size: A3 portrait layout
- File Type: Image files in a ZIP archive
- Intended Use: County reference, worksheets, presentation graphics, and data annotation
Related Maps
Additional Resources
- NJDOT County Maps — check the official 21-county list and open county-level transportation reference maps.
Green Map creates custom-edited map images using open geographic data sources such as geoBoundaries, Natural Earth, OpenStreetMap, and government open data.
These maps are edited visual materials, not raw data files, and are provided for education, documents, presentations, and graphic reference.