A Pennsylvania map must organize 67 counties across a state that is much wider than it is tall. The supplied images make that structure readable by combining a broad landscape frame with three levels of detail: a labeled color version, a labeled black-and-white version, and an unlabeled county-boundary version. All three previews measure 1200 × 783 pixels and use the same county geometry.
The labeled maps are most useful for seeing how Pennsylvania changes from the Lake Erie corner in the northwest to the narrow southeastern end around Philadelphia and Delaware counties. Large north-central counties contrast with compact counties in the Lehigh Valley and Philadelphia area. The outline version retains those differences while removing names and fills for exercises, annotations, or county-level data.
Each labeled Pennsylvania map names every county and shows New York, New Jersey, Maryland, and Delaware around part of the state boundary. Ohio and West Virginia are not labeled, and neither Lake Erie nor the Delaware River appears by name. The graphics also omit cities, roads, rivers, terrain, a scale bar, coordinates, and a north arrow, so they should be read as county-reference maps rather than navigation maps.
Table of Contents
Pennsylvania Map Overview
Pennsylvania has 67 counties. The official Census geographic guide also notes that Philadelphia County and the City of Philadelphia are governmentally consolidated, while the other counties have county governments. That distinction is not symbolized on these images: Philadelphia receives the same type of county boundary and label as the rest of the set.
The state outline has several useful visual anchors. Erie County projects northward at the western end of the otherwise straight northern border. The irregular eastern edge runs beside Wayne, Pike, Monroe, Northampton, Bucks, and Philadelphia counties. Along the south, the county sequence extends from Greene in the southwest through the central border counties to Delaware and Philadelphia in the southeast.
Harrisburg, Pittsburgh, Philadelphia, and Erie are not plotted. For external orientation, Harrisburg is in Dauphin County, Pittsburgh is in Allegheny County, Philadelphia is consolidated with Philadelphia County, and Erie is in Erie County. These associations can help a teacher or presenter add city markers, but the marker positions should be checked against a current authoritative map before publication.
County Layout and Regional Structure
The northwest begins with Erie, Crawford, Warren, McKean, Potter, and the smaller counties immediately below them. Farther south, the western edge includes Mercer, Lawrence, Beaver, Washington, and Greene. Allegheny lies inland from that edge, surrounded by Beaver, Butler, Armstrong, Westmoreland, and Washington, which makes the Pittsburgh-area county pattern easy to locate even without a city symbol.
Across the center, Clearfield, Centre, Clinton, Lycoming, and Huntingdon create a recognizable band of larger or elongated polygons. Centre is spelled with the official British-style ending shown on the map. Narrower counties such as Mifflin, Juniata, and Perry link that central band to the Susquehanna Valley area, while tiny Montour requires a rotated label in the two named versions.
The northeast contains Susquehanna, Wayne, Pike, Monroe, Lackawanna, Luzerne, Wyoming, Sullivan, Bradford, and nearby counties. In the southeast, Bucks, Montgomery, Chester, Delaware, and Philadelphia form a compact cluster. Several long names wrap across two lines—Northumberland and Northampton are the clearest examples—so readers should enlarge the image before using it as a spelling reference.
Color Pennsylvania map for County Comparison
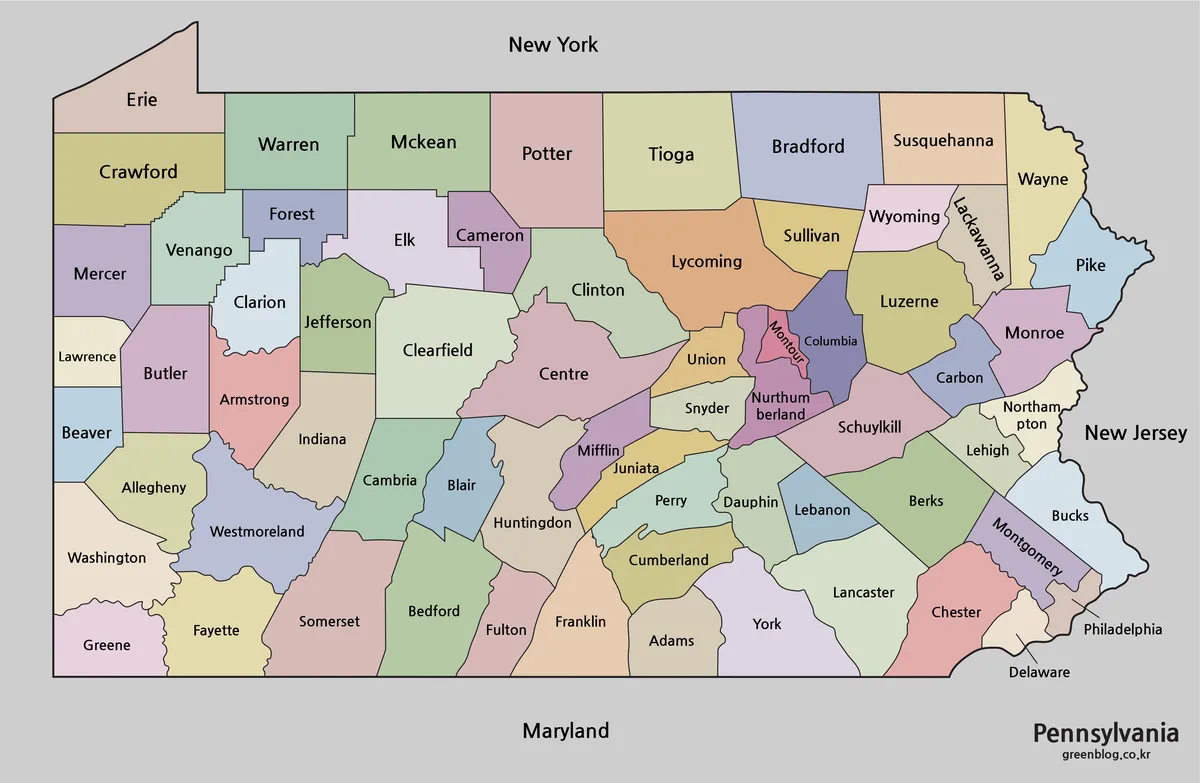
The color version assigns a different pastel fill to adjacent counties, allowing neighboring shapes to be separated quickly. The palette is categorical: it does not represent population, elevation, voting, land use, income, or any other measured value. A county’s color therefore carries no ranking, and the map should not be interpreted as a thematic dataset without a new legend.
Use the color Pennsylvania map when the first task is visual orientation. A class can trace the northern row from Erie toward Susquehanna and Wayne, compare the central Centre–Clinton–Lycoming area, and then study the tighter southeastern cluster. The colors help maintain county separation where labels, diagonal borders, and irregular river-shaped edges make monochrome scanning slower.
Neighboring areas are shown in gray rather than county colors. New York is labeled above the state, New Jersey appears to the east, Maryland sits below the central southern border, and Delaware is identified beneath the southeastern corner. Because Ohio and West Virginia are absent from the surrounding labels, this is not a complete state-neighbor diagram.
Black and White Pennsylvania Map for Printing
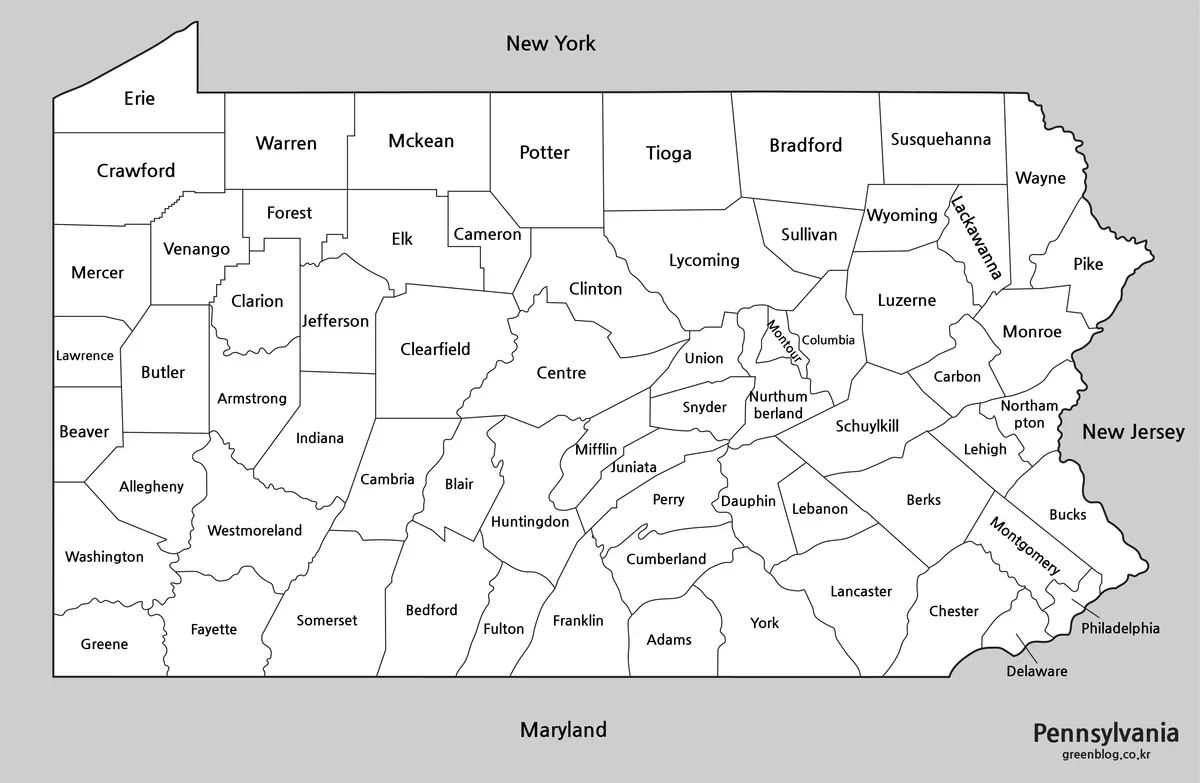
The black-and-white Pennsylvania map keeps all 67 county names, the four visible neighboring-area labels, and the same internal boundaries as the color version. Removing the pastel fills puts more emphasis on line work and text. It is a practical choice for photocopies, grayscale reports, answer keys, and handouts that must remain legible without color.
This is still a labeled reference sheet, not a blank worksheet. Students can use it to check answers after labeling the outline version, follow a spoken county sequence, or compare spelling. Small and narrow counties deserve extra space: Montour uses angled text, Northumberland wraps, and the Philadelphia and Delaware labels sit close to the southeastern edge.
For printing, preserve the 1200:783 landscape ratio instead of stretching the image to fill a portrait box. A test print should confirm that the smallest labels remain readable at the chosen size. If the map is reduced for a two-column report, placing a larger copy on a separate page may be more useful than sharpening already-small text.
Outline Pennsylvania Map for Custom Projects
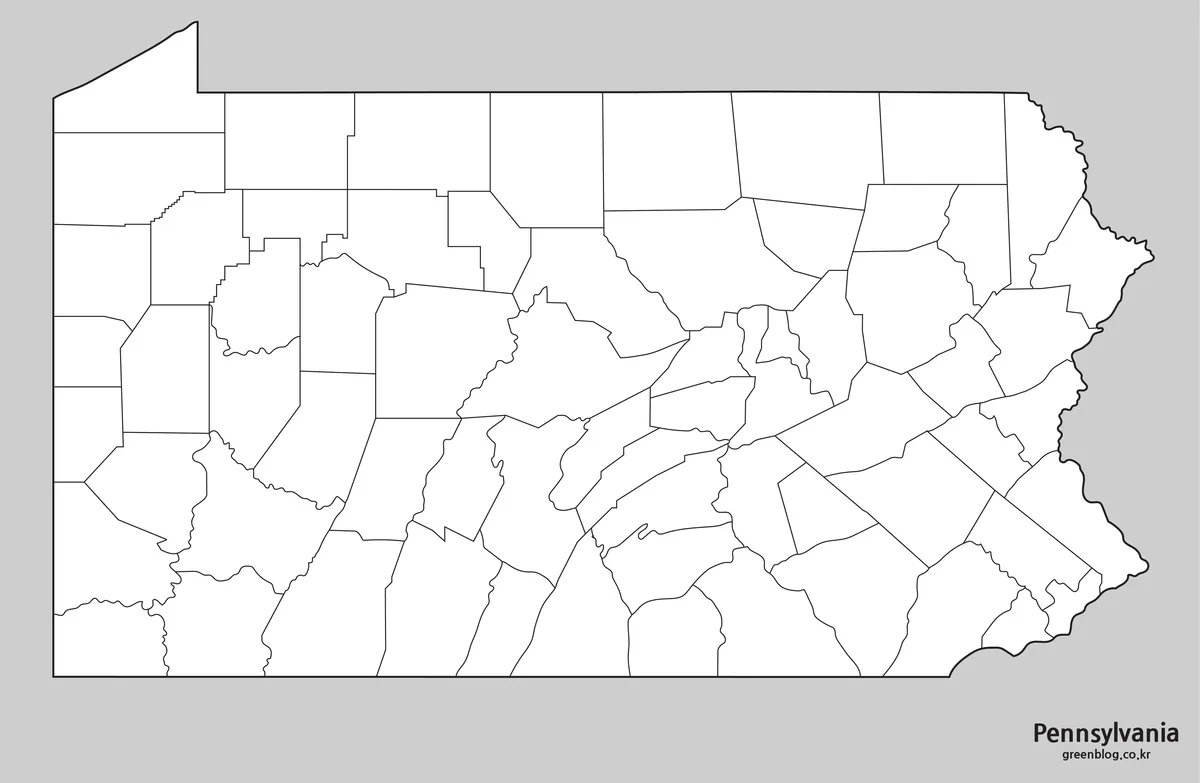
The outline version removes county names, state-neighbor names, and colored fills while preserving the outer state shape and all internal county lines. It is not a plain silhouette. The gray surrounding field and the Pennsylvania title remain, but the white county areas provide space for handwritten labels, custom colors, numbered questions, or data-driven shading.
A blank Pennsylvania map works well for a staged labeling exercise. Learners can begin with the distinctive Erie projection, identify the western edge, place Centre in the middle, locate the northeast corner counties, and finish with the compact Philadelphia-area group. The labeled black-and-white image can then serve as an answer key using identical geometry.
For a choropleth, every fill should correspond to a verified county-level value from the same date and source. Add a legend, define missing data, and avoid mixing county figures with city or municipal figures. Philadelphia requires particular care because city and county geography are consolidated, while the other counties follow a different governmental arrangement.
Prepared for Print and Presentation Work
Before placing a Pennsylvania map in a slide or document, choose the version according to the reader’s task. Color supports rapid separation, monochrome supports labeled printing, and outline supports participation or custom data. Keeping these roles distinct prevents a worksheet from arriving already answered and prevents a presentation from depending on faint boundary lines alone.
The images contain no scale or projection information, so they are unsuitable for measuring distance or area. They also do not confirm route locations, travel times, county seats, municipal boundaries, or physical relief. If a project requires those subjects, use the county graphic as an overview and pair it with an official transportation, municipal, or geographic source.
The protected download is a ZIP archive containing the map set. The previews confirm three raster map styles and their visible dimensions, but they do not establish every internal file extension. Keep an untouched copy before editing, preserve the original aspect ratio, and export a separate final version for print so annotations do not overwrite the source image.
Practical Ways to Use the Maps
A Pennsylvania map can structure a classroom sequence without adding unsupported detail. Start with county recognition on the color version, move to name review on the monochrome version, and finish with recall on the outline. Students can group counties by broad west, central, northeast, and southeast positions while remembering that these classroom groups are not official administrative regions.
Presentation designers can use the same progression. Show the complete state first, highlight one county or cluster on a duplicate slide, and return to the full map before changing topics. This keeps Allegheny, Dauphin, Erie, and Philadelphia counties connected to the statewide frame even when a discussion focuses on one metropolitan area or corridor.
When a Pennsylvania map is used for statistics, the map date and data date should be stated separately. County boundaries may provide the spatial frame, but the values can change annually or more often. Cite the dataset, explain the unit, test the legend in grayscale, and verify that long labels do not collide with added symbols.
Frequently Asked Questions
Can I print the Pennsylvania map in A3 size?
Yes. The collection was prepared for A3 printing and works well for classroom displays, presentation boards, and large reference sheets.
Does the map include every Pennsylvania county?
Yes. The county versions include all 67 counties, including Centre, Philadelphia, Allegheny, Erie, Clinton, and Clearfield.
Which version works best for school worksheets?
The black and white version is suitable for standard handouts. Choose the outline version when students need to add names, colors, county seats, or regional notes.
Can I customize the outline map?
Yes. The clean boundary layout provides space for routes, labels, statistics, highlighted counties, and infographic elements.
Map File Information
This download contains color, black-and-white, and blank-outline county maps for printing, lessons, presentations, and custom annotation.
- Included Versions: Color labeled map, black-and-white labeled map, blank county-boundary map
- Printable Size: A3 landscape layout
- File Type: Image files in a ZIP archive
- Intended Use: County reference, classroom worksheets, presentation graphics, and data annotation
Related Maps
Additional Resources
- PennDOT Maps — consult the Commonwealth’s map library for statewide, county, municipal, transportation, and historical reference maps.
Green Map creates custom-edited map images using open geographic data sources such as geoBoundaries, Natural Earth, OpenStreetMap, and government open data.
These maps are edited visual materials, not raw data files, and are provided for education, documents, presentations, and graphic reference.