A Maryland map becomes much easier to read once Chesapeake Bay is treated as the center of the state’s layout rather than as empty space. The bay separates the Eastern Shore from central Maryland, divides long coastal counties with branching inlets, and narrows the land connections between the state’s western, central, and eastern sections. Maryland’s far western panhandle then extends in the opposite direction as a thin horizontal chain.
This collection contains three matching 1200 × 702 WebP images: a pastel county map, a labeled black and white map, and an unlabeled county outline. The wide frame preserves Garrett County in the west, Worcester County along the Atlantic side, and the full bay coastline between them. All three images use the same geometry, allowing one version to replace another without changing a slide or document layout.
The labeled Maryland map names all 23 counties. It also outlines the small independent Baltimore City jurisdiction inside the Baltimore County area, although the city does not receive its own text label in the preview. Maryland therefore has 24 main county-level jurisdictions for administrative comparison: 23 counties plus Baltimore City, which is legally separate from Baltimore County.
The images show county boundaries, Chesapeake Bay and coastal water, and neighboring labels for Virginia, Delaware, and New Jersey. They do not show roads, city markers, the state capital, terrain, or live navigation information. Pennsylvania and West Virginia are part of Maryland’s actual border context, but their names are not printed in these previews. That distinction keeps the article aligned with what the files visibly provide.
Table of Contents
Why Maryland’s Shape Needs a County Map
The Maryland map has three visual systems competing for attention. Garrett, Allegany, and Washington counties create the narrow western extension. Counties around Baltimore and Washington form a dense central cluster. East of Chesapeake Bay, the Eastern Shore continues south between Delaware and the bay before reaching the Atlantic-facing edge of Worcester County.
A plain state silhouette can show the horizontal outline but cannot explain why the central and eastern areas appear so fragmented. County lines reveal the inland stack along the Pennsylvania side, the narrow peninsulas around the bay, and the Eastern Shore’s north-to-south sequence. The water is therefore part of the administrative reading, not merely a background color.
Two unlabeled federal or independent spaces require care. Washington, D.C. creates the indentation between Montgomery and Prince George’s counties, while Baltimore City appears as a compact separate outline within the Baltimore County area near the bay. Neither should be counted as an unnamed Maryland county. Baltimore City is a county-level jurisdiction; Washington, D.C. is not part of Maryland.
The landscape orientation is necessary for this geography. Enlarging only the central section would make small boundaries easier to read but would remove the relationship between the panhandle and Eastern Shore. The supplied frame keeps the entire state together, using larger type for open areas and rotated names where narrow coastal counties offer little horizontal room.
Color-Coded Maryland County Map
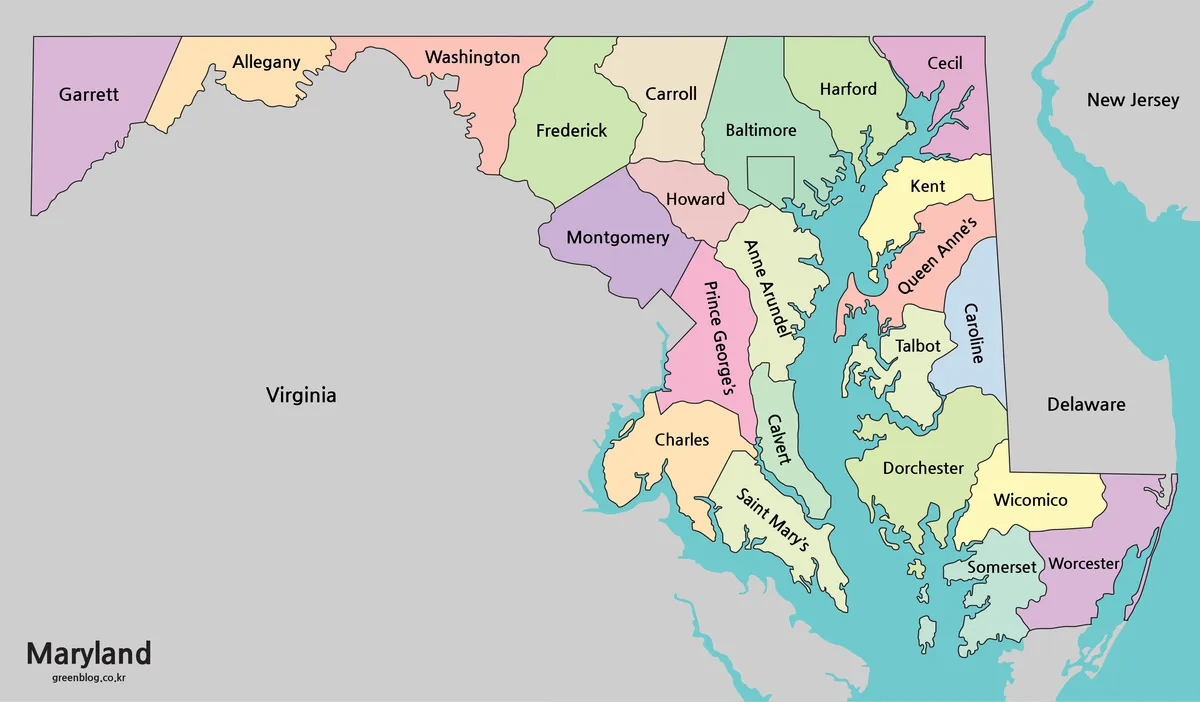
The color Maryland map assigns contrasting pale fills to neighboring counties while keeping the bay and Atlantic-side water blue. This is most useful in the central and eastern sections, where narrow coastlines and small shared borders can be difficult to follow in one color. The gray surroundings keep Virginia, Delaware, and New Jersey visually separate from Maryland.
Start in the west with Garrett, Allegany, and Washington. Move east through Frederick and Carroll before reaching Baltimore and Harford, with Cecil at the head of the bay. Howard and Montgomery sit below this northern line, and Prince George’s, Anne Arundel, Calvert, Charles, and St. Mary’s form the central and southern side around Washington and the western bay shore.
On the Eastern Shore, the labeled sequence includes Kent, Queen Anne’s, Caroline, Talbot, Dorchester, Wicomico, Somerset, and Worcester. Color helps distinguish these eight counties from one another and prevents the long, irregular bay edges from being mistaken for county borders. Rotated names fit the narrower north-south shapes without adding leader lines across the water.
This version works best for a first-look county explanation, a regional comparison slide, or a blog graphic that will remain large enough for the labels. If it must be reduced, check Prince George’s, Anne Arundel, Calvert, and the small counties near the upper bay first; those labels lose clarity sooner than names in the broad western counties.
Black and White Maryland Map for Printing
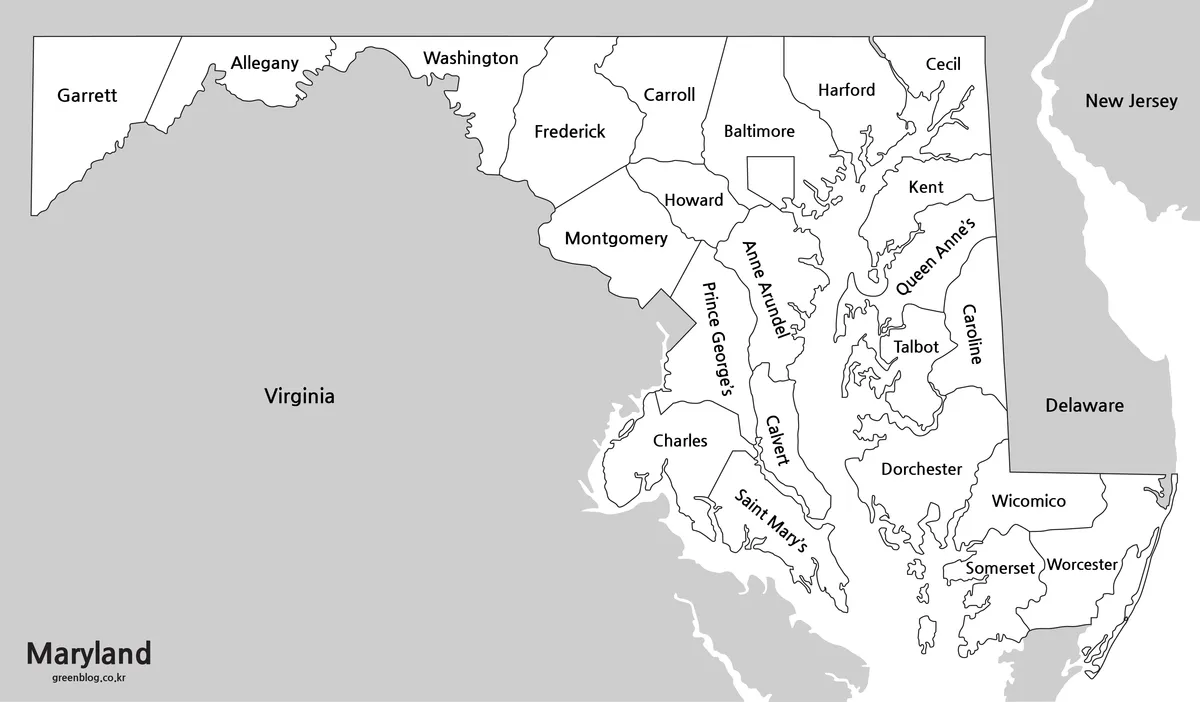
The black and white Maryland map retains the 23 county names and the contextual state labels while removing the pastel fills. Black lines define internal boundaries and coastlines, white identifies Maryland land, and gray separates surrounding land. The bay remains open white space bounded by the state’s complex shore.
Without color, label position becomes the main guide. This is effective for a reference sheet because every named county can be found without consulting a legend. It is less immediate when a reader wants to follow disconnected shoreline segments, so the color version should be used first when the bay-side arrangement is unfamiliar.
For printing, preserve the 1200 × 702 aspect ratio and preview the page before producing a large batch. A portrait page will shrink this wide image substantially; landscape placement gives the western extension and Eastern Shore more room. Wide margins, headers, or side notes can further reduce type size, especially around Anne Arundel, Calvert, Talbot, Somerset, and Worcester.
The white county areas also make handwritten marks easy to see. A teacher can circle the three western counties, shade the Eastern Shore, or ask students to identify the independent Baltimore City boundary. A report can add a small number of callouts without competing with background color.
Blank Maryland Outline Map for Custom Projects
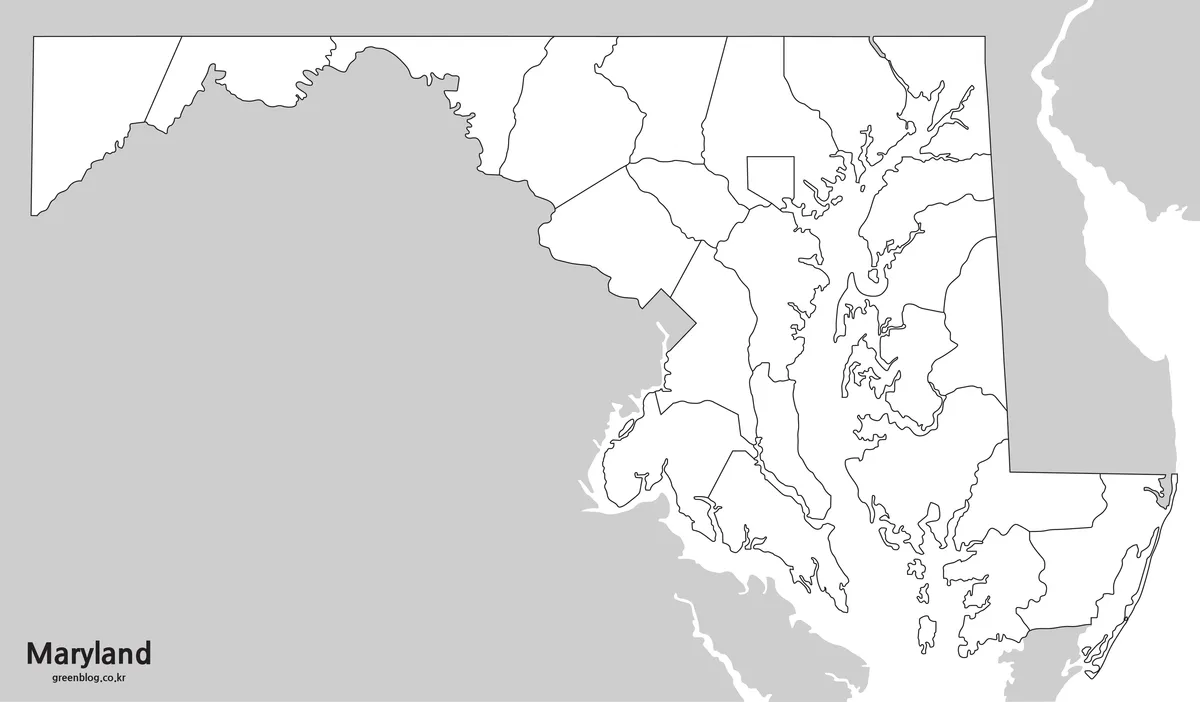
The outline Maryland map removes county and neighboring-state names as well as the pastel fills. It retains the county geometry, Chesapeake Bay shoreline, surrounding gray context, and the small independent jurisdiction shapes. The “Maryland” imprint remains at the lower left, so the graphic is an unlabeled administrative base rather than a completely text-free image.
For a county-identification worksheet, provide the 23 county names in a separate list and use the labeled map as an answer key. For a data graphic, apply one consistent scale, explain it in a legend, and decide whether Baltimore City should receive its own value. Treating it as part of Baltimore County would merge two separate county-level jurisdictions.
Route lines, city markers, and tourism symbols can be added, but they are external annotations. The base image does not contain a road network or point locations, and county borders should not be mistaken for travel routes. Data overlays should also avoid covering the narrow bay inlets that make Maryland’s coastal structure understandable.
- Color the western, central, southern, and Eastern Shore groups.
- Number all 24 county-level jurisdictions for a matching exercise.
- Add verified statistics by county and Baltimore City.
- Mark selected destinations using a separate location source.
- Compare Chesapeake Bay counties with inland counties.
Choosing the Right Maryland map
Use the color version when county separation must be understood quickly. It is the strongest choice for explaining how the bay divides the state, distinguishing adjacent Eastern Shore counties, or introducing the Baltimore–Washington side of Maryland without relying on a dense verbal description.
Choose black and white for a labeled handout, report, or answer sheet. It preserves every county name but uses less visual weight, leaving room for notes and callouts. Select the outline when the reader should supply the information or when a custom data layer needs to become the main visual element.
All three previews are raster WebP images at the same dimensions. They can be scaled and annotated in an image or page-layout editor, but the county lines are not independent vector objects. If individual polygons must be edited separately, these previews should be used as references rather than described as vector files.
Practical Uses for the Map Collection
A Maryland map can support county lessons, Mid-Atlantic regional comparisons, administrative reference sheets, presentations, and county-based data graphics. The labeled versions establish the county framework; the outline provides a controlled base for adding one new layer of information at a time.
In a classroom sequence, show the color image first, distribute the outline for identification, and use black and white as the answer sheet. In a presentation, begin with the complete state, then highlight the panhandle, central corridor, or Eastern Shore without cropping away the other regions. In a report, retain Chesapeake Bay because it explains the layout more effectively than county names alone.
When resizing, keep Garrett County at the far left and Worcester County at the far right. Cropping either end would remove a major geographic contrast. Avoid trimming the gray neighboring areas too tightly as well: the Virginia, Delaware, and New Jersey labels provide useful orientation even though the file is not a complete border-state map.
Frequently Asked Questions
How many county-level areas are shown on the Maryland map?
Maryland has 23 counties. Baltimore City is an independent county-level jurisdiction and is separate from Baltimore County.
Can the files be printed at A3 size?
Yes. The original images were prepared for an A3 layout at 4962×2902 pixels.
Which version works best for a classroom worksheet?
The black and white map is suitable for labeled reference sheets, while the outline version works better for coloring, labeling, and annotation activities.
Is the Maryland map suitable for editing?
The outline image provides a clean base for adding county colors, routes, statistics, markers, and infographic text.
Map File Information
This download contains the color, black and white, and outline versions displayed on the page.
- Included Files: Use only the versions confirmed in the article and supplied images
- File Type: Use the confirmed download contents
- Intended Use: Printing, education, presentations, and map-based projects
Additional Resources
- Maryland Manual: Counties — official state reference explaining the 23 counties and Baltimore City’s county-level status.
Related Maps
Green Map creates custom-edited map images using open geographic data sources such as geoBoundaries, Natural Earth, OpenStreetMap, and government open data.
These maps are edited visual materials, not raw data files, and are provided for education, documents, presentations, and graphic reference.