A Virginia Map must explain two kinds of first-level local government on the same page: 95 counties and 38 independent cities. The cities do not sit administratively inside the surrounding counties. For federal geographic purposes, they function as county equivalents, so omitting them would leave gaps in a complete county-level view of the Commonwealth.
That structure is most visible around Northern Virginia, Richmond, the Roanoke Valley, and Hampton Roads, where compact city boundaries interrupt or sit beside much larger county shapes. The supplied artwork solves the labeling problem by printing county names directly inside their areas while assigning numbers 1 through 38 to the independent cities. A two-column key at the left translates each number into a city name.
The three map previews share a 1200 × 699 landscape canvas and the same boundary geometry. One version uses muted pastel fills, one removes the fills but retains names and numbers, and one strips away the labels for exercises or custom graphics. Accomack and Northampton remain separated from the mainland on the Eastern Shore, with the Chesapeake Bay gap giving the long state outline room to breathe.
These files are administrative references rather than road or physical maps. They do not show highways, terrain, rivers, a scale bar, a north arrow, or a capital symbol. Richmond appears as independent-city marker 30, not as a star. Understanding those limits makes it easier to choose the right version and prevents the numbered city symbols from being mistaken for ranked places or travel stops.
Table of Contents
Virginia Map Files Included
All three sheets represent 133 county-level units: the 95 named counties plus the 38 numbered independent cities. The city index runs alphabetically from Alexandria at 1 to Winchester at 38. It includes large coastal cities such as Chesapeake, Norfolk, Suffolk, and Virginia Beach as well as small inland units such as Buena Vista, Covington, Galax, Norton, and Radford.
- Color reference: pastel county areas, black county labels, numbered independent-city markers, and a complete city index.
- Black-and-white reference: the same boundaries, names, numbers, and index without categorical fills.
- Blank outline: county and independent-city boundaries without the county names, city numbers, or index.
The numbering is especially helpful where a city and county share a name. Fairfax city is marker 10 inside Fairfax County; Franklin city is marker 12, while Franklin County lies much farther west; Richmond city is marker 30, distinct from Richmond County on the Northern Neck; and Roanoke city is marker 31 within the Roanoke County area. The index prevents those pairs from collapsing into a single label.
Virginia’s long form also creates several recognizable geographic groups. Lee, Scott, Wise, and Dickenson form the far southwestern end. The Shenandoah Valley runs through counties such as Frederick, Shenandoah, Rockingham, Augusta, and Rockbridge. Northern Virginia narrows around Loudoun, Fairfax, Arlington, and Prince William, while the Tidewater side breaks into peninsulas and small coastal jurisdictions.
On the right, Accomack and Northampton occupy the Eastern Shore rather than the main mainland block. Their uninterrupted county labels contrast with the dense numbered cluster around Hampton Roads. The artwork does not label the Chesapeake Bay or Atlantic Ocean, and it leaves neighboring states unnamed, so it should be used for Virginia local-boundary study rather than interstate orientation.
Virginia Map Color Version
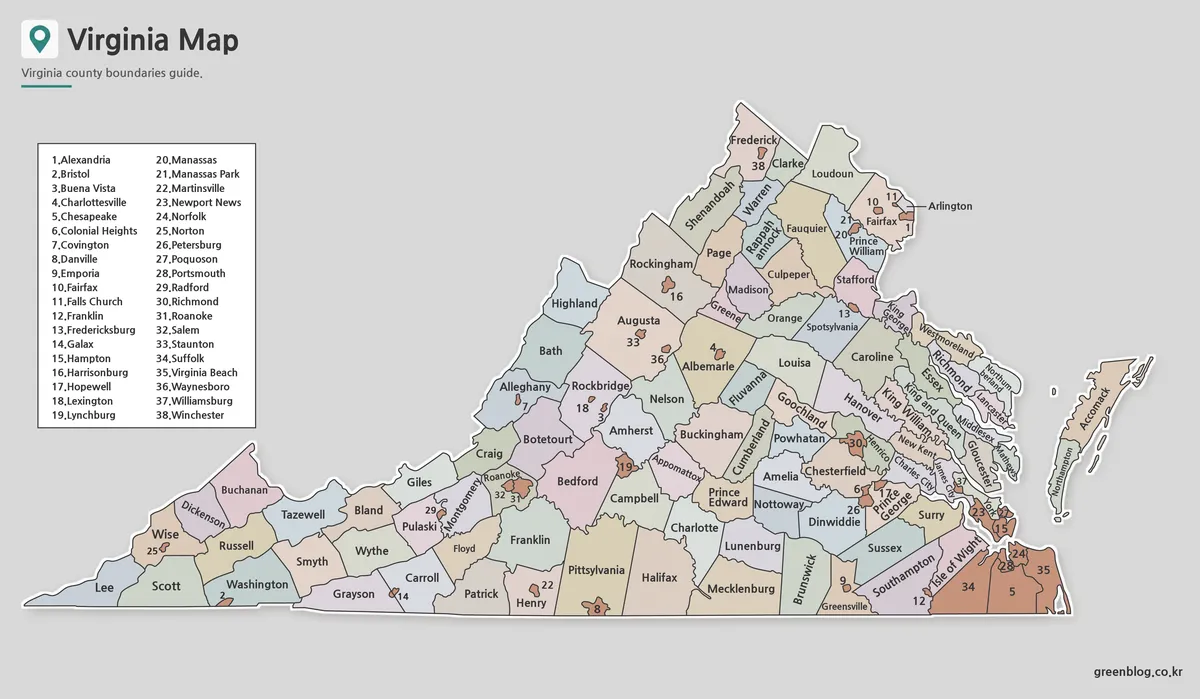
The color edition uses soft pink, blue, green, tan, and gray fills to separate adjoining county shapes. Those colors are categorical only. They do not encode population, election results, elevation, planning regions, or economic data, and no statistical legend is present. A user adding a thematic overlay should supply a new legend, source, and reference year.
Color is most useful in crowded parts of the map. It helps distinguish the thin Northern Neck counties, the closely packed counties around the lower Chesapeake, and the narrow spaces surrounding independent-city symbols. County names remain the primary reading layer, while the city numbers act as cross-references to the boxed list rather than as a second set of overlapping names.
This is the clearest completed reference for a slide or classroom demonstration. Begin with a large county such as Pittsylvania or Augusta, then compare it with the compact city boundaries marked inside or beside neighboring counties. The exercise shows why a Virginia county-only count differs from the 133 county-equivalent units represented by the full sheet.
Labeled Virginia Map for Reports and Slides
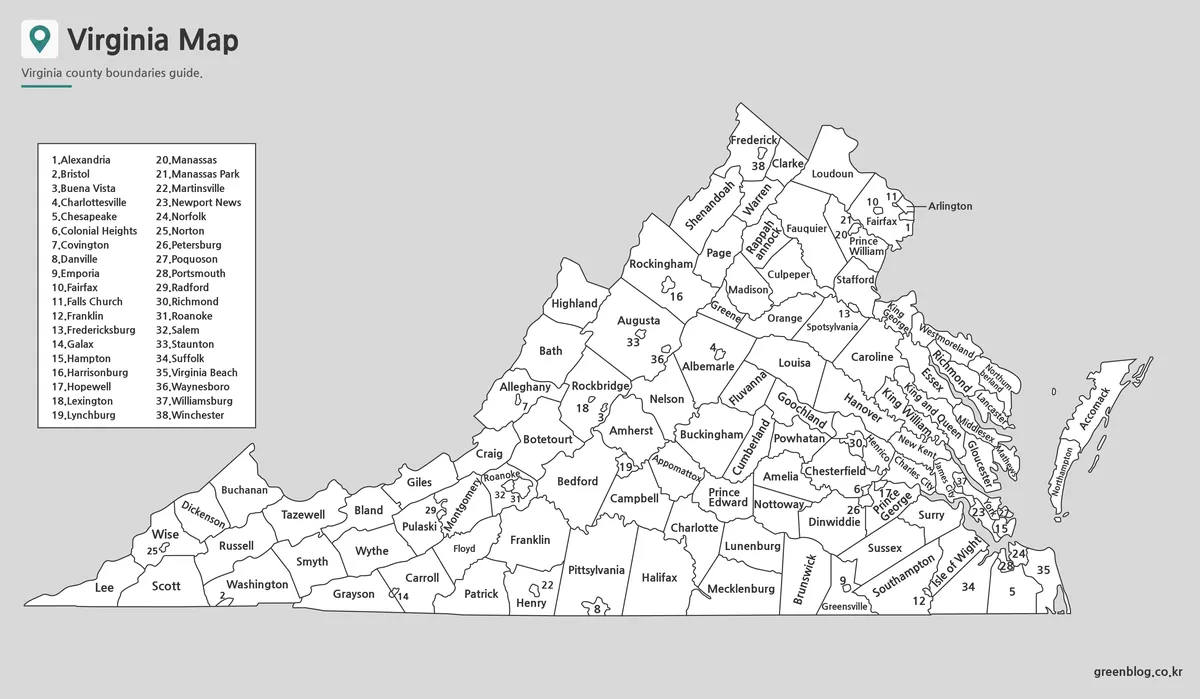
The monochrome edition keeps the complete labeling system but turns every administrative interior white. It is suitable for a report appendix, answer key, or low-ink reference where the reader needs names without pastel fills. The fine coastal outlines, small city shapes, and Eastern Shore remain visible, although the tightest symbols should be checked after scaling.
One printed subtitle in this image reads “Virginia counts guide.” The intended wording is evidently “Virginia county boundaries guide,” which appears correctly in the color and outline versions. The typo does not change the mapped boundaries or the city index, but users should crop, cover, or correct that subtitle before using the monochrome sheet in a polished publication.
The map also needs careful interpretation around repeated place names. A county label is written directly across its polygon, whereas an independent city is identified by a small number. The list should therefore stay attached when the monochrome map is printed; removing the left panel would make all 38 city markers difficult to decode.
Blank Outline Map for Editing
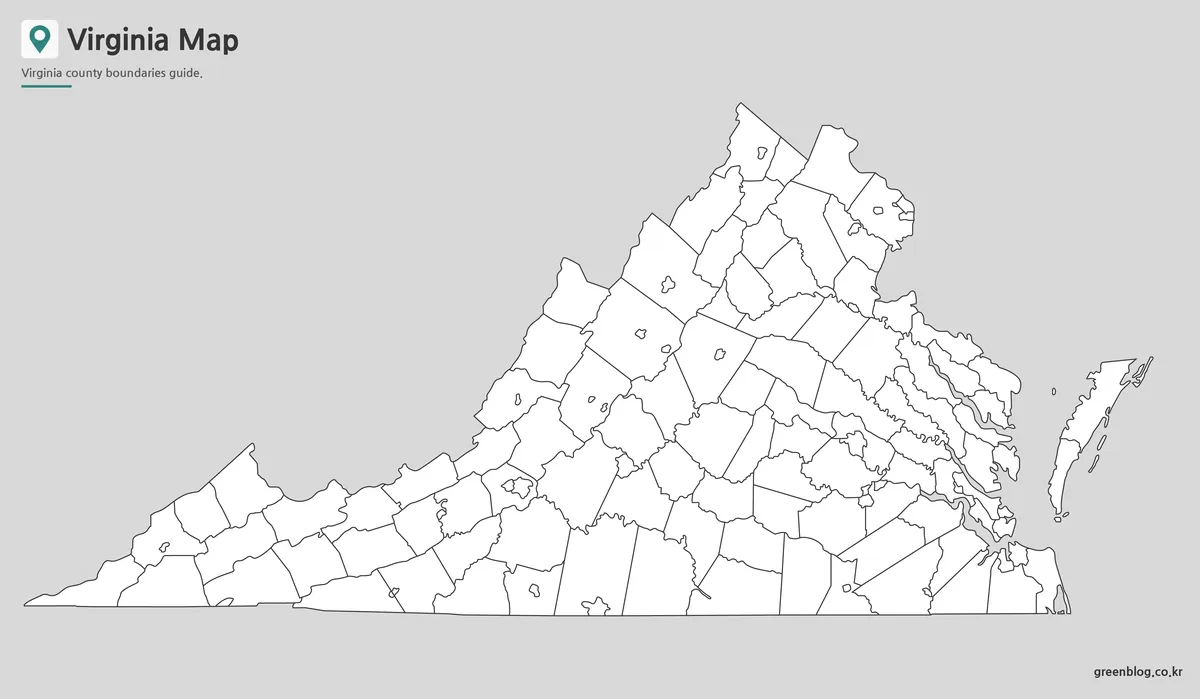
The outline edition removes every county name, numbered city marker, city index, and pastel fill. It preserves the state perimeter, internal county lines, small enclosed city shapes, coastal indentations, and the Eastern Shore. This makes it more detailed than a blank state silhouette: the user must still decide which internal shapes are counties and which are independent cities.
For a labeling exercise, learners can begin at Lee County in the southwest, follow the southern border eastward, identify the Shenandoah Valley and Northern Virginia, and finish with Accomack and Northampton. A second pass can add the numbered cities using the labeled edition as an answer key. This staged method is easier than attempting all 133 units at once.
The supplied body preview is a WebP raster image, not an SVG, GIS layer, or editable vector file. It can accept labels, arrows, and color overlays in an image editor, but individual boundaries are not promised as selectable objects. Preserve the 1200 × 699 aspect ratio when resizing so the long southwest-to-northeast profile is not distorted.
Designed for Administrative and Regional Comparison
This map set works best when the task matches its labeling level. Choose color for quick separation of adjacent counties, monochrome when every supplied name and city number must remain visible, and outline when the reader should supply the answers or add sourced data. None of the three versions locates ordinary incorporated towns, census-designated places, roads, or physical features.
For print work, keep the city key large enough to read Alexandria through Winchester and inspect the Northern Virginia and Hampton Roads clusters first. The package description identifies the downloadable images as JPG files prepared for A3 output, while the three web previews examined here are WebP. Print a test page before producing a full class set because the preview’s landscape ratio and fine coastal lines may interact differently with printer margins.
For data graphics, treat counties and independent cities as separate county-level units. If a source reports county-equivalent data, its values may include both. If a source reports counties only, do not silently attach city values to surrounding counties. A caption should state the measure, year, source, and whether all 38 independent cities are included.
Frequently Asked Questions
Does the Virginia Map include independent cities?
Yes. The collection includes Virginia’s counties and independent cities.
Can the Virginia Map be printed in A3 size?
Yes. The files were prepared as high-resolution JPG images for A3 printing.
Which Virginia Map version is best for editing?
The outline version is best for custom editing, coloring, annotations, and infographic work.
Is the labeled map good for classroom use?
Yes. The labeled version is useful for geography lessons, reports, and presentation materials.
Why are the independent cities shown as numbers?
Many independent-city boundaries are too small to hold a readable name, especially around Northern Virginia, Richmond, and Hampton Roads. The numbered markers connect those shapes to the alphabetical list at the left. Keep the index with the map whenever the labeled versions are printed, cropped, or inserted into a presentation.
Map File Information
The archive groups the color, labeled monochrome, and blank boundary versions shown above.
- Included Versions: Color, black and white, and outline
- Intended Use: Printing, lessons, reference sheets, reports, and custom annotations
Related Maps
Additional Resources
The official Virginia local government directory can be used to verify whether a named locality is a county, independent city, or incorporated town before adding new annotations.
Green Map creates custom-edited map images using open geographic data sources such as geoBoundaries, Natural Earth, OpenStreetMap, and government open data.
These maps are edited visual materials, not raw data files, and are provided for education, documents, presentations, and graphic reference.