Escambia County Alabama Map resources on this page are designed for readers who want both a quick geographic overview and printable files. You can preview the county, city, water, and elevation maps below, then download all four as high-resolution A3 JPGs in one ZIP archive. Together they show how Atmore and Brewton anchor opposite sides of the county, how U.S. 31 crosses the southern interior, where the Florida state line sits, and how the Conecuh River and smaller creeks fit into the landscape.
Escambia County lies in southern Alabama, directly along the Florida border. Brewton is the county seat in the east, while Atmore is the major population and service center in the west. Flomaton occupies a smaller but strategically useful location near the state line and important road connections. Because the county is broad from west to east, a single point does not explain it well. The four maps separate administrative geography, settlement, waterways, and relief so that each part remains readable while still fitting into one county-wide picture.
Table of Contents
County Boundaries, U.S. 31, and the Florida Line
The general county map is the best place to begin. Escambia County stretches across a wide section of southern Alabama with Atmore toward the west and Brewton toward the east. U.S. 31 provides one of the clearest connections between the two sides, passing through or near communities that help establish the county’s internal geography. The southern edge is especially easy to recognize because it follows the Alabama–Florida state boundary.
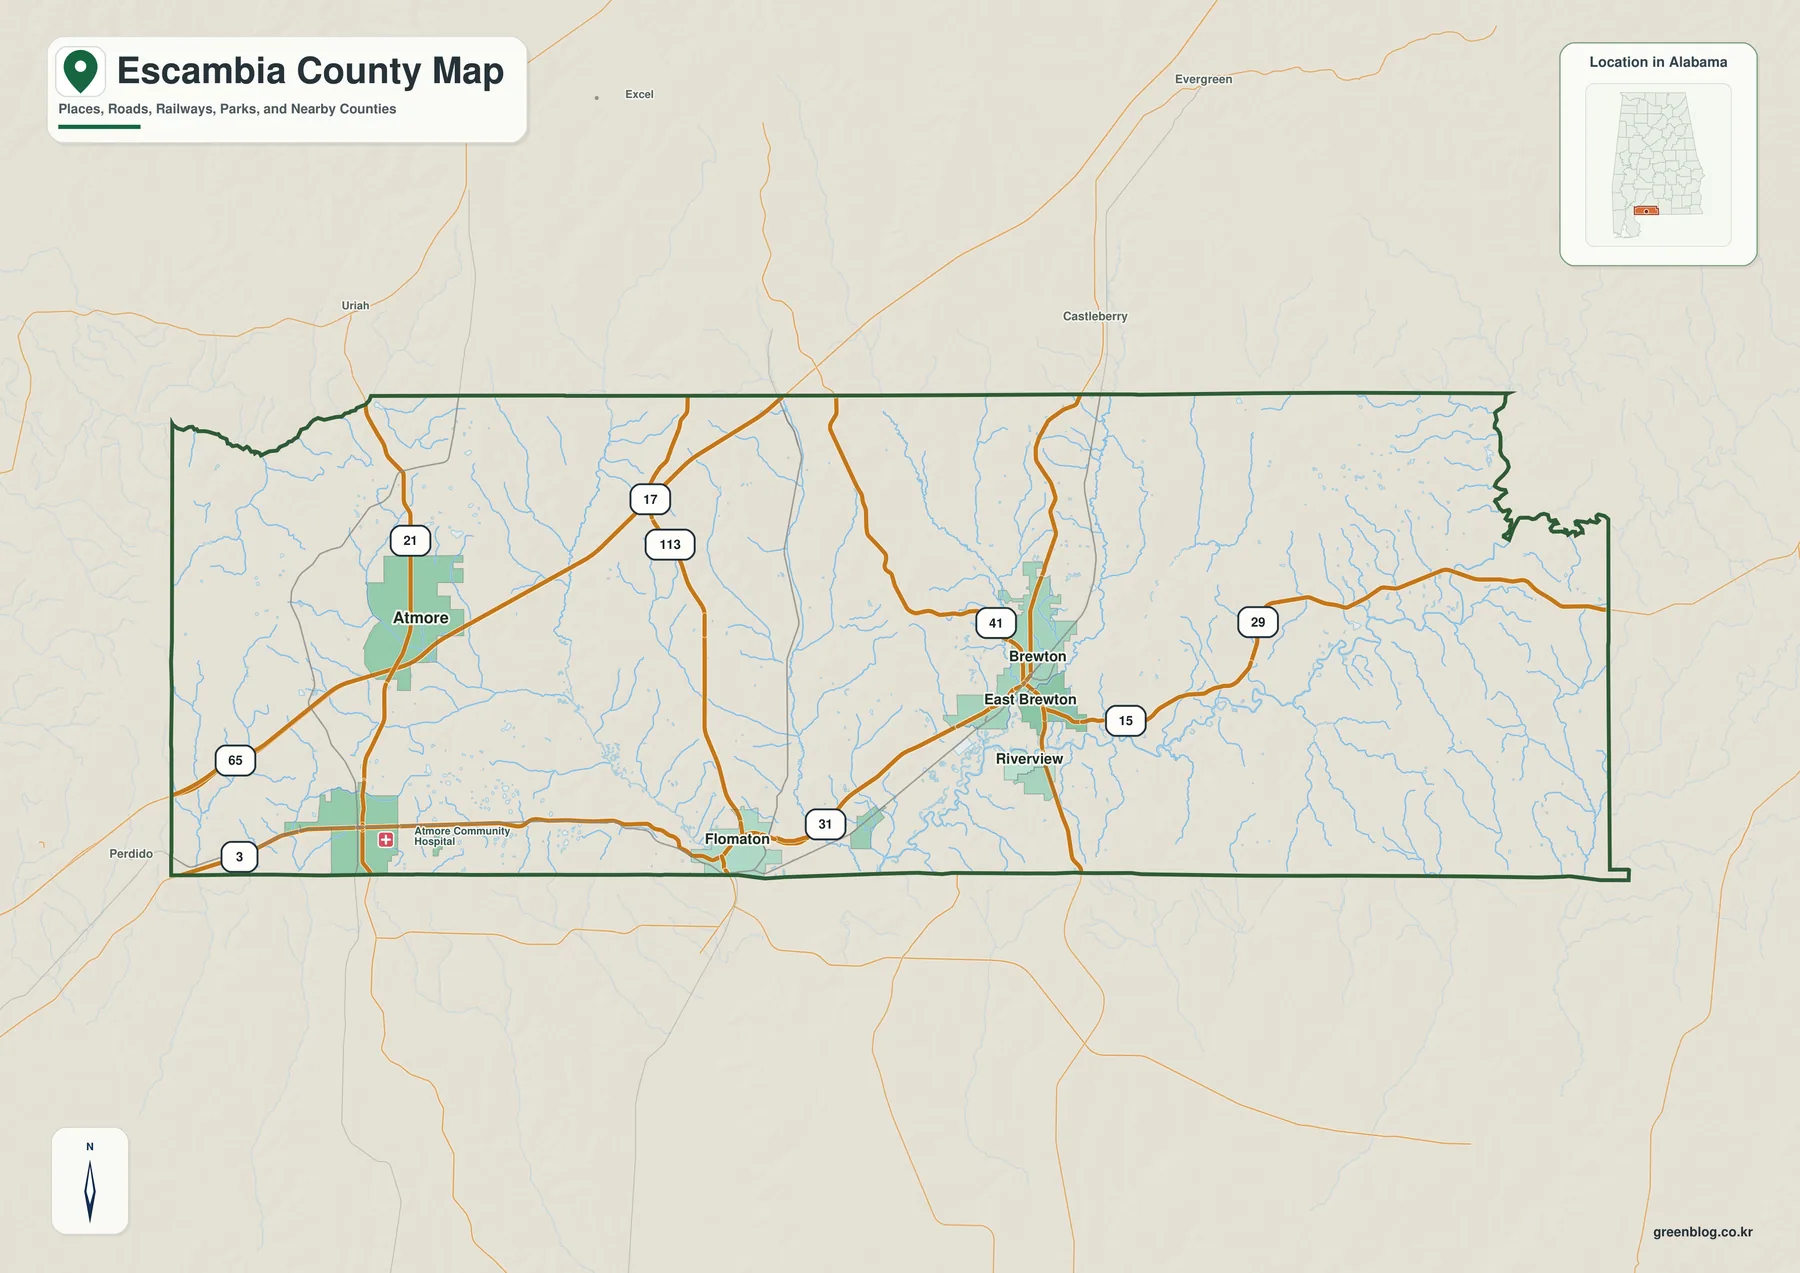
Interstate 65 is an important regional route near the western side of the county and is particularly relevant to Atmore. In the east, roads converge more closely around Brewton. Alabama routes 21 and 41 add north–south connections, while U.S. 29 is important near Flomaton. The map is useful for understanding direction and relative location, but it is not a substitute for live navigation because it does not show current traffic, closures, temporary construction, or every local road.
Atmore and Brewton Define Two Sides of the County
The city map makes Escambia County’s two-center pattern easier to see. Atmore stands out in the west, where access to I-65 and the nearby Poarch community gives it a strong regional role. Brewton sits well to the east and serves as the county seat. Smaller places, including Flomaton and Pollard, help fill the long space between these two anchors and show that settlement is distributed along several road corridors rather than concentrated in one central urban area.
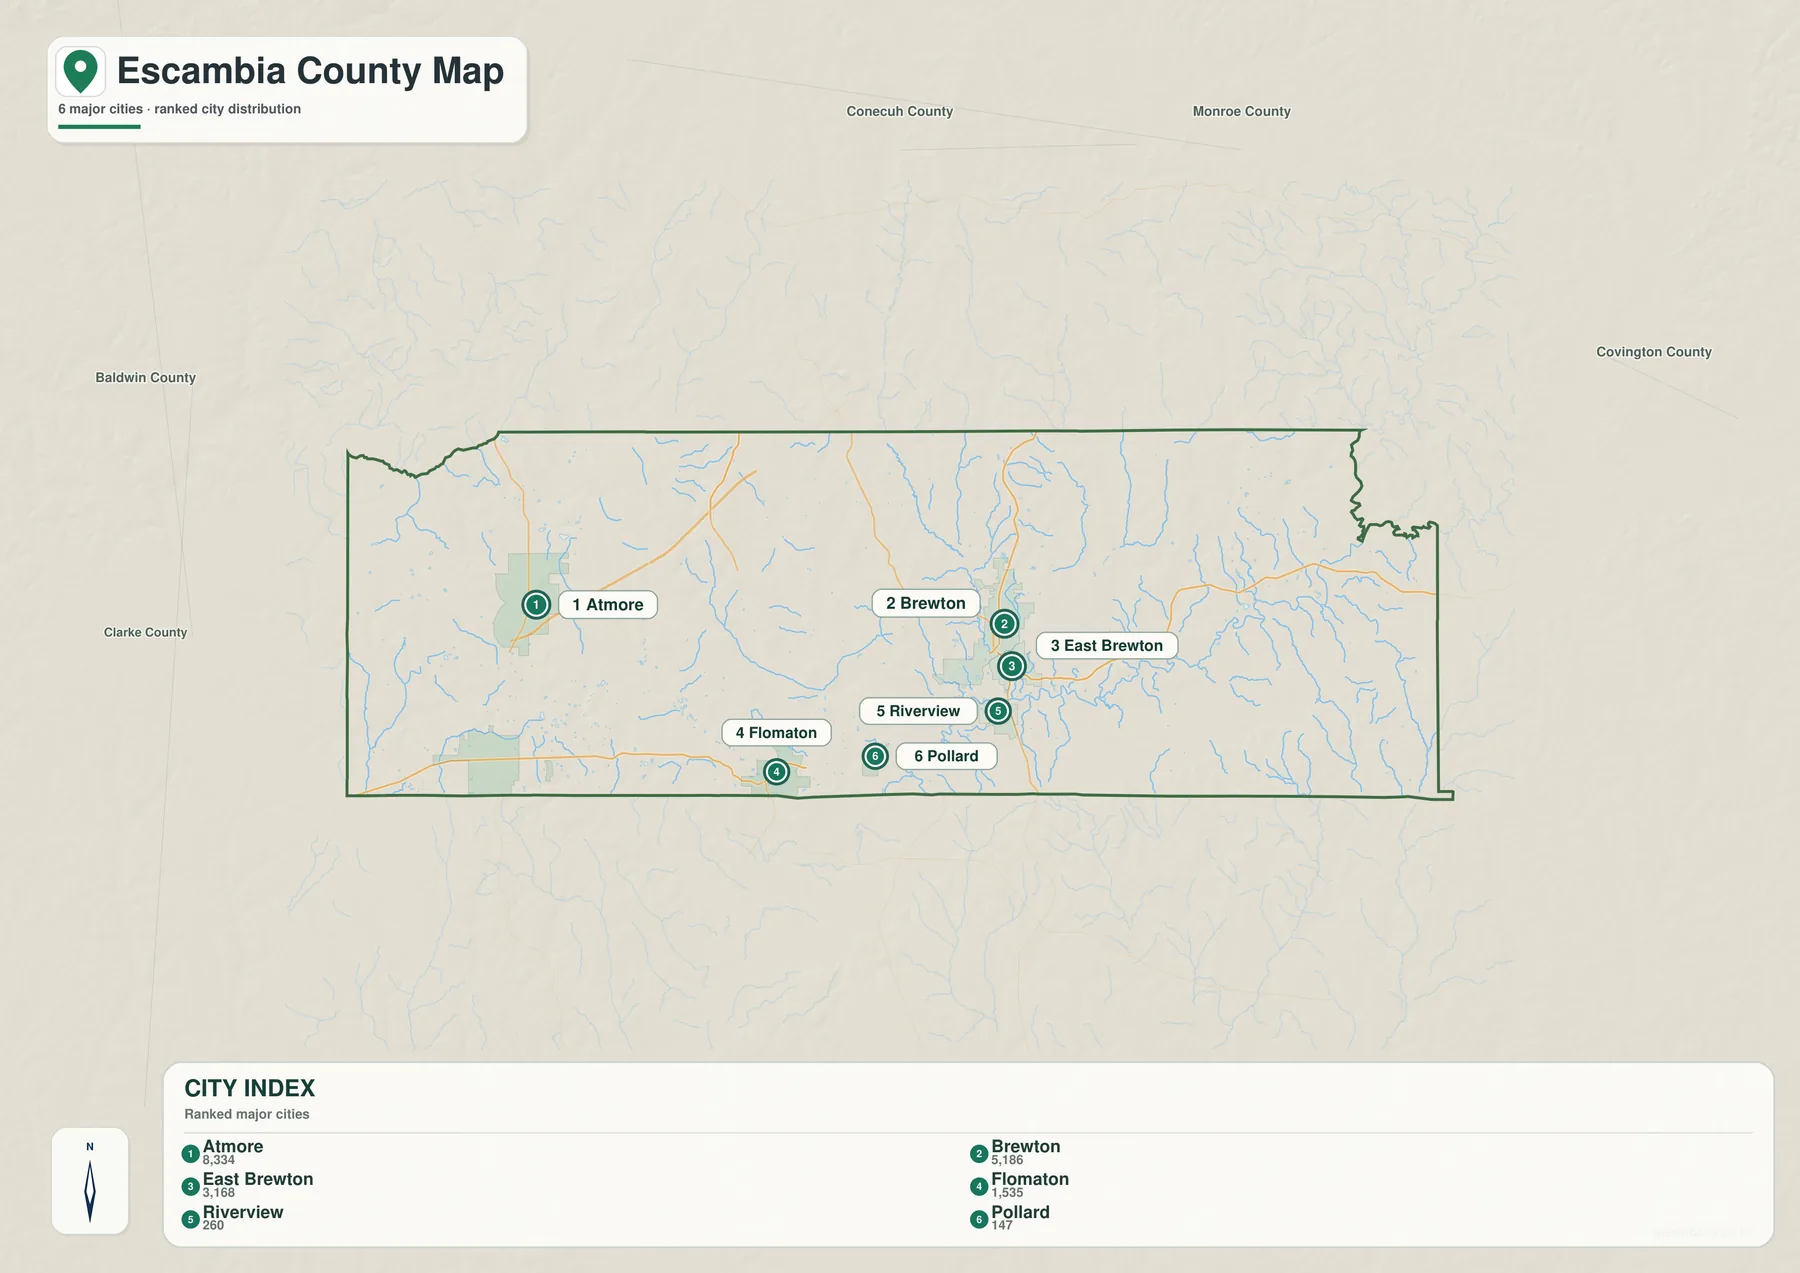
Reading the city layer together with the road map is useful because community size alone does not explain local importance. Flomaton, for example, is much smaller than Atmore or Brewton but occupies a recognizable transportation location near the state border, where U.S. 29 and U.S. 31 meet. Brewton’s position becomes even more meaningful when the water map is added, because the city lies close to the Conecuh River and associated lowlands.
The Poarch Creek Indians are also an important part of the county’s western geography and history. Their community is near Atmore, and official tribal resources provide additional background for readers who want context beyond municipal labels. The map itself should be used for geographic orientation rather than as a representation of legal tribal boundaries or land ownership.
The Conecuh River and a Network of Smaller Creeks
Water is most prominent in eastern Escambia County. The Conecuh River passes near Brewton and continues south toward Florida, while Murder Creek joins the larger drainage system in the same general part of the county. Farther west and through the center, the map identifies waterways such as Little Escambia Creek, Big Escambia Creek, Burnt Corn Creek, and Stringer Creek. Instead of one large lake dominating the landscape, the county is crossed by a network of streams and smaller water bodies.
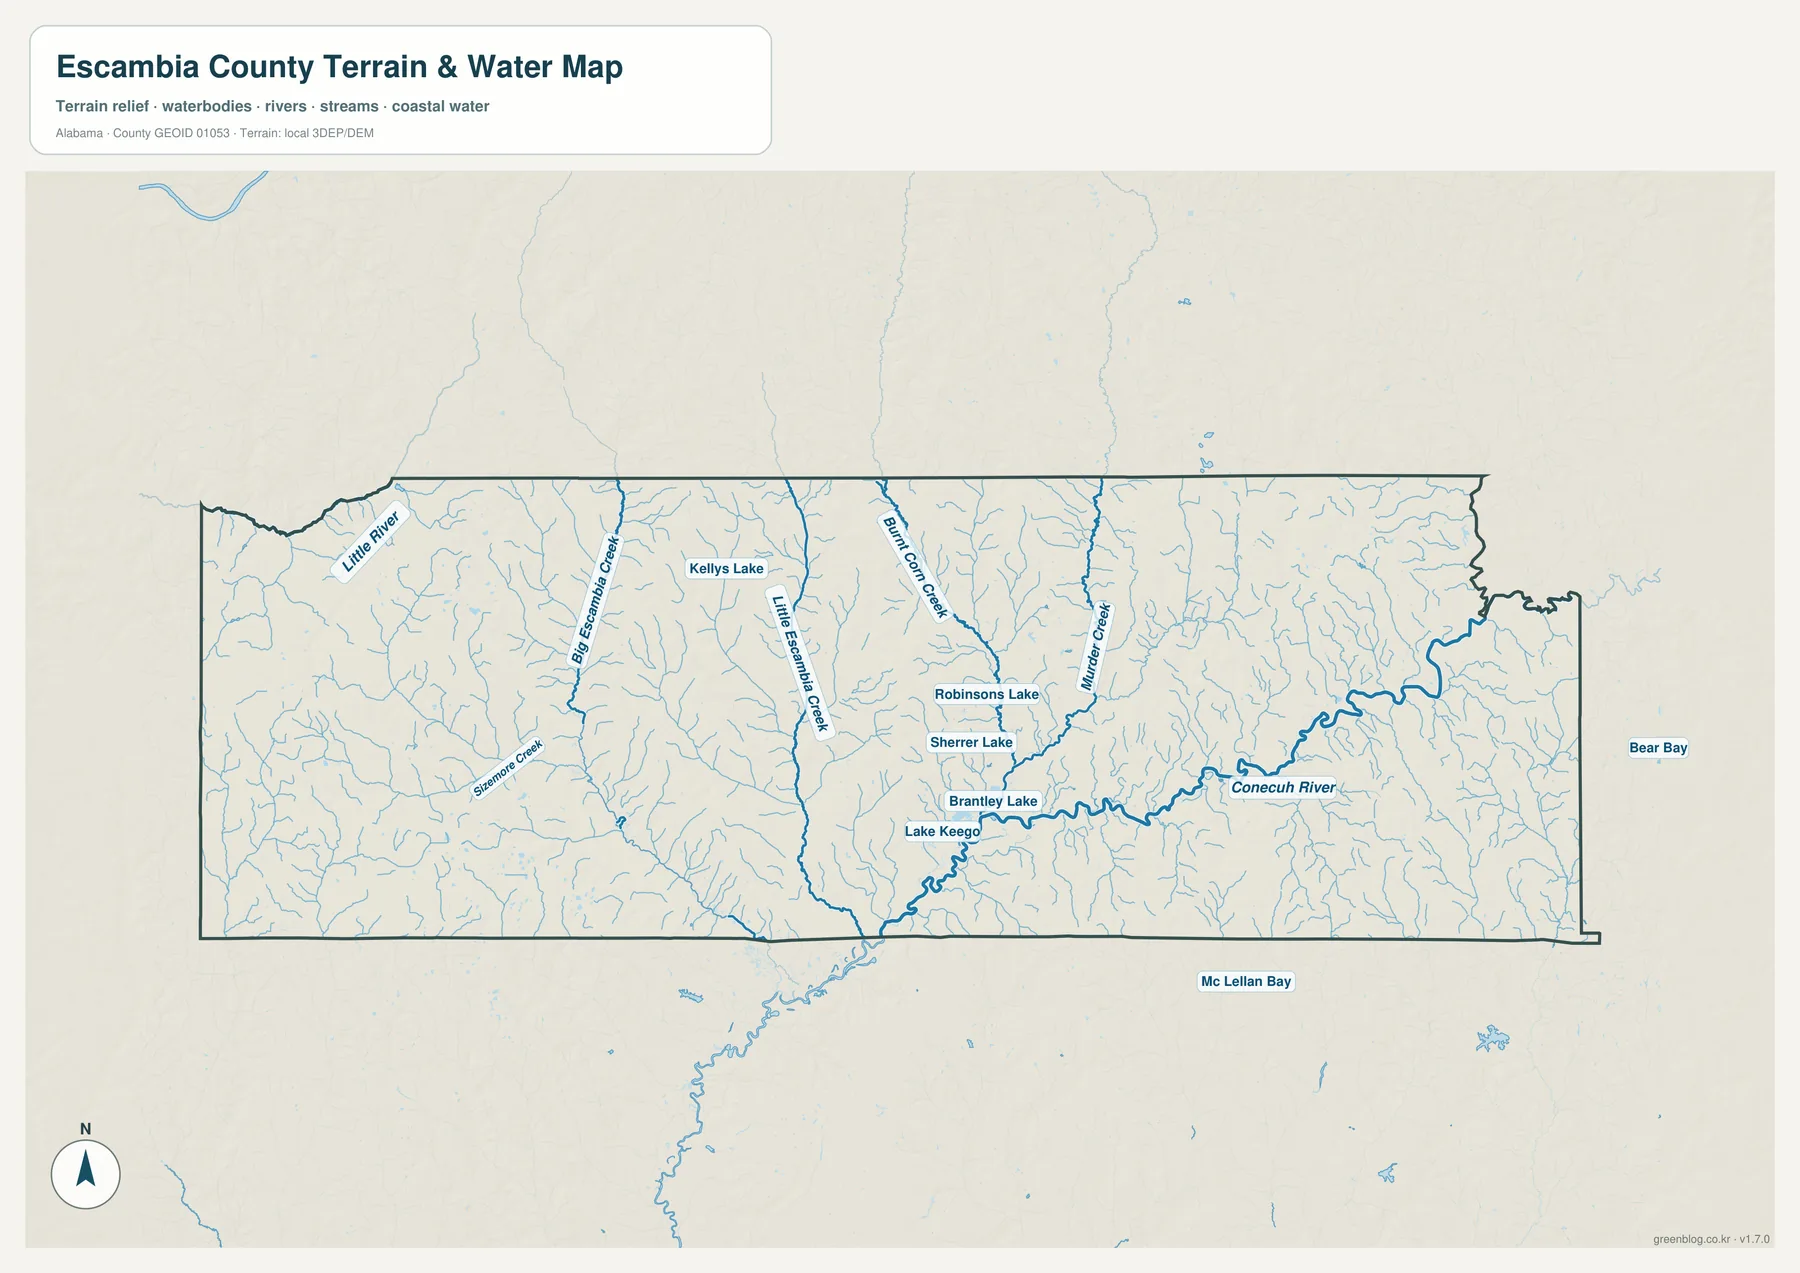
Named lakes such as Kellys Lake, Robinsons Lake, Sherrer Lake, Brantley Lake, and Lake Keego appear as local reference points. They are useful for identifying nearby areas, although they are not major reservoirs that define the whole county. The map also shows that waterways continue beyond administrative lines. Rivers and creeks do not end at the Alabama–Florida border, so the state boundary should be understood as a political line crossing a connected natural drainage system.
This water layer is intended for geographic reference, not for flood safety or boating decisions. It does not provide water depth, channel conditions, flood-zone boundaries, current speed, launch access, or safe navigation routes. For fishing, paddling, flood preparation, or emergency planning, use current information from the appropriate water-resource and public-safety agencies.
Higher Ground in the West, Lower Valleys in the East
The elevation map adds a different view of Escambia County. Broad areas in the west and northwest are relatively higher, while lower green corridors become more noticeable in the east along the Conecuh River and its tributaries. The county remains part of the Gulf Coastal Plain rather than a mountainous region, but the elevation shading makes clear that the land is not uniformly flat.
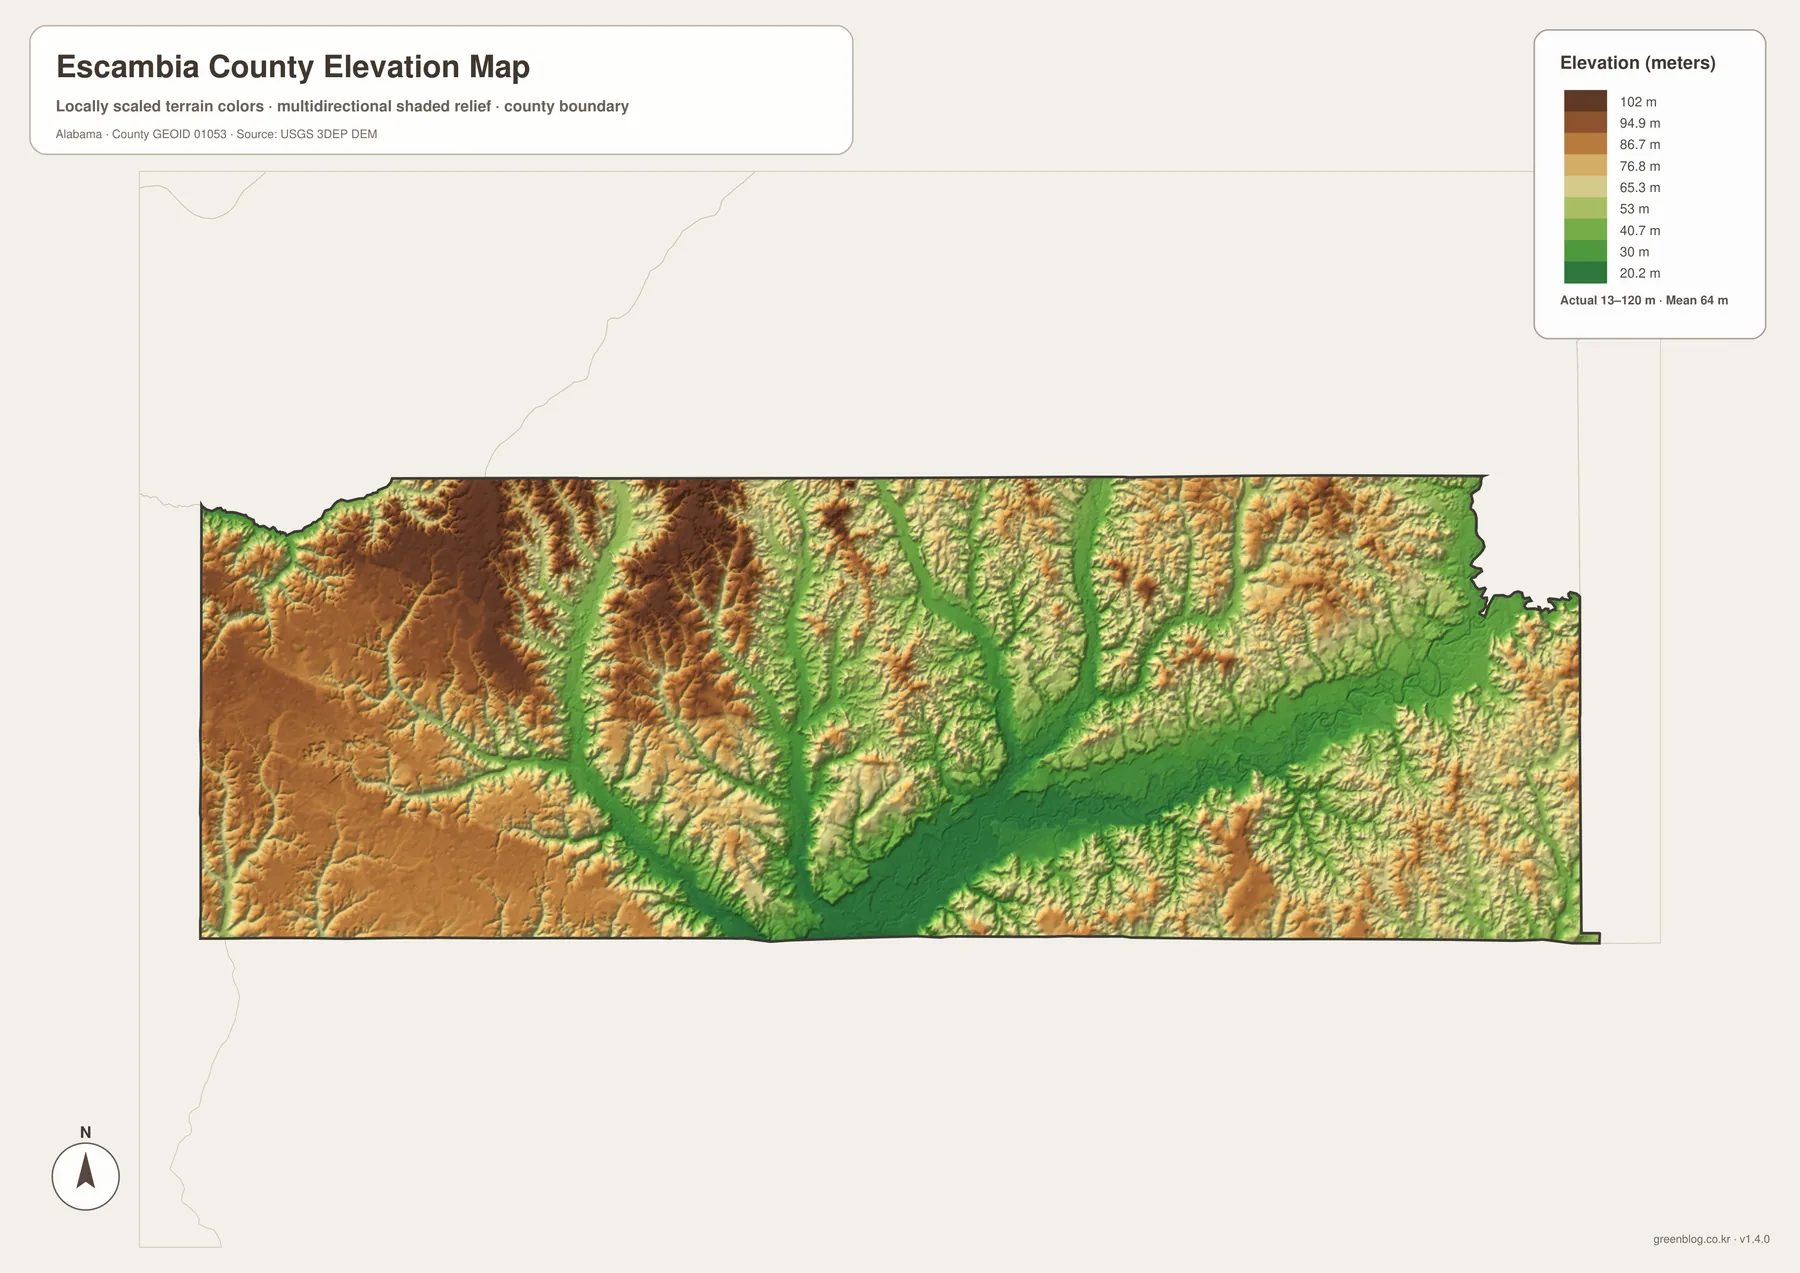
The mapped elevation range is roughly 13 to 120 meters, with an average near 64 meters. Small streams cut shallow valleys into the terrain, especially toward the eastern half, where the drainage network is denser. Brewton’s location near the Conecuh River is therefore visible not only on the water map but also on the elevation sheet as part of a lower valley corridor.
Part of the broader Conecuh National Forest landscape reaches the southeastern area near the Florida line and extends beyond Escambia County into neighboring counties. Pine forest, stream valleys, and gently rolling uplands are better understood when the elevation and water layers are considered together. The shaded relief is generalized, however, and should not be used for engineering grades, exact parcel elevations, property boundaries, or survey work.
Choosing the Right Printable Map for Your Task
Use the county map when you need the broadest orientation: boundary, major communities, the Florida line, and principal roads. Choose the city map when the main question is how Atmore, Brewton, Flomaton, and smaller settlements are spaced across the county. The water sheet is better for tracing the Conecuh River and tributaries, while the elevation map explains why river corridors and western uplands look different from one another.
A classroom activity can combine the maps without overwhelming students. Start by following U.S. 31 from the Atmore side toward Flomaton, Pollard, and Brewton. Then switch to the water map to identify the Conecuh River near Brewton, and finish with the elevation sheet to compare the river lowland with higher western ground. This sequence connects transportation, settlement, political boundaries, and physical geography in a way that is easier to understand than placing every label on one crowded map.
The files are also suitable for presentations, travel preparation, labeling exercises, personal reference, and printed map collections. They are not live navigation products, legal boundary maps, flood maps, or survey documents. For decisions that depend on current conditions or legal precision, confirm the information with the responsible agency.
For A3 printing, keep the original aspect ratio so labels and boundaries do not become distorted. The JPGs can also be reduced for smaller paper sizes when needed. If a map will be used in a report or slide, the separate thematic sheets make it easier to choose only the information relevant to that page instead of shrinking a dense all-in-one map.
Frequently Asked Questions
Why are both Atmore and Brewton important reference points?
Atmore is the major western city and is close to I-65 and the Poarch community. Brewton is the county seat in the east and lies near the Conecuh River. Because the two cities serve different parts of a wide county, using both provides a much clearer sense of Escambia County’s geography.
Why does Flomaton stand out on the map?
Flomaton is close to the Florida line and sits where U.S. 29 and U.S. 31 meet. Its population is smaller than Atmore or Brewton, but its transportation location makes it an easy landmark for understanding the county’s southern edge.
What is included in the downloadable map package?
The ZIP contains four high-resolution A3 JPG files: a general county map, a city map, a water map, and an elevation map. They are intended for printing, presentations, classroom use, and personal geographic reference.
Map File Information
Download the county, city, water, and elevation maps as four high-resolution A3 JPG files packaged together in one ZIP archive. The printable files retain more detail than the smaller web previews shown above.
- Included Files: 4 high-resolution A3 JPG map files shown in this article
- File Type: JPG files in a ZIP archive
- Intended Use: Printing, education, presentations, and map-based projects
Related Maps
- Autauga County Map
- Barbour County Alabama Map
- Butler County Alabama Map
- Alabama Population Density Map: Urban Clusters, County Totals and a Decade of Change
- Escambia County Alabama Land Cover Map | Atmore Farms, Forest & Wetlands
Sources and Further Reference
- Escambia County official information
- Poarch Creek Indians official history
- U.S. Forest Service: Conecuh National Forest
- U.S. Census Bureau TIGER/Line Shapefiles
- USGS National Hydrography
- USGS 3D Elevation Program
Green Map creates custom-edited map images using open geographic data sources such as geoBoundaries, Natural Earth, OpenStreetMap, and government open data. These maps are edited visual materials, not raw data files, and are provided for education, documents, presentations, and graphic reference.