The Sumter County Alabama Land Cover Map is a four-view reference for comparing the county’s 2025 surface cover and its mapped differences between 1985 and 2025. The page includes a general land-cover view, a forest-and-farmland view, an impervious-surface map, and a class-difference map. The downloadable ZIP contains the four original JPG files at 2480 × 1754 pixels. Those images are larger than the WebP previews shown in the article, but the package manifest does not classify them as meeting an A3 high-resolution reference.
Sumter County sits in western Alabama along the Mississippi state line and within Alabama’s Black Belt region. The Tombigbee River forms an important part of the county’s eastern water setting, while Livingston and York are among the county’s established communities. The land-cover images do not label towns, highways, parcels, or ownership boundaries, so the most useful way to begin is by looking at broad surface patterns: where forest remains continuous, where agriculture forms larger blocks, where wetlands follow low-lying drainage areas, and where developed or impervious surfaces become concentrated.
Table of Contents
A 2025 landscape shared by forest, wetlands, and agriculture
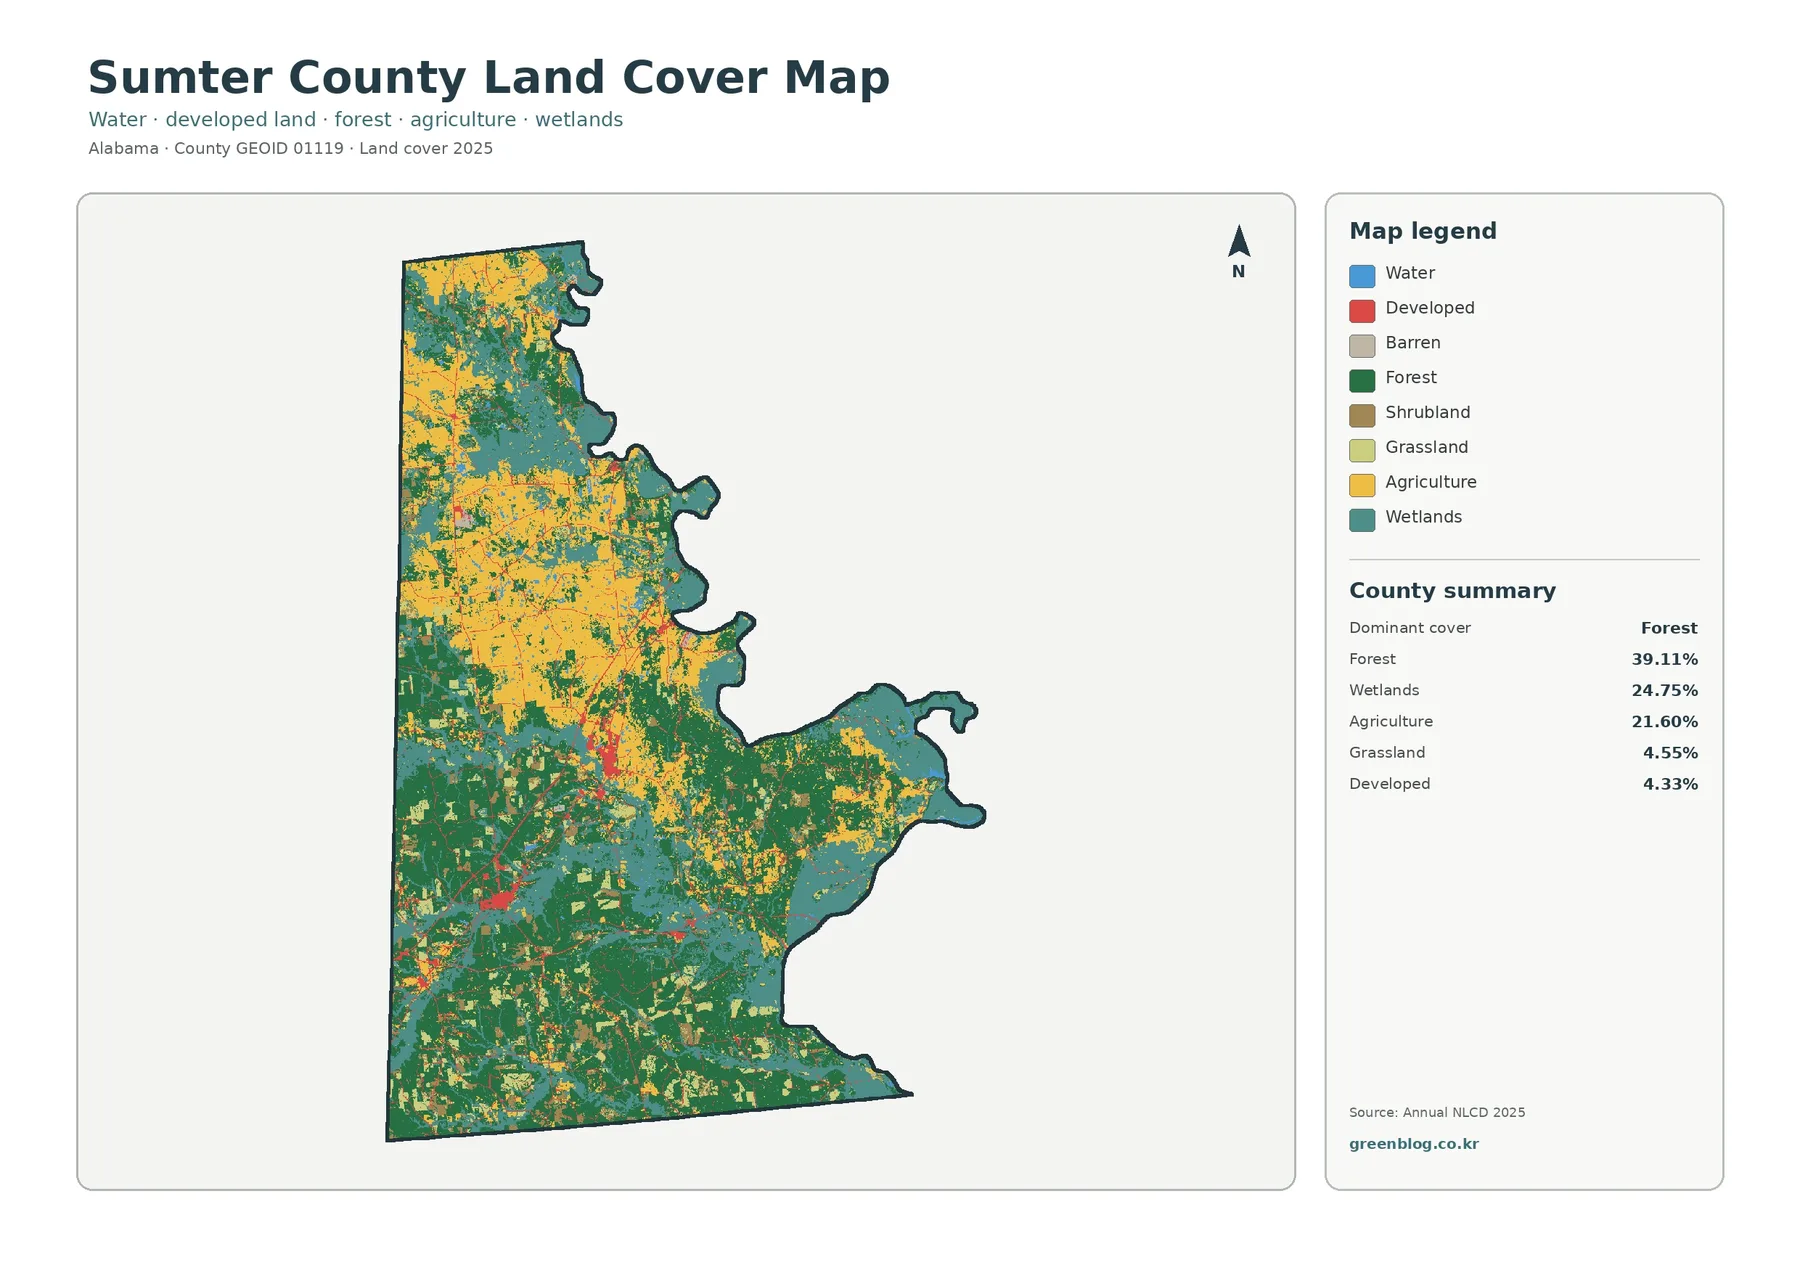
Forest is the largest mapped class at 39.11%, but it does not cover the county as one uninterrupted block. Dark green becomes especially prominent across much of the southern half, where forest surrounds smaller agricultural openings and wetland areas. Forest also occurs in the north, although the upper part of the county has more extensive agricultural color mixed through it. This north-to-south contrast is one of the clearest features in the general map and is more informative than the countywide percentage alone.
Wetlands account for 24.75%, making them a major part of the mapped surface rather than a narrow fringe beside a single river. Teal areas are conspicuous along the irregular eastern side of the county and also extend through interior drainage areas, especially from the middle toward the south. Because Annual NLCD maps surface-cover classes, this wetland percentage should not be treated as a legal wetland determination, a flood-zone total, or a parcel-level boundary. It is a generalized land-cover classification intended for regional comparison.
Separating cropland, pasture, forest, and wet ground
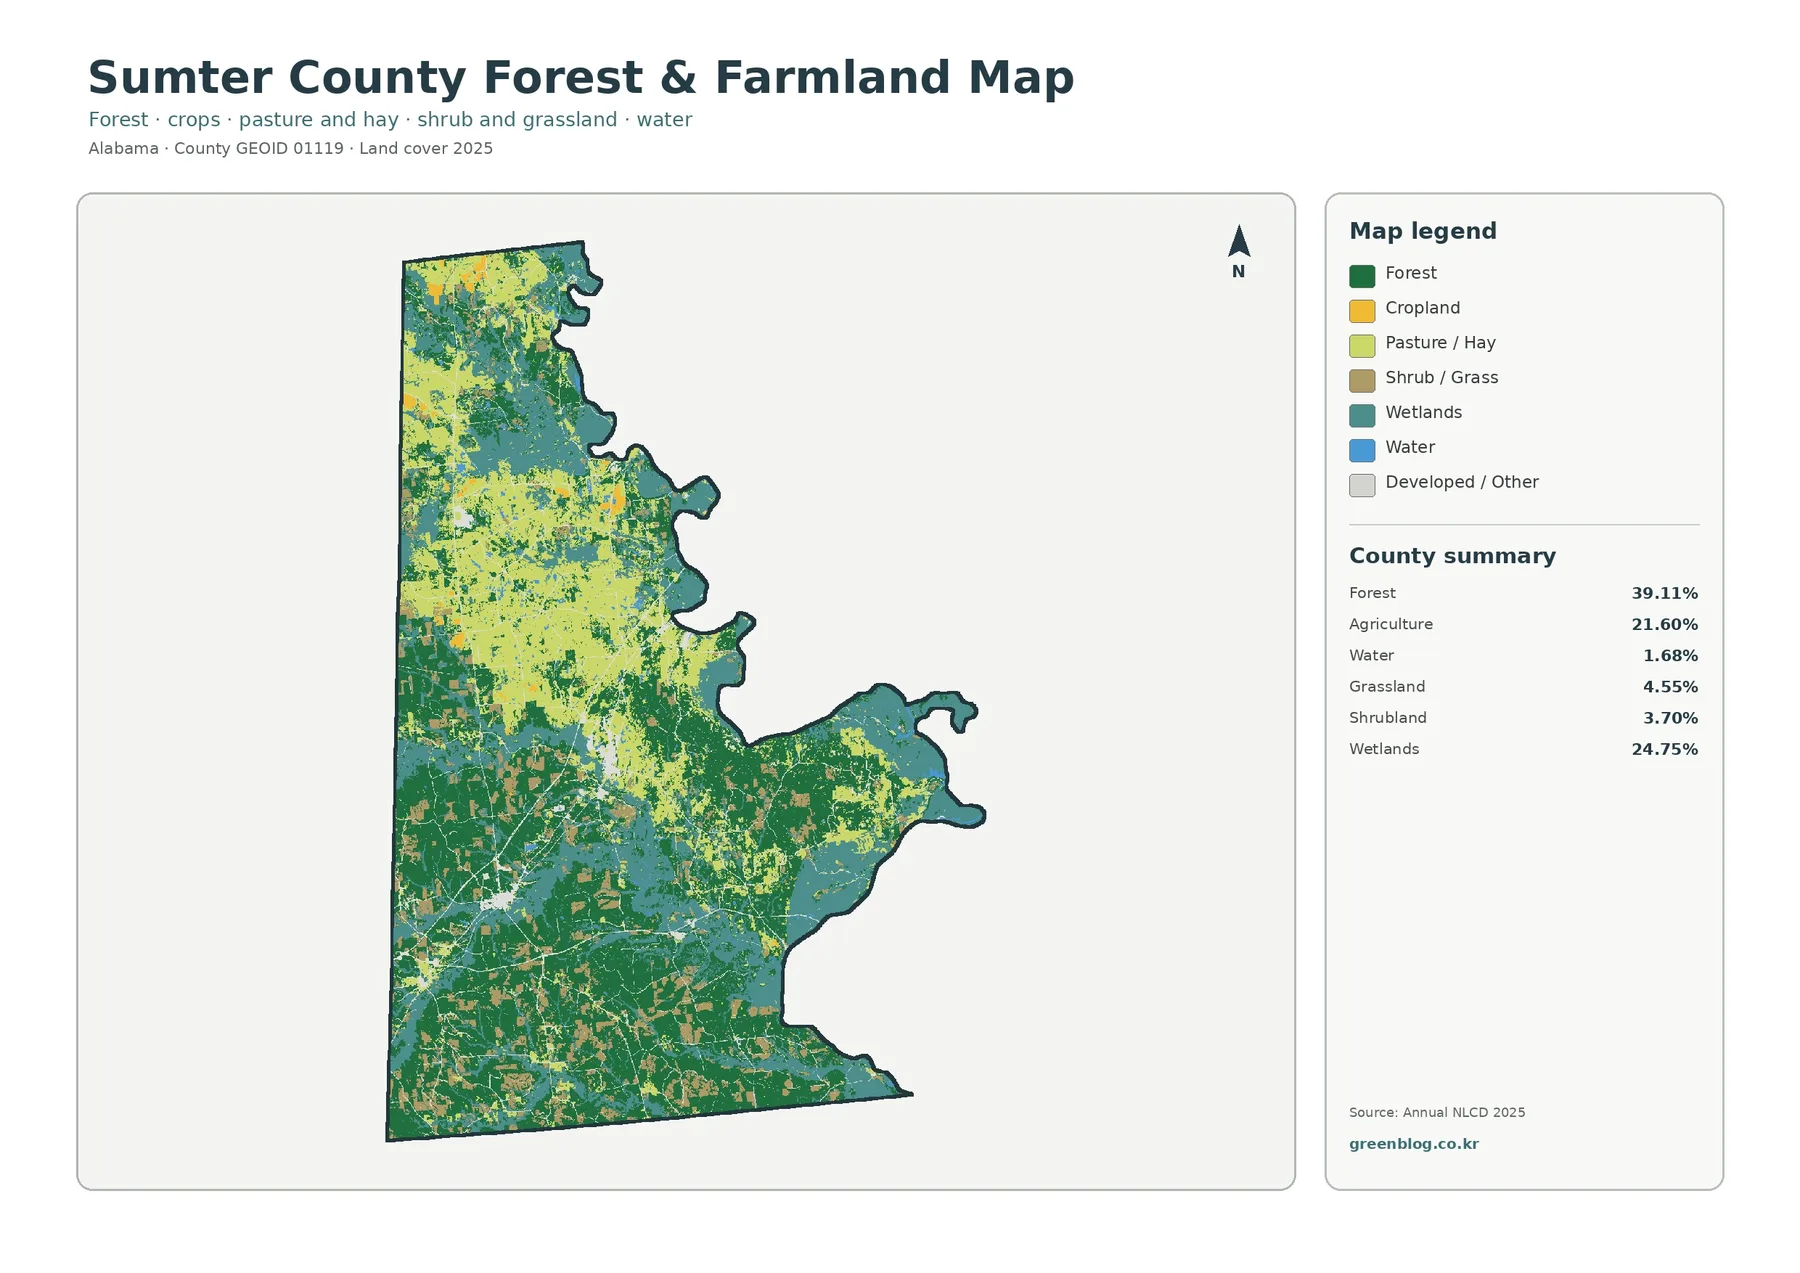
The northern half contains the broadest concentrations of farm-related colors. Cropland and pasture or hay form sizable areas there, but they are interrupted by wetland and forest cells rather than filling the entire northern landscape. Farther south, forest becomes more continuous and farm cover tends to appear in smaller openings. That difference makes the map useful for classroom discussions about how a county can have a significant agricultural share while still having forest as its single largest class.
USDA’s 2022 Census of Agriculture county profile provides a separate source of agricultural context for Sumter County. It reports cropland, pastureland, and woodland within land in farms. Those categories should not be added directly to the Annual NLCD percentages because the two systems answer different questions. A farm can contain woodland, and satellite-classified agriculture does not establish ownership or legal land use. The USDA profile is best used to confirm that farming, pasture, and wooded land all have an important place in the county rather than as a substitute for the map legend.
Why a low impervious average still produces visible developed nodes
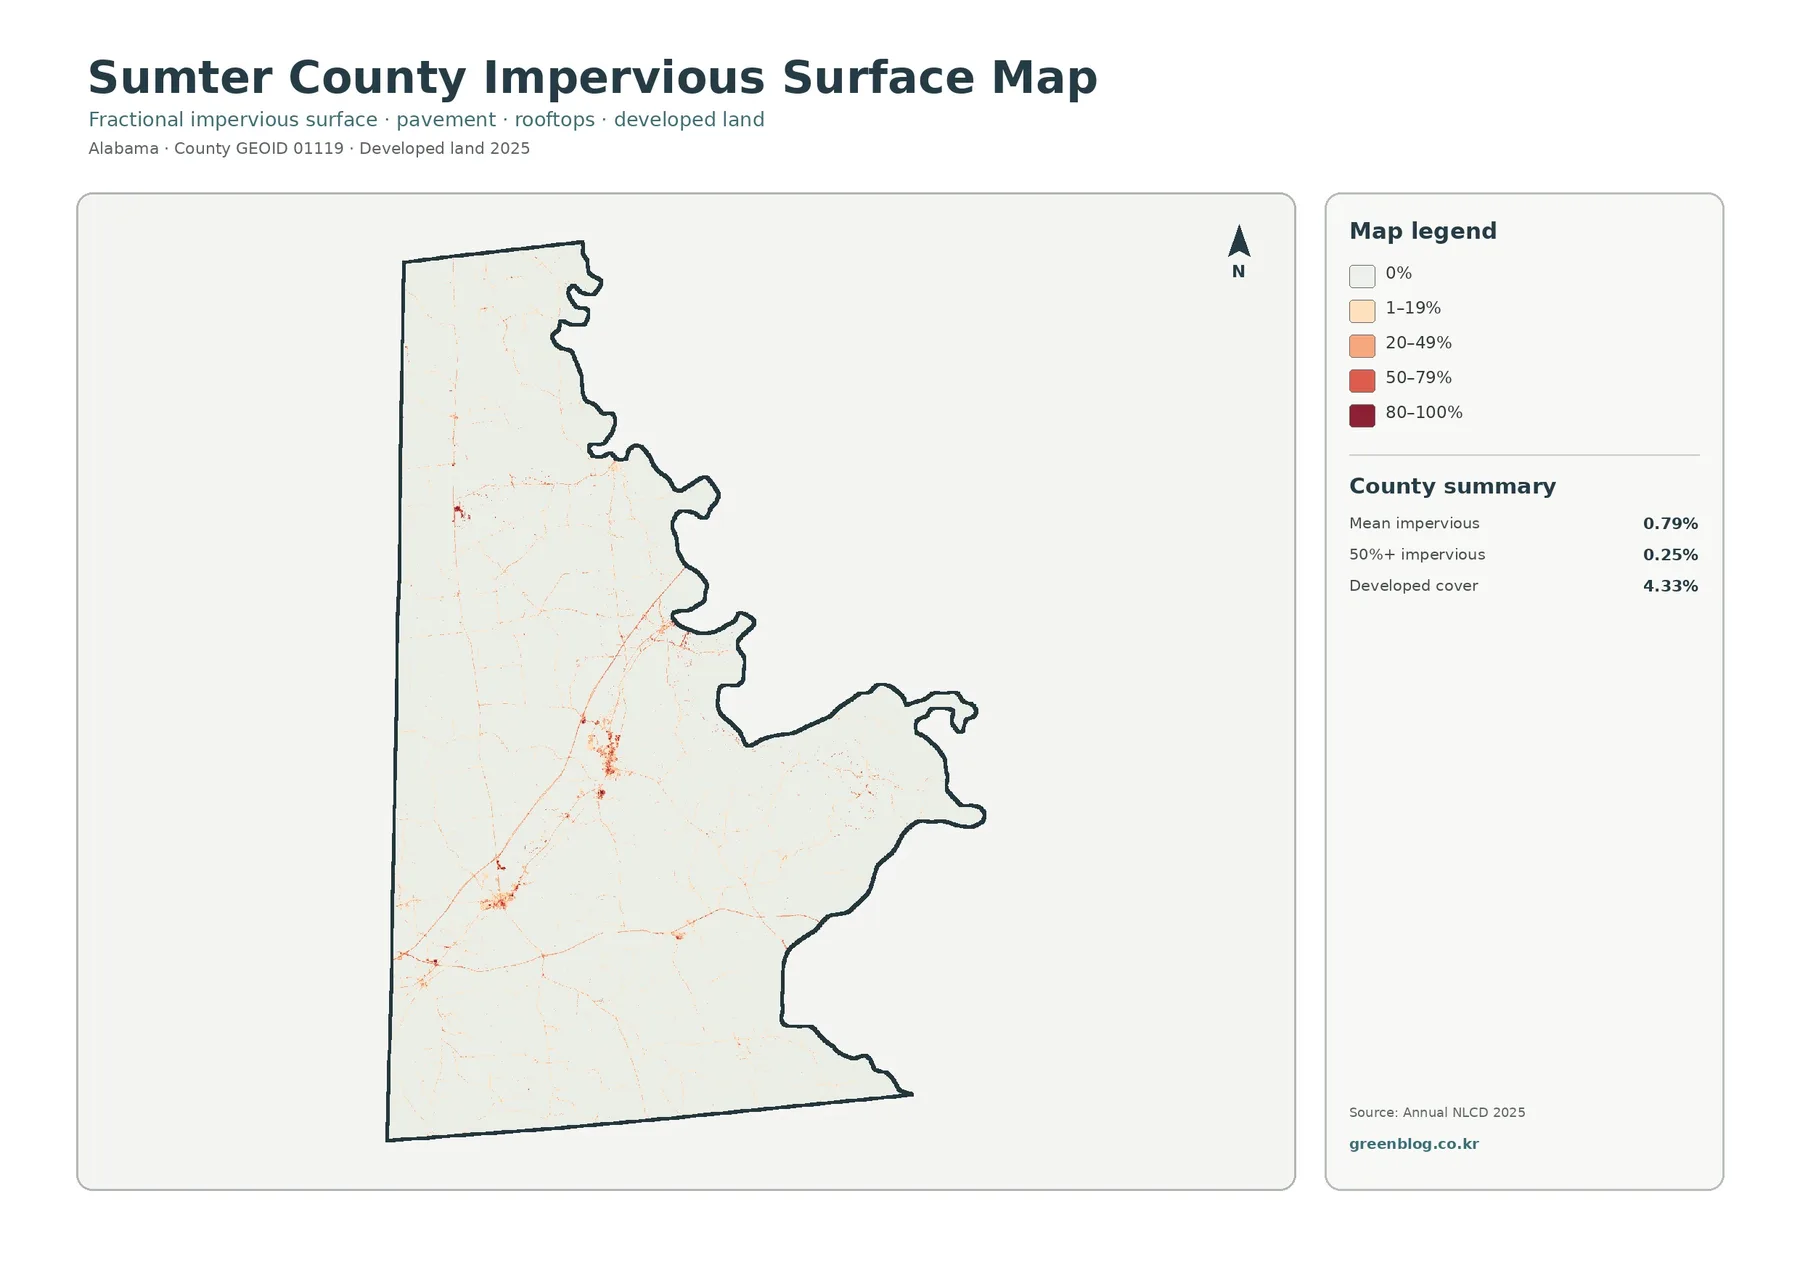
Most of the impervious map is very light, which matches the countywide mean of 0.79%. Only 0.25% of the mapped area reaches at least 50% impervious cover. Small orange and red features nevertheless stand out around settlement clusters and along narrow transportation lines. A more concentrated node appears in the central part of the county, with smaller concentrations toward the western and southwestern side. The pattern is sparse compared with a heavily urban county, but the map still makes the local centers and connecting lines easy to distinguish.
The 4.33% developed-cover figure should not be confused with either 0.79% mean imperviousness or the 0.25% share above 50% impervious cover. “Developed” is a land-cover class that can include low-intensity areas with vegetation between buildings and pavement. Imperviousness measures the fraction of a surface occupied by materials such as pavement and rooftops. A residential area with lawns can therefore count as developed while having a much lower impervious fraction than a parking lot or dense commercial block.
Reading the 1985–2025 class-difference map without overstating change
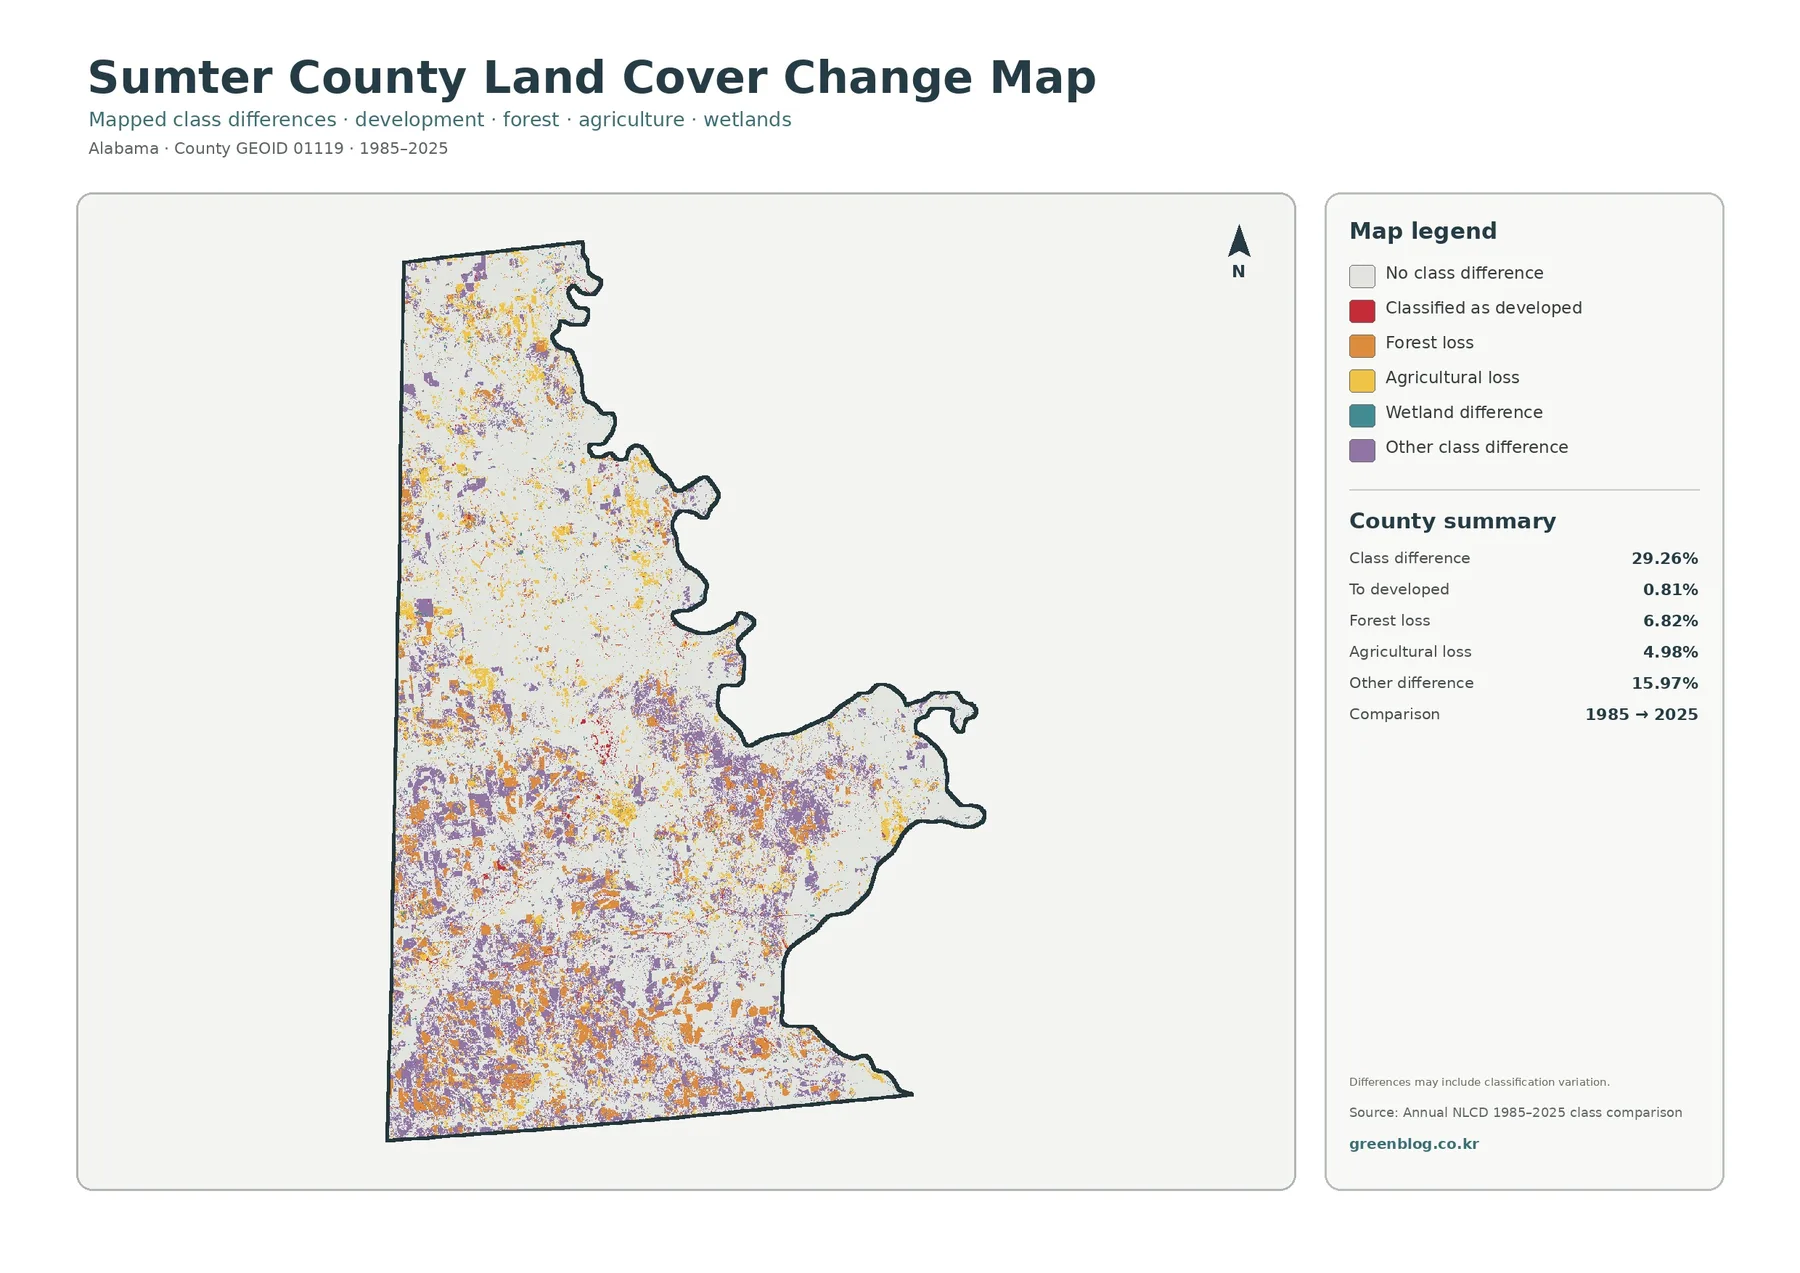
The 29.26% class-difference value is not a development rate. It means that a substantial share of mapped cells did not remain in the same broad class between the two comparison dates. The summary separately identifies 0.81% as change to developed, 6.82% as forest loss, 4.98% as agricultural loss, and 15.97% as other class difference. The legend also includes wetland difference. Keeping those categories separate prevents the overall difference number from being interpreted as if nearly three-tenths of the county became urban.
Change colors are scattered across much of the county rather than confined to one edge. Orange and purple patches are noticeable in the south and central areas, while agricultural-loss and other-difference colors also appear within the northern agricultural zone. Red developed-change cells are much less extensive and tend to occur as small clusters or narrow features. Large pale areas indicate cells that remained in the same mapped class at the two comparison dates.
The map itself warns that differences may include classification variation. That caution is important when comparing datasets four decades apart. Changes in observation conditions, classification methods, or mixed pixels can move a cell from one class to another even where the real-world transition is subtle. In a county where forest, wetlands, and agriculture meet along many irregular boundaries, small edge differences should be treated more cautiously than broad, coherent areas of change.
A practical way to use the four maps together
Start with the general 2025 map when the question is simply what covers Sumter County today. It establishes the forest majority, the unusually large wetland share, and the broad agricultural presence in the north. Move to the forest-and-farmland map when the task requires a closer look at cropland, pasture or hay, shrub or grass cover, water, and wetlands. Use the impervious map when the subject shifts to roads, rooftops, and developed concentrations. Finish with the change view if the project asks where the 1985 and 2025 classifications differ.
All four views have limits. Annual NLCD uses raster classification, so individual cells generalize the ground and may contain more than one real surface type. The maps do not show zoning, ownership, property lines, building permits, soil productivity, protected status, or legal wetlands. They also represent the stated observation years, not conditions after those dates. When a decision depends on a current parcel or a regulated boundary, consult the responsible local, state, or federal source rather than relying on these county-scale images.
Download the four Sumter County land-cover JPG files
Frequently Asked Questions
Does a land-cover class tell me how a property is zoned or used legally?
No. Annual NLCD classifies the physical cover visible at the surface. Forest, agriculture, wetland, or developed colors do not establish ownership, zoning, buildability, parcel boundaries, or permitted land use. Those questions require current local property and planning records.
Does the 24.75% wetland share represent the county’s flood-hazard area?
No. It is the share classified in wetland land-cover categories for the 2025 map. It is not a FEMA flood zone, a forecast of flooding, or a regulatory wetland delineation. Use official flood, water-level, and jurisdictional wetland sources for safety or permitting decisions.
Did 29.26% of Sumter County become developed between 1985 and 2025?
No. The map reports 29.26% total class difference, while only 0.81% is specifically listed as change to developed. Forest loss, agricultural loss, wetland difference, other class changes, and possible classification variation make up the rest of the comparison.
What is included in the download?
The ZIP contains four 2480 × 1754 JPG images: the 2025 general land-cover map, forest-and-farmland map, impervious-surface and developed-land map, and the 1985–2025 land-cover change map. The WebP images in the article are previews rather than the downloadable originals.
Map File Information
Sumter County Land Cover Map Files
- Included Files: Use only the versions confirmed in the article and supplied images
- File Type: Use the confirmed download contents
- Intended Use: Printing, education, presentations, and map-based projects
Related Maps
- Autauga County Alabama Land Cover Map
- Baldwin County Alabama Land Cover Map
- Barbour County Alabama Land Cover Map
Sources and reference links
- MRLC Annual NLCD Data — official land-cover and impervious-surface data access
- USGS Annual NLCD Land Cover Classification — definitions and interpretation of land-cover classes
- U.S. Census Bureau TIGER/Line Shapefiles — county boundary reference
- USDA 2022 Census of Agriculture: Sumter County — county-specific farm, cropland, pasture, and woodland context
- Alabama Department of Environmental Management: Tombigbee River Basin — watershed context for the river passing through Sumter County
Green Map creates custom-edited map images using open geographic data sources such as geoBoundaries, Natural Earth, OpenStreetMap, and government open data.
These maps are edited visual materials, not raw data files, and are provided for education, documents, presentations, and graphic reference.