Barbour County’s 2025 land-cover maps show a county where forest is the dominant surface but not the only story. Forest covers 50.42% of the mapped area, while agriculture, wetlands, grassland, shrubland, water, and developed land create a broad patchwork. The eastern edge beside the Chattahoochee River looks especially different from the interior because water, wetlands, Eufaula’s developed area, and nearby open land appear close together.
This page compares four views: general land cover, forest and farmland, fractional impervious surface, and mapped class differences from 1985 to 2025. The four original JPG maps are available in one download for teaching, presentations, county comparisons, and landscape-scale reference. They show what covers the ground; they do not show parcel ownership, zoning, building rights, or legal land use.
Table of Contents
A forest-dominant county with a distinct eastern river corridor
Barbour County lies in southeastern Alabama along the Georgia line. Trusted regional references identify Clayton as the county seat and Eufaula as the largest city, while the Chattahoochee River forms the important eastern water corridor. That setting is easy to recognize in the supplied maps. Broad forest occupies much of the center and north, agricultural and open-land patches are scattered through the south and west, and the eastern boundary carries water, wetlands, and the clearest developed concentration.
The U.S. Fish and Wildlife Service describes Eufaula National Wildlife Refuge, north of Eufaula along both banks of the Chattahoochee, as a mosaic of wetlands, croplands, woodlands, old fields, grasslands, and open water. That description provides useful context for the eastern side of the map, where several cover types sit close together. It does not mean every colored cell belongs to the refuge; it simply helps explain why the river edge is more varied than a single forest or urban band.
The 2025 land-cover map: half forest, with agriculture and wetlands adding contrast
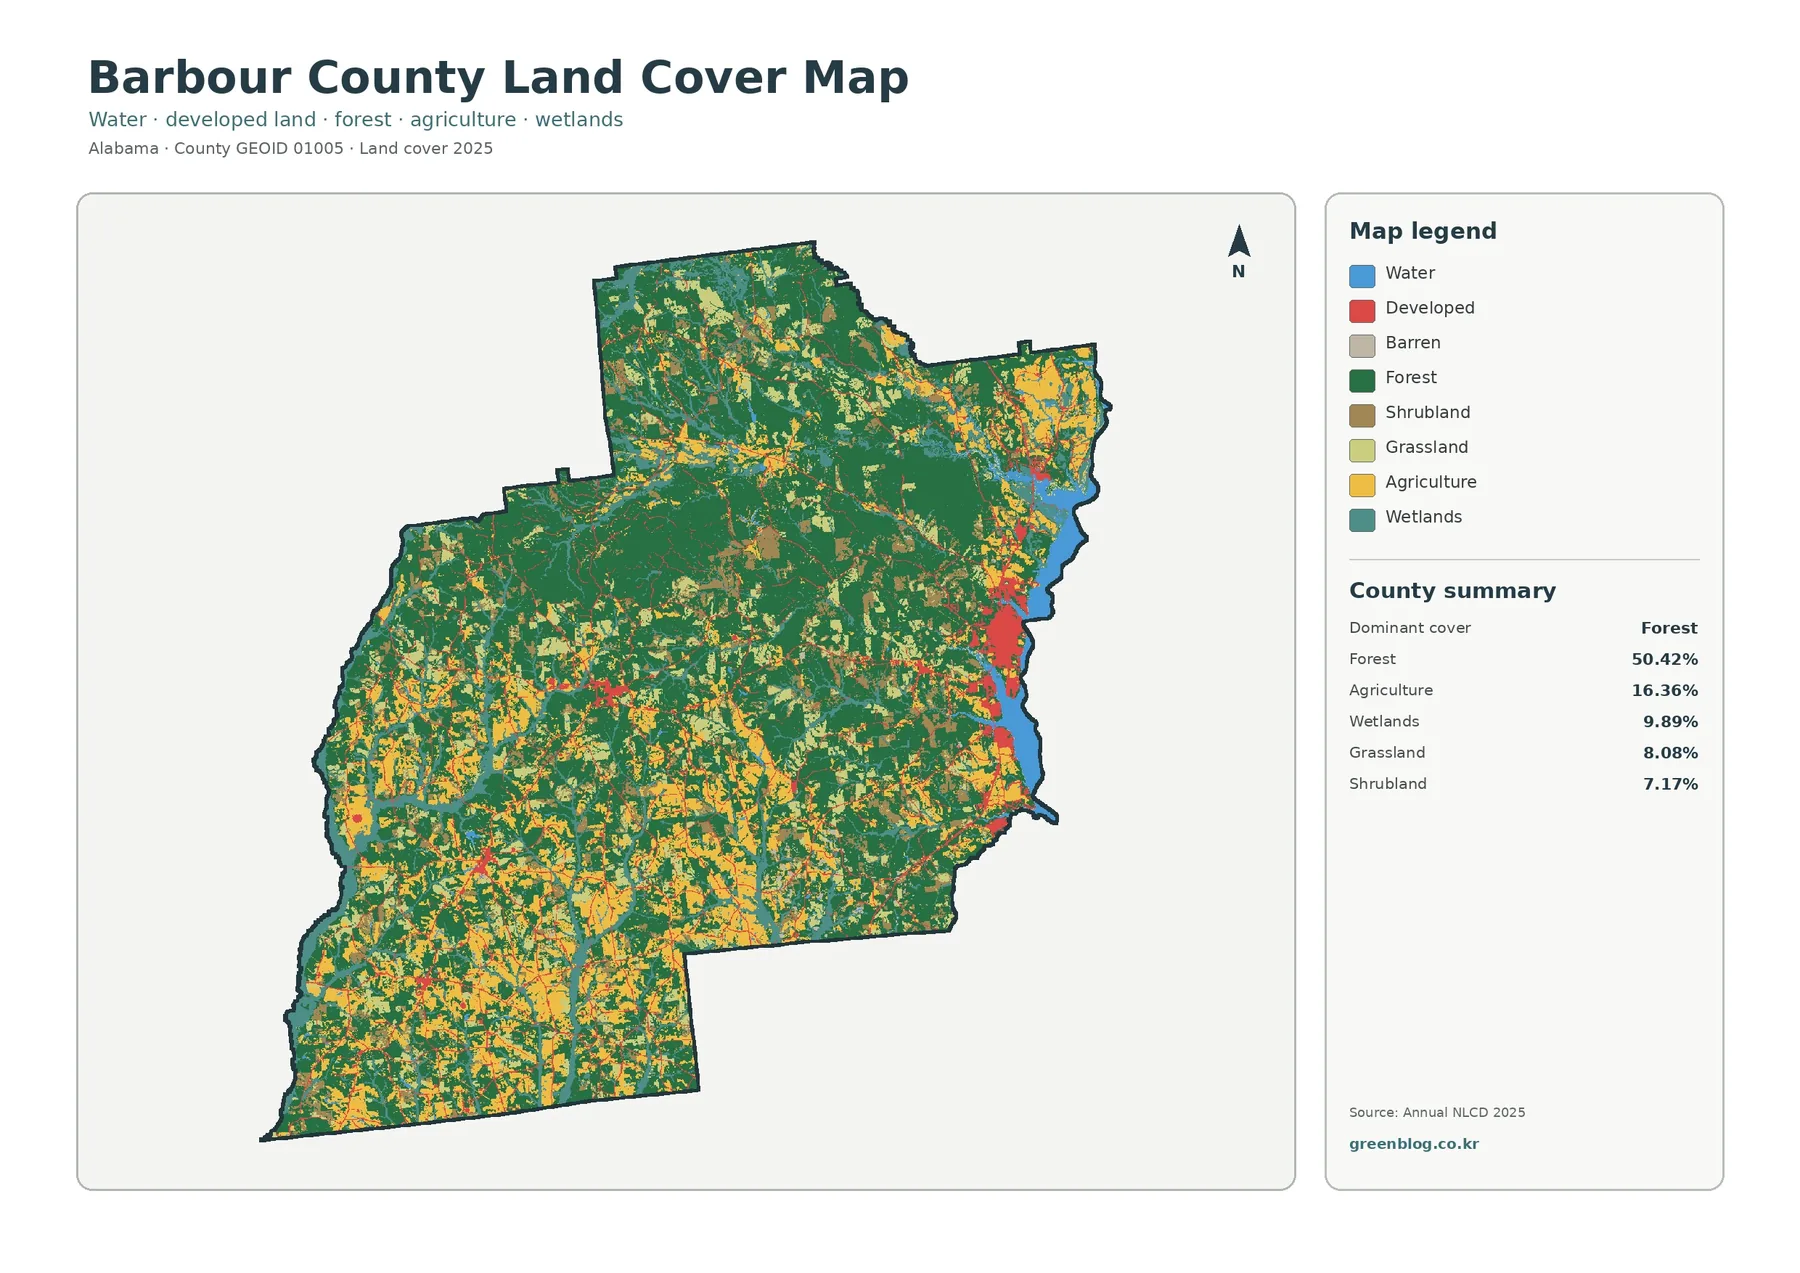
The county summary lists forest at 50.42%, agriculture at 16.36%, wetlands at 9.89%, grassland at 8.08%, shrubland at 7.17%, and water at 2.21%. Developed cover is 5.71% in the companion impervious-map summary. These figures explain why dark green dominates the image without creating one solid block. Yellow agricultural areas recur in the south, southwest, north, and northeast, while open grass and shrub classes break up the wooded pattern. Along the eastern boundary, blue water and wetland colors become more noticeable, and developed land is concentrated around Eufaula.
Forest and farmland are interwoven rather than divided into two large zones
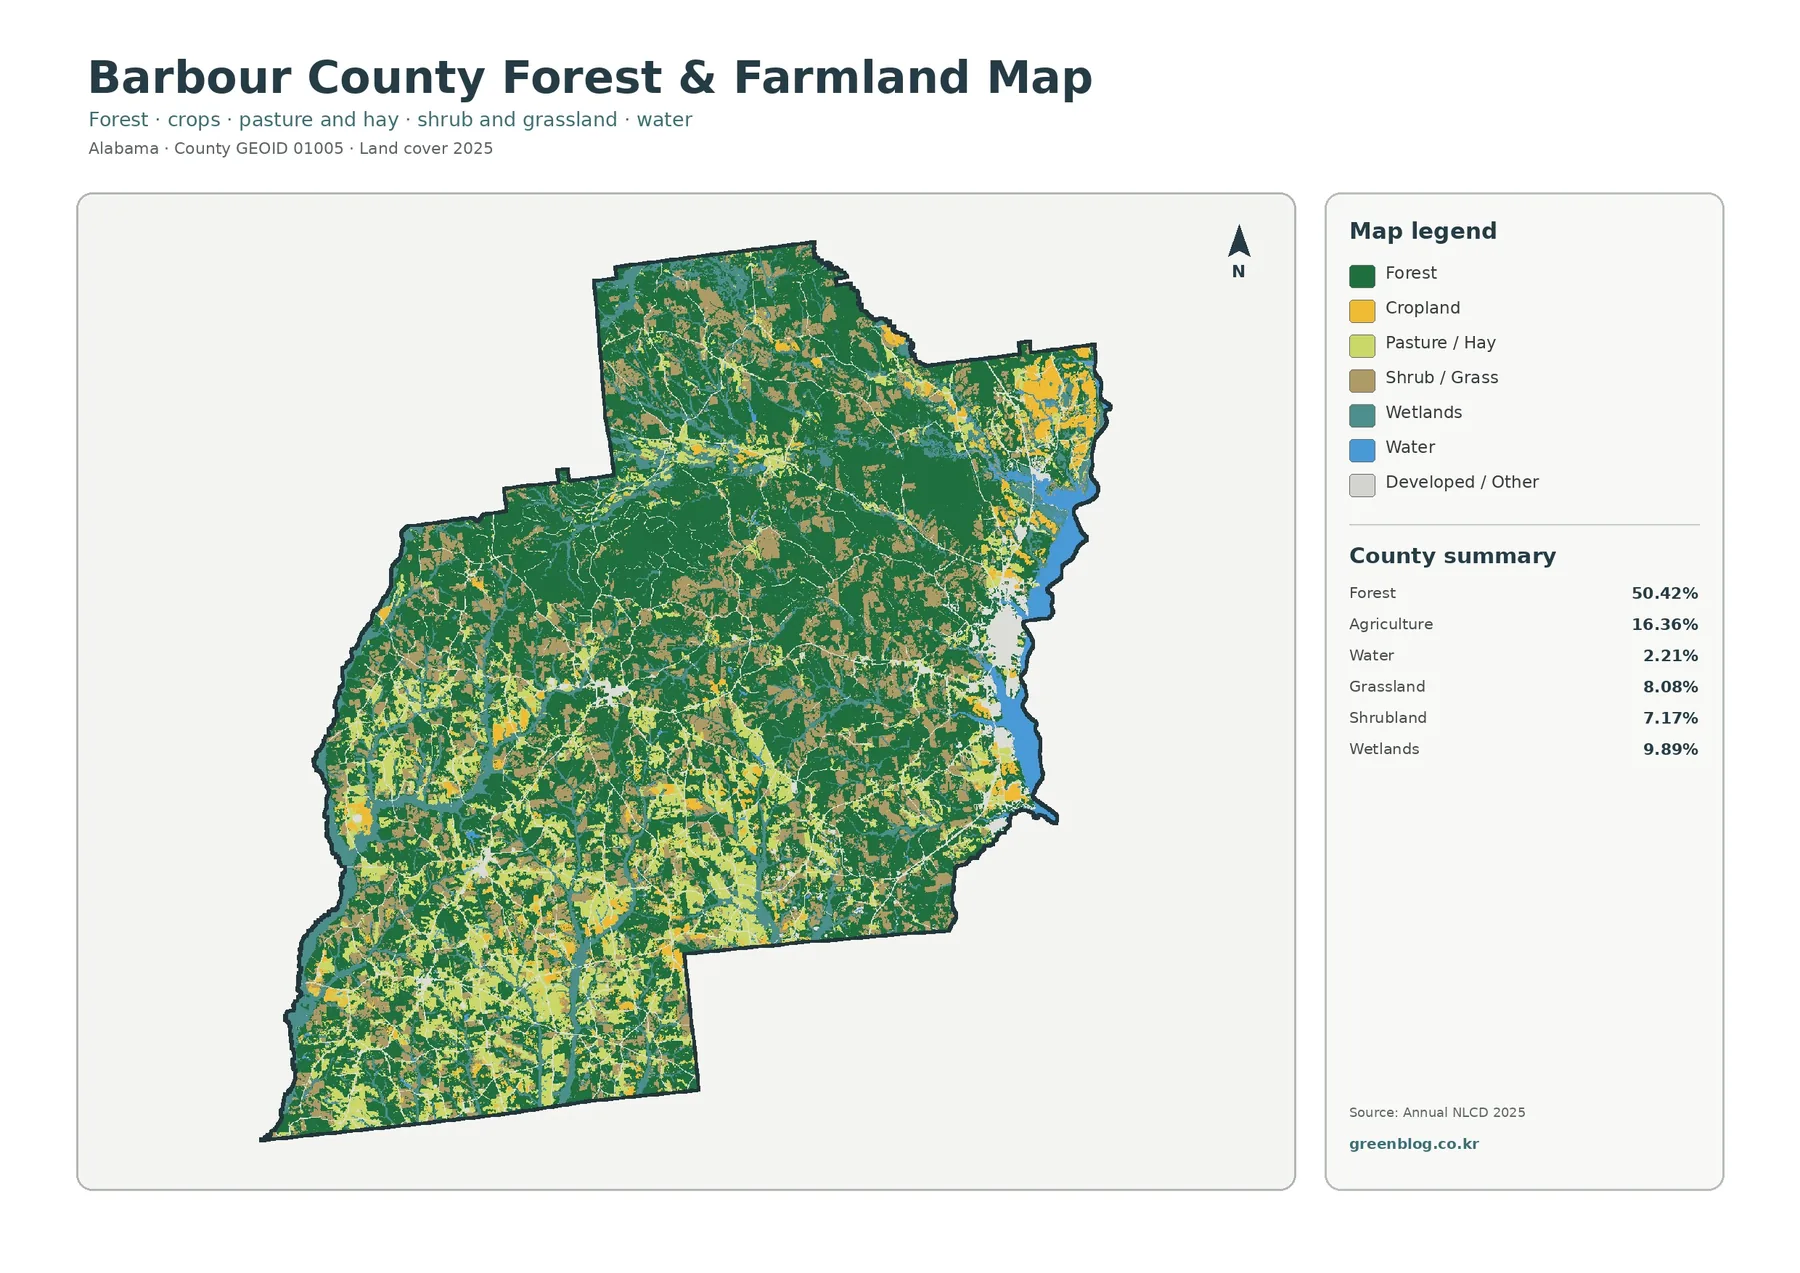
The forest-and-farmland view makes the rural pattern easier to see. Forest remains broadest across the central and northern portions, while agricultural and pasture-like colors appear as many separate pieces instead of one continuous farm belt. Agriculture accounts for 16.36%, but grassland at 8.08% and shrubland at 7.17% are also important when reading lighter open areas. The map does not identify crop types, ownership, or whether a field is actively cultivated in a particular season, so those details require separate agricultural records.
Impervious surfaces are concentrated around Eufaula and narrow linear corridors
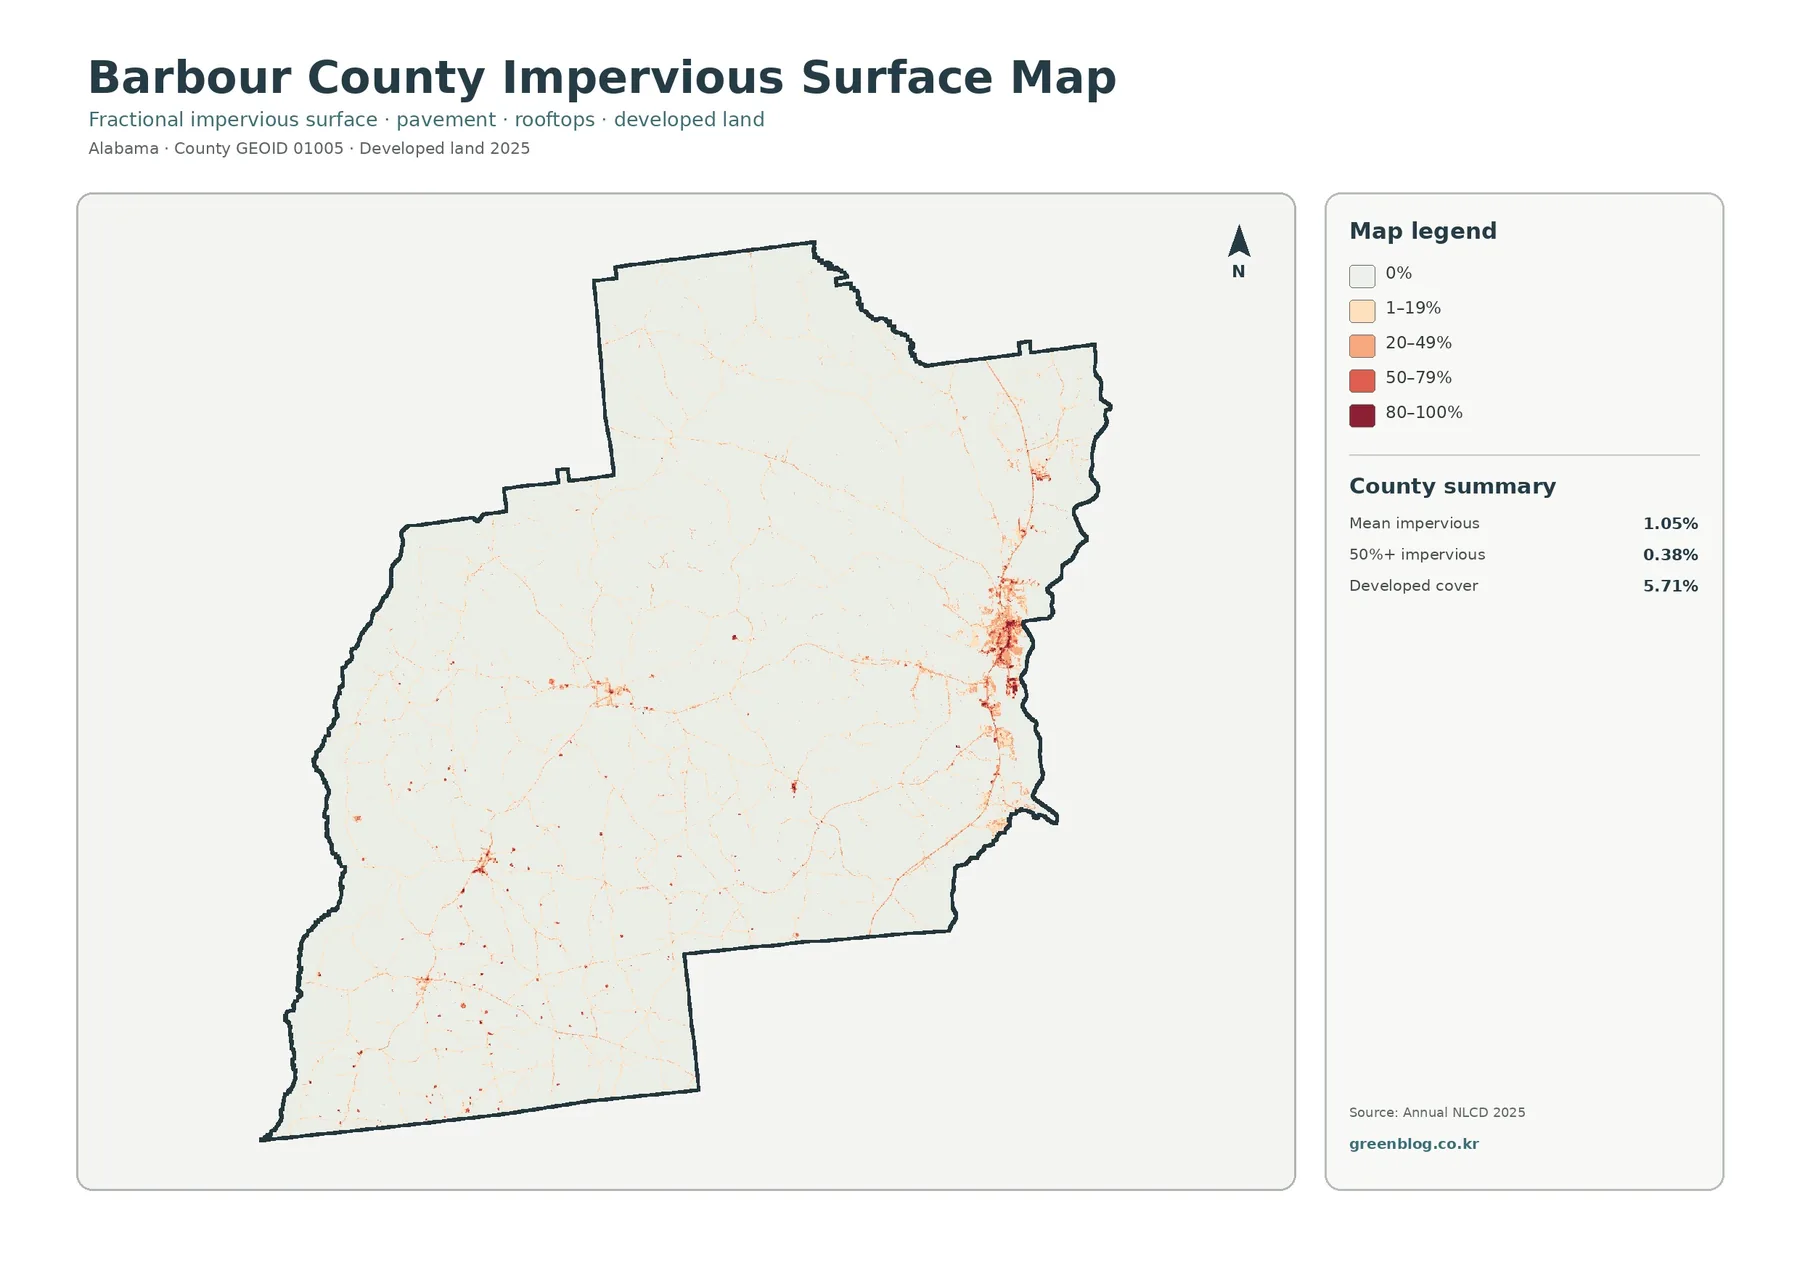
Impervious surface means rooftops, pavement, parking areas, and other surfaces that water does not readily soak through. Barbour County’s mean impervious value is 1.05%, while only 0.38% of the county is mapped at 50% or more impervious. Most of the image is therefore pale. The strongest colors collect in the east-central area around Eufaula and extend outward in thin, road-like lines; smaller points and short lines are scattered elsewhere.
Developed cover and impervious percentage are related but different. Developed cover is 5.71%, much higher than the 1.05% mean impervious value, because developed classes can include lawns, trees, and open ground mixed with buildings and pavement. The map supports saying that hard surfaces are more concentrated near Eufaula and transportation-like corridors, but it does not identify every road or prove that a road caused nearby development.
The 1985–2025 map shows class differences, not a simple development map
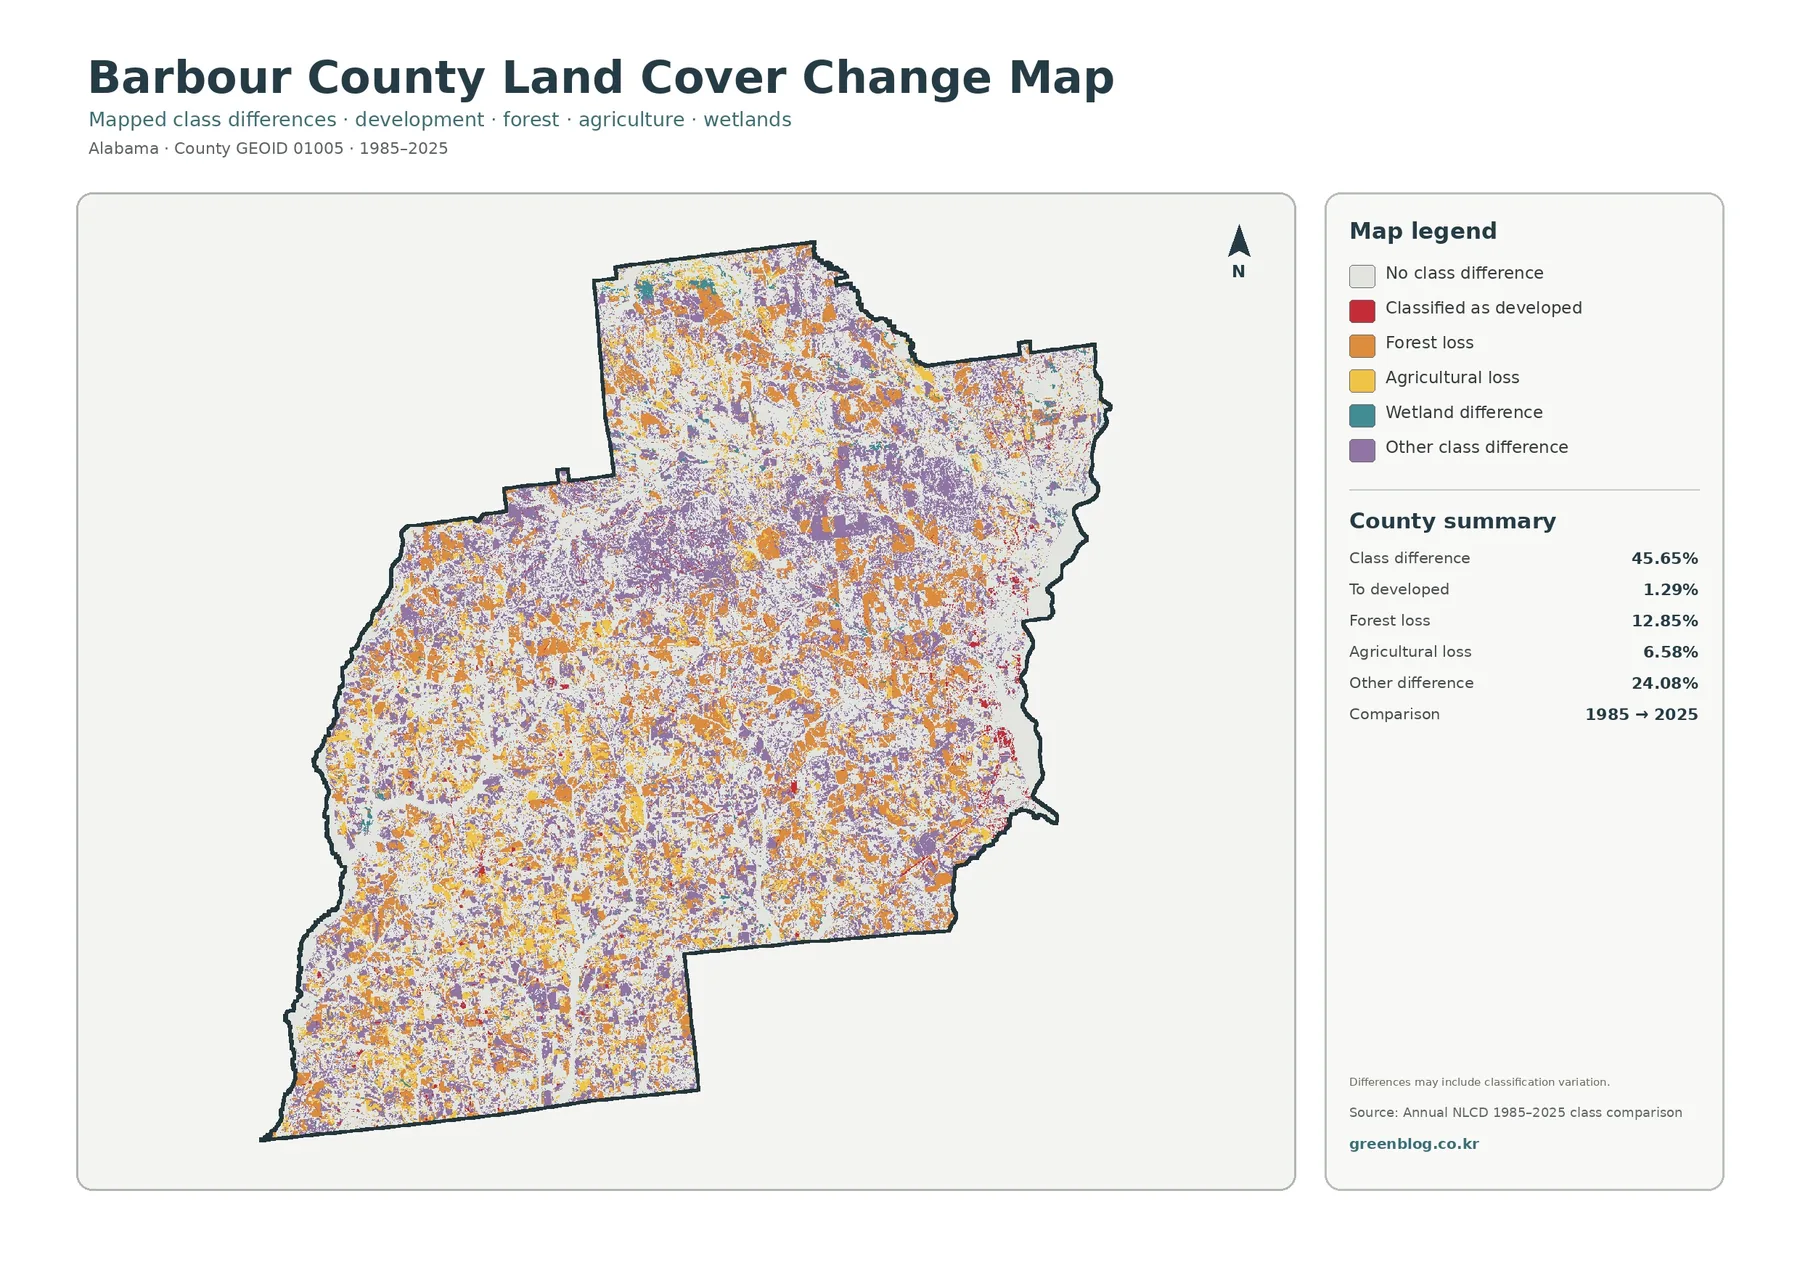
The comparison summarizes 45.65% of the county as having a class difference between 1985 and 2025. The labeled categories include 1.29% changing to developed, 12.85% forest loss, 6.58% agricultural loss, and 24.08% other class difference. The legend also includes wetland difference, but the summary panel does not provide its percentage, so no extra value should be invented. Orange forest-loss and purple other-difference pixels are spread widely, while red change-to-developed pixels are much less extensive and stand out most near the eastern urban concentration.
These colors describe differences between two classifications. The supplied map itself warns that some differences may include classification variation. A forest-loss label therefore should not be treated as automatic proof of permanent clearing, and a change pixel does not reveal the cause. The map is best used to identify places that deserve a closer look with intermediate Annual NLCD years, aerial imagery, local records, or field information.
How to use the four maps together
The general map is the quickest way to see the full mixture of forest, agriculture, wetlands, water, open cover, and development. The forest-and-farmland version makes wooded and rural open areas easier to compare. The impervious view isolates built and paved surfaces that are visually minor on the broader map. The change map adds a time comparison after the current pattern is understood. For a class or presentation, that sequence keeps the story clear without forcing every category into one crowded image.
Download the four original JPG maps
The download ZIP contains the 2025 general land-cover map, forest-and-farmland map, impervious-surface map, and 1985–2025 land-cover change map as original JPG files. Keeping the set together makes it easier to move from current cover to a focused rural or developed view and then to the long-term comparison without searching for separate files.
Scale and classification limits
Annual NLCD is a raster product derived from satellite imagery at 30-meter spatial resolution. A raster divides the landscape into grid cells, so narrow roads, small streams, tree lines, yards, and small buildings can be generalized or mixed with nearby cover. The 2025 map also represents that mapping year only, and the 1985–2025 endpoint comparison does not record every intermediate transition. These maps are appropriate for landscape patterns and county comparisons, not for surveying a parcel or making legal, engineering, zoning, or permitting decisions.
Frequently Asked Questions
Why does the map look so mixed if forest covers 50.42% of Barbour County?
Forest is the largest single class, but almost half the county remains in other categories. Agriculture, wetlands, grassland, shrubland, water, and developed cover are spread through many separate patches, so they repeatedly interrupt the forest color. A dominant class does not have to form one uninterrupted block.
Why is developed cover 5.71% when mean impervious surface is only 1.05%?
Developed land can include buildings, pavement, lawns, trees, and other open ground within the same classified area. Fractional impervious surface focuses more directly on hard surfaces that water does not readily penetrate. Low-density development can therefore count as developed while still containing a large amount of permeable ground.
Does the 45.65% class-difference value mean almost half the county was cleared or built over?
No. The 45.65% figure includes several kinds of class differences between 1985 and 2025. Only 1.29% is labeled as changing to developed, and the map also contains forest, agricultural, wetland, and other differences. Classification variation may contribute to some changes, so important sites should be checked with additional years or local evidence.
Map File Information
Barbour County land cover map JPG download
- Included Files: Use only the versions confirmed in the article and supplied images
- File Type: Use the confirmed download contents
- Intended Use: Printing, education, presentations, and map-based projects
Related Maps
- Autauga County Alabama Land Cover Map
- Baldwin County Alabama Land Cover Map
- Download a Franklin County Alabama Map
Sources and further reading
Percentages and mapped-change values follow the supplied Barbour County images. The links below provide official data documentation, county boundary resources, and local context for the Chattahoochee River and Barbour County resource topics.
- MRLC Annual NLCD Data – official access to Annual NLCD land-cover and related products.
- USGS Annual NLCD Collection 1.2 Land Cover – documentation for the 30-meter raster product and the 2025 extension.
- U.S. Census Bureau TIGER/Line Shapefiles – official county boundary and geographic data resources.
- U.S. Fish & Wildlife Service – Eufaula National Wildlife Refuge – local information on Chattahoochee River wetlands, croplands, woodlands, grasslands, and open water.
- Alabama Cooperative Extension System – Barbour County – local forestry, agriculture, wildlife, and natural-resource Extension information.
Green Map creates custom-edited map images using open geographic data sources such as geoBoundaries, Natural Earth, OpenStreetMap, and government open data.
These maps are edited visual materials, not raw data files, and are provided for education, documents, presentations, and graphic reference.