Quitman County sits in southwest Georgia beside the Alabama state line, with Georgetown serving as the county seat and the broad Walter F. George Reservoir shaping much of the western side. The four maps on this page separate the county into useful layers: the general county map shows the boundary, roads, and named places; the city map identifies the main urban center; the water map traces the reservoir and a dense network of creeks; and the elevation map shows how ridges rise above the creek valleys. High-resolution A3 JPG versions of all four maps are available together in one ZIP from the map file box below.
The county can look deceptively simple on a basic reference map because there is one clearly ranked city and a relatively small number of named settlements. The terrain and water maps tell a fuller story. Low ground follows the reservoir edge and major drainage lines, while higher ridges occupy much of the central and northeastern interior. Looking at the same outline through these different themes makes it easier to understand why Georgetown, the lake edge, and the creek valleys are the most useful anchors for reading Quitman County.
Table of Contents
Georgetown anchors the road pattern beside the reservoir
The general county map places Georgetown near the western side of Quitman County, close to the large water body that follows the Georgia–Alabama boundary. The Quitman County Courthouse is marked near town, and several main roads branch away from Georgetown toward the north, northeast, southeast, and south. The map is not intended to replace a detailed highway atlas, but the road arrangement makes Georgetown the clearest starting point for understanding how travel routes spread across the county.
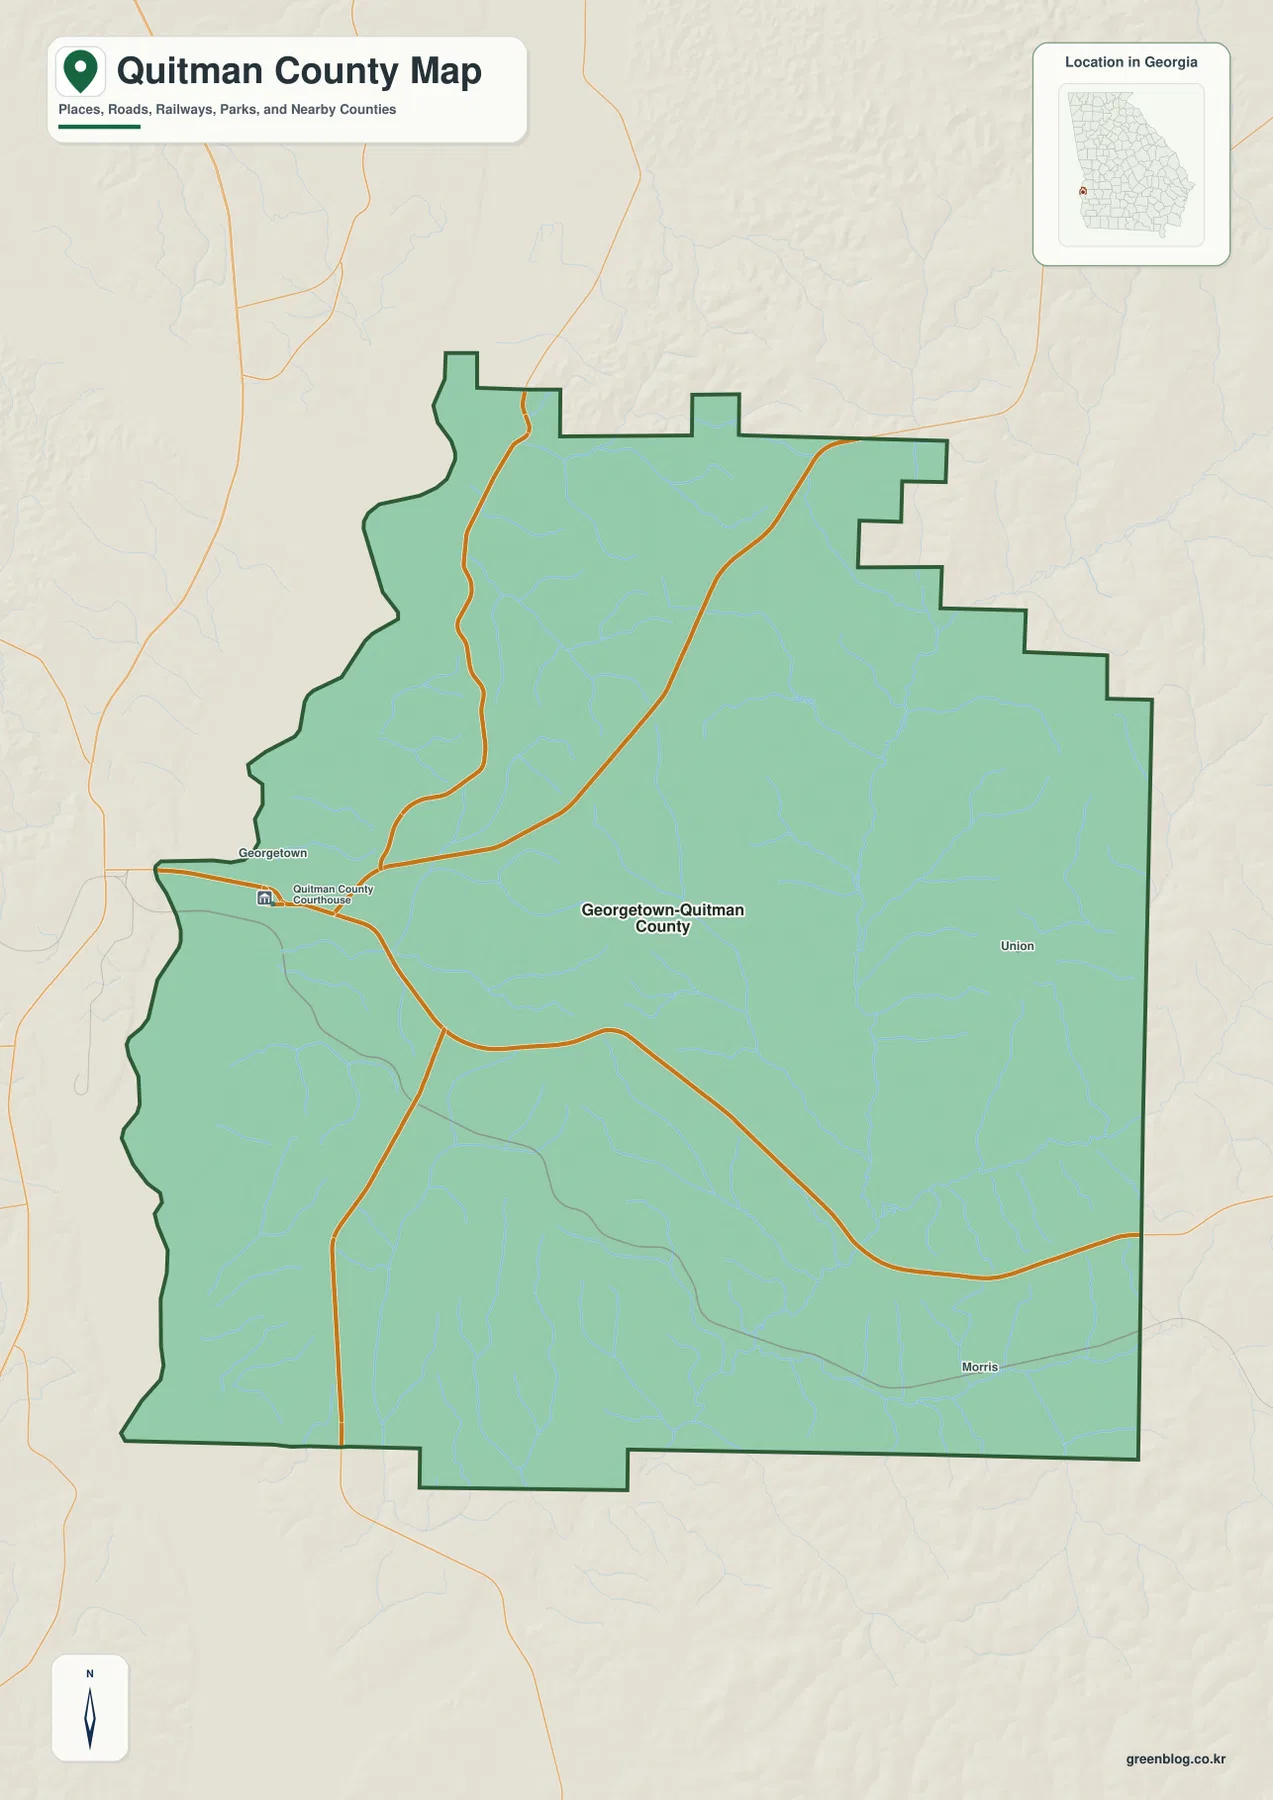
The same map also labels Union in the eastern part of the county and Morris toward the southeast. Those names matter because they show that the county is more than a single town, even though Georgetown dominates the city ranking map. From the Georgetown area, the county extends a considerable distance eastward across a rural interior crossed by roads and small streams. This eastward spread is easy to miss if the county is described only as a Chattahoochee River border county.
The western outline is especially distinctive because it does not read as a simple straight land boundary. Water occupies a large part of the edge, and the shoreline creates bends and inlets near the county. Existing county background material identifies this water as Lake Walter F. George, a reservoir on the Chattahoochee River. That setting helps explain why Georgetown is best understood as both the administrative center of Quitman County and a community positioned close to a major reservoir along the state boundary.
One ranked city, but a county much larger than Georgetown
The city distribution map ranks only one major city: Georgetown-Quitman County. A single numbered marker is placed inside the county, and the CITY INDEX at the bottom lists Georgetown as the first and only ranked urban center. This does not mean that every other place name has disappeared from the county. Rather, the map is deliberately selective, showing the strongest city reference instead of treating every community or crossroads as an equal urban center.
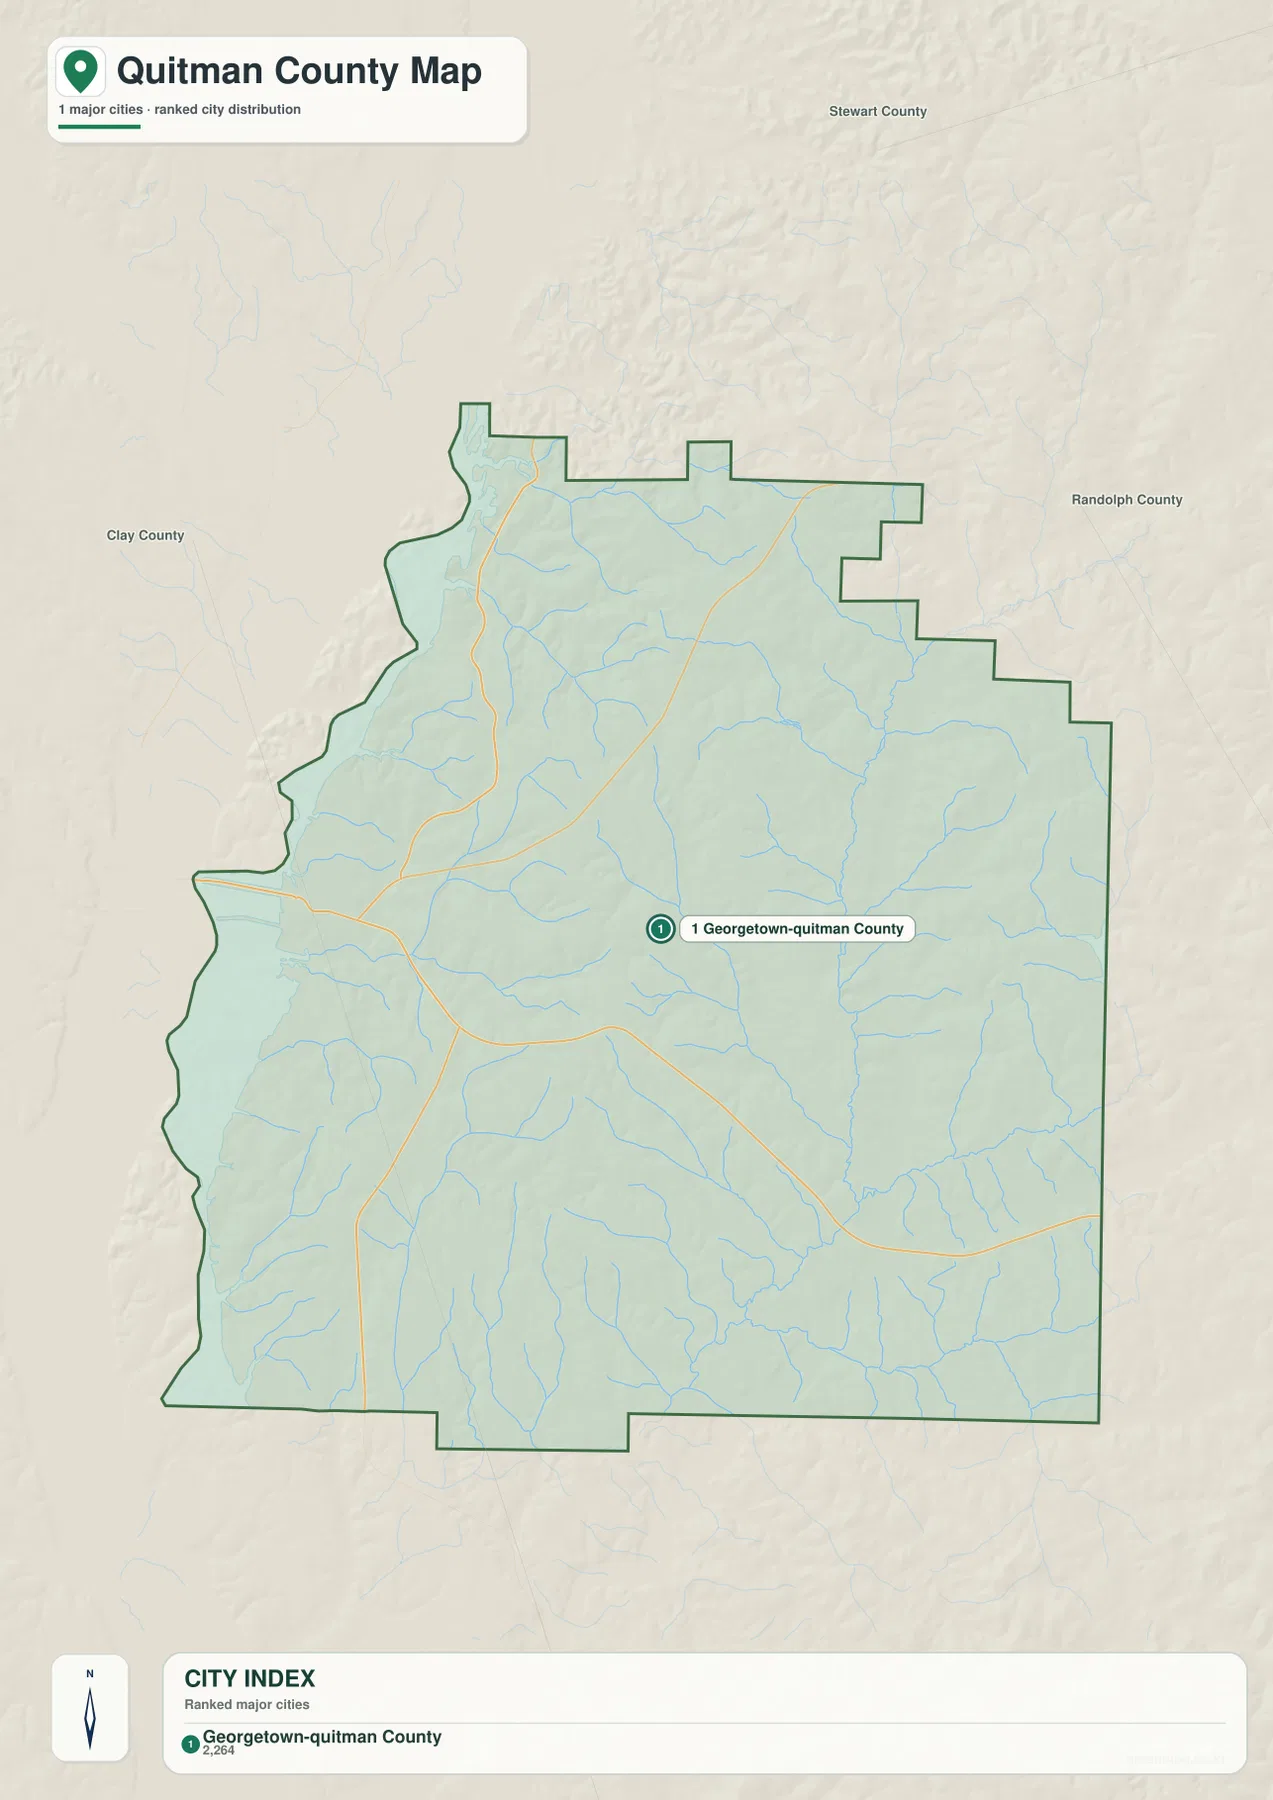
Nearby county names provide extra orientation. Stewart County appears to the north, Randolph County to the northeast, and Clay County is shown on the western side of the surrounding map area. These labels help a reader understand the county in a wider southwest Georgia setting without crowding the map with a long list of local communities. Used together with the general county map, the city map answers a simple but important question: where is the main recognized town within the county outline?
For a small rural county, that distinction is more useful than a long city table. Georgetown is close to the reservoir side of the county, while much of the remaining land stretches east and southeast through a landscape of roads, creeks, and rolling ground. If a reader needs every unincorporated community, street, parcel, or municipal limit, a more detailed local source is necessary. This map instead gives a clear county-scale city reference without implying a level of detail that is not present.
Walter F. George Reservoir and the creeks that cross the interior
The water map changes the visual emphasis immediately. The Walter F. George Reservoir dominates the western edge, with wide blue water and narrow arms reaching toward the county boundary. The shoreline is broad enough to define the western landscape at county scale, while the interior is filled with a branching network of smaller streams. This combination of a large reservoir and many creek valleys is one of the most distinctive features in the supplied maps.
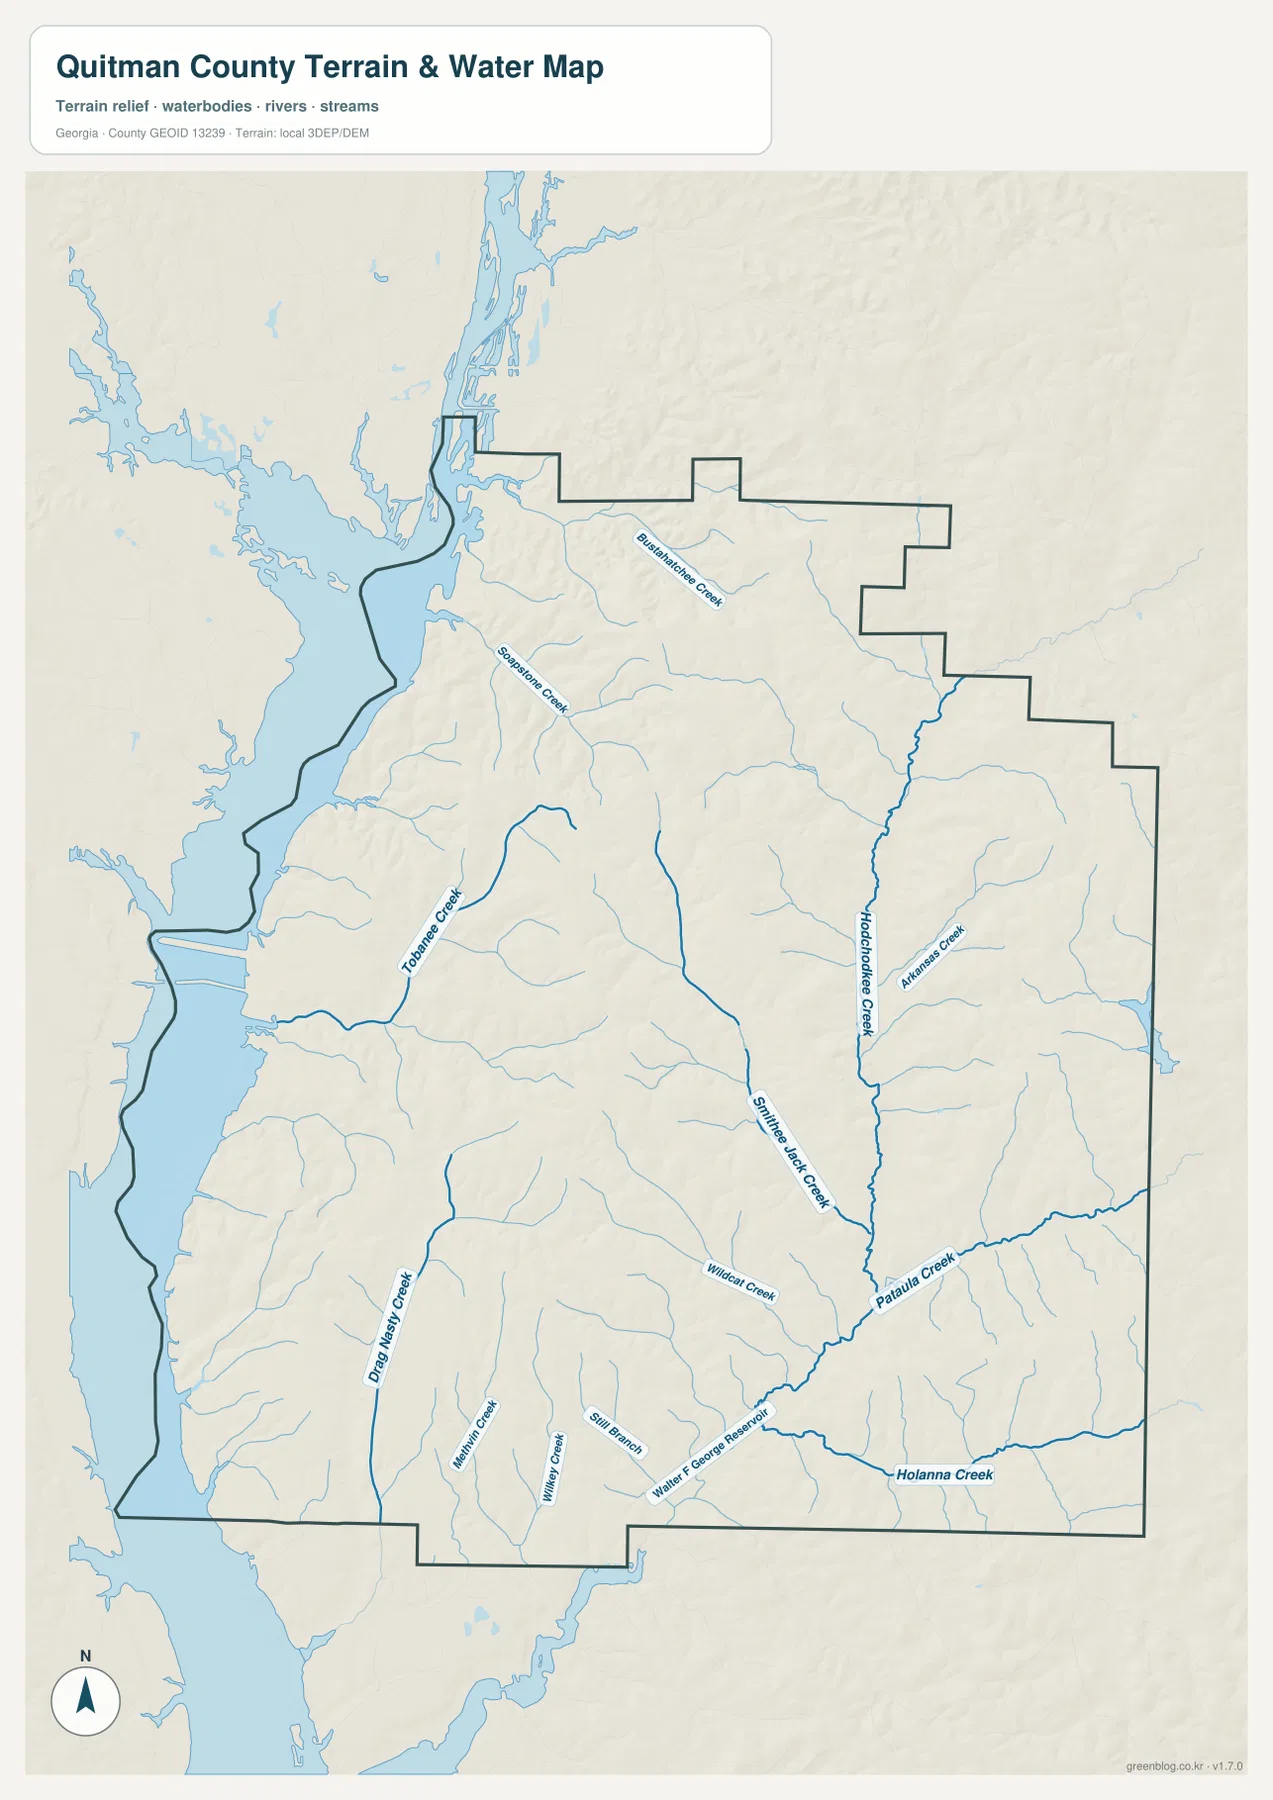
Several stream names are readable on the map. Tobannee Creek runs through the western half, while Hodchodkee Creek forms a long north–south line in the eastern interior. Patula Creek becomes prominent in the southeast, and Holanna Creek continues across the southern part of the county. Wildcat Creek appears near the center, with Bushwhackers Creek in the north and Drag Nasty Creek in the southwest. The number of named streams helps explain why the terrain map is cut by so many narrow valleys instead of appearing as one smooth upland surface.
These waterways are useful for orientation because they divide the rural interior into recognizable drainage corridors. A road-only map may make the county look like a simple block extending east from Georgetown, but the hydrography reveals a much more dissected landscape. Hodchodkee Creek and Patula Creek, for example, occupy long low corridors that become even clearer on the elevation map. The western reservoir edge provides the largest water reference, while the interior creeks show how water continues to shape the county well away from the shoreline.
The map should be read as a county-scale water reference, not as a flood map or navigation chart. It does not provide flood-zone boundaries, water depth, channel conditions, boat access, parcel ownership, or legally surveyed shoreline limits. Those questions require specialized official products. Here, the useful information is the relative position of the reservoir, named creeks, and smaller tributaries across the county.
Ridges rise above a 57–176 meter elevation range
The elevation map reports an actual county range of roughly 57 to 176 meters, with a mean elevation of about 103 meters. Darker green marks the lower ground, while tan and brown tones identify the higher ridges. The lowest areas are widespread along the western reservoir side and in creek valleys, whereas higher terrain becomes more prominent through the center and northeast. Quitman County is not a mountain county, but the relief is strong enough to create a repeating ridge-and-valley texture across much of the interior.
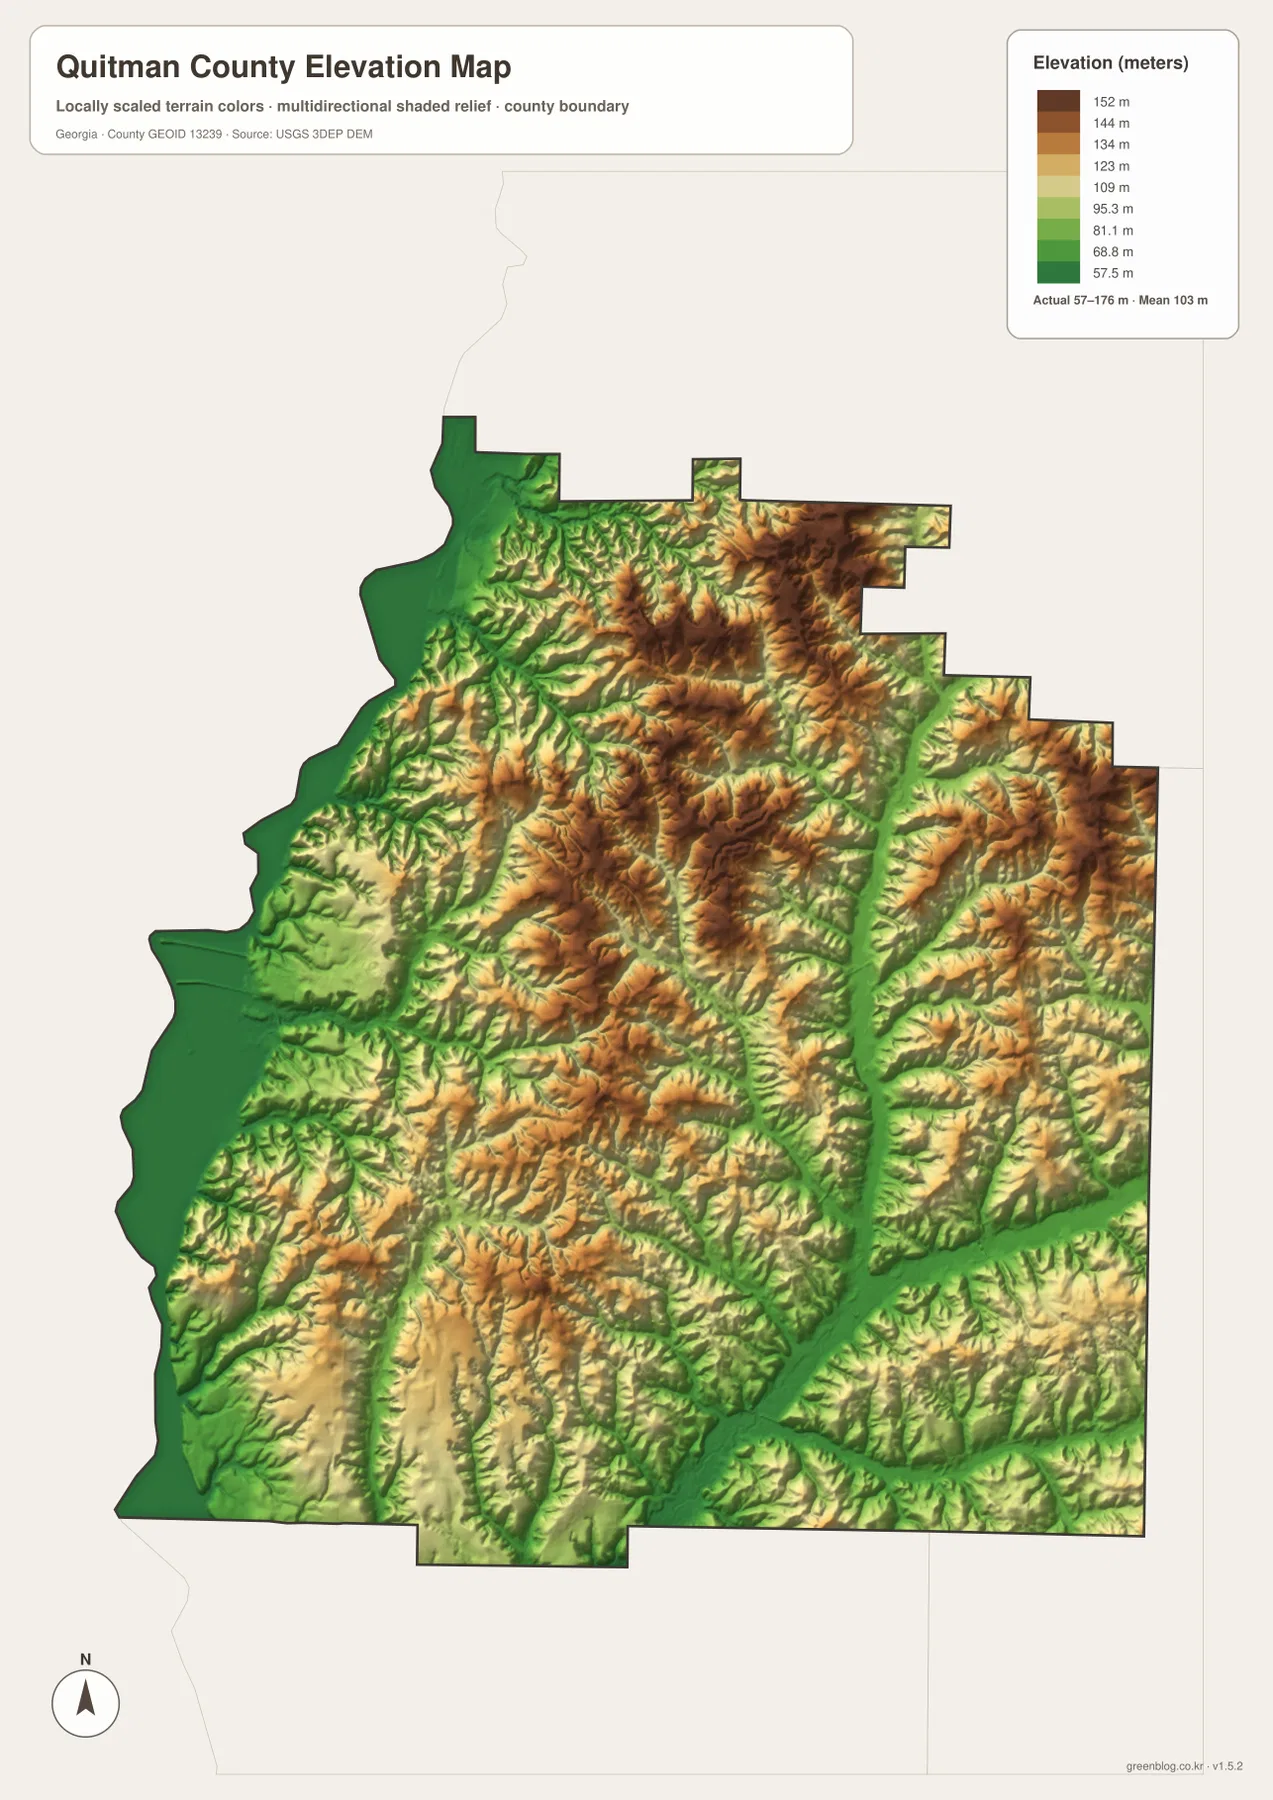
The northern and northeastern portions contain some of the broadest patches of higher brown terrain. Between those uplands, green fingers extend inland along drainage lines. The center of the county is similarly broken into several ridges rather than one continuous high plateau. Toward the southeast, low corridors associated with Patula Creek and Holanna Creek stand out, and the western edge drops toward the reservoir. These patterns make the water and elevation maps especially useful when viewed side by side.
The relationship between terrain and drainage is visible without needing technical contour analysis. Where a major creek forms a long line on the water map, the elevation map often shows a corresponding lower valley. Higher ridges occupy the spaces between those drainage corridors. This is a broad visual comparison rather than an engineering measurement, but it gives readers a practical explanation for why the county contains so many branching creeks and why the reservoir-side landscape differs from the inland uplands.
Because the elevation surface is generalized for county-scale viewing, it should not be used for site design, construction, drainage engineering, or survey work. The color scale is best for comparing higher and lower areas across the whole county. For classroom work, a regional report, or general geographic orientation, the map provides enough detail to show the contrast between the low reservoir margin, creek valleys, and the more elevated interior ridges.
What the four maps reveal when compared together
Each map answers a different part of the same geographic question. The county reference map is the fastest way to locate Georgetown, the courthouse area, main roads, and named places such as Union and Morris. The city map strips that information down further and makes Georgetown the only ranked urban center. The water map then shifts attention away from settlements and roads to the reservoir and a dense creek network, while the elevation map explains the ridges and valleys underneath those streams.
For a reader trying to understand Quitman County for the first time, a useful order is to begin with Georgetown on the county map, then compare the city map to see how strongly the town dominates the urban pattern. After that, the water map shows why the western boundary and rural interior are closely tied to water, and the elevation map clarifies why the interior is divided into narrow valleys and higher ridges. This sequence builds a more complete picture than any one map can provide on its own.
The maps are also useful for choosing the right illustration for a particular purpose. A report about county location and access should start with the county map. A short profile of settlement distribution can use the city map. A discussion of the Chattahoochee reservoir setting or named creeks is better served by the water map, and a terrain comparison should use the elevation map. The downloadable ZIP keeps all four JPG files together so readers can select the map that fits the subject instead of forcing one image to carry every type of information.
A small county shaped by a state-line reservoir and rural uplands
Existing county background material notes that Quitman County was established in 1858 and identifies Georgetown as the county seat. It also connects the county with Lake Walter F. George, fishing, forestry, agriculture, and the Alabama border. The supplied maps do not attempt to map every industry, recreation site, or historical feature, but they provide the geographic frame that makes those descriptions easier to understand.
The clearest example is the relationship between Georgetown and the reservoir. A written description may say that Georgetown lies near the Alabama line, but the county and water maps show why that matters: the town sits close to the broad reservoir edge while most of the county extends eastward into a rural network of creeks and ridges. The landscape therefore changes quickly from the western waterside setting to the inland uplands.
The small labels on the county map and the neighboring county names on the city map add another layer of context. Union and Morris show that named rural places are spread beyond Georgetown, while Stewart, Randolph, and Clay counties place Quitman County within a wider southwest Georgia region. Taken together with the reservoir and creek network, these details keep the page from reducing the county to a single town or a single lake.
Frequently Asked Questions
What is the main city and county seat shown on the maps?
Georgetown is the county seat and the only ranked major city on the supplied city distribution map. The general county map also shows other named places such as Union and Morris, but they are not ranked as major cities in that map set.
Where is the Walter F. George Reservoir in relation to Quitman County?
The reservoir forms the dominant water feature along the western side of the county near the Georgia–Alabama boundary. Georgetown lies close to that western waterside setting, while most of the county extends eastward through creek valleys and higher rural terrain.
What files are included in the download ZIP?
The ZIP contains four high-resolution A3 JPG files: a county reference map, city map, water map, and elevation map. The images displayed in the article are WebP previews intended for faster web viewing.
Map File Information
The download contains four high-resolution A3 JPG maps of Quitman County: the county reference map, city map, water map, and elevation map. The article uses lighter WebP previews for faster viewing, while the ZIP keeps the larger JPG files together for printing or offline use.
- Included Files: County map, city map, water map, elevation map
- File Type: One ZIP containing four high-resolution A3 JPG files
Related Maps
Sources and References
These references support the county background and the boundary, water, and elevation context used in the map set. The article itself stays anchored to features visible in the supplied Quitman County maps.
- U.S. Census Bureau TIGER/Line Shapefiles – county boundaries and base geographic data
- USGS National Hydrography – rivers, creeks, reservoirs, and other water features
- USGS 3D Elevation Program – elevation and terrain data
- U.S. Census Bureau QuickFacts – Quitman County, Georgia
- The New Georgia Encyclopedia – Quitman County – county history and regional context
Green Map creates custom-edited map images using open geographic data sources such as geoBoundaries, Natural Earth, OpenStreetMap, and government open data. These maps are edited visual materials, not raw data files, and are provided for education, documents, presentations, and graphic reference.