Bethel Census Area is easiest to understand as a broad western Alaska region shaped by rivers, coastal water, scattered communities, and a long inland extension rather than by one continuous road network. The supplied Bethel Census Area Map places Bethel near the western half of the boundary and also labels communities such as Aniak, Quinhagak, Chefornak, Nightmute, Mekoryuk, and Platinum. A separate city index highlights six selected cities, while the terrain-and-water sheet names the Kuskokwim River, Kwethluk River, Kisaralik River, Eek River, Johnson River, Baird Inlet, and the Bering Sea. High-resolution JPG versions of the same three map subjects are available in the ZIP download near the end of this page.
The density of blue waterways is the first feature that makes this area look different from a typical road-centered county map. Streams and river channels spread across much of the outlined region, especially through the western and central portions. The Kuskokwim River gives the area a strong geographic reference line, while the western edge opens toward coastal lowlands and offshore land. To the east, the boundary stretches far inland toward rougher terrain. For a first reading, it is more useful to locate Bethel and the Kuskokwim River before trying to follow individual roads or smaller place names.
Table of Contents
Bethel anchors the western half while the census area extends far inland
On the general map, Bethel appears in the western half of the outlined census area where many waterways converge. Aniak lies farther to the northeast, while Quinhagak is positioned to the south near the coastal side. Platinum appears even farther south. West of Bethel, Chefornak and Nightmute are labeled closer to the coast, and Mekoryuk appears on a detached island area to the west. These labels make it clear that the important places are not arranged along one simple urban corridor. They are spread across a broad landscape of river channels, coastal land, and inland country.
The outline itself is also irregular. Its western side bends around coastal and island areas, while the eastern side forms a long, angular inland extension. Several labels outside the dark green boundary help orient the reader. Flat appears north of the census area, and names such as Naknek, King Salmon, South Naknek, and Ugashik appear well to the southeast. Those outside labels should not be read as communities inside Bethel Census Area. They function as surrounding reference points, so the dark green boundary remains the safest guide when distinguishing the target area from the broader Alaska basemap.
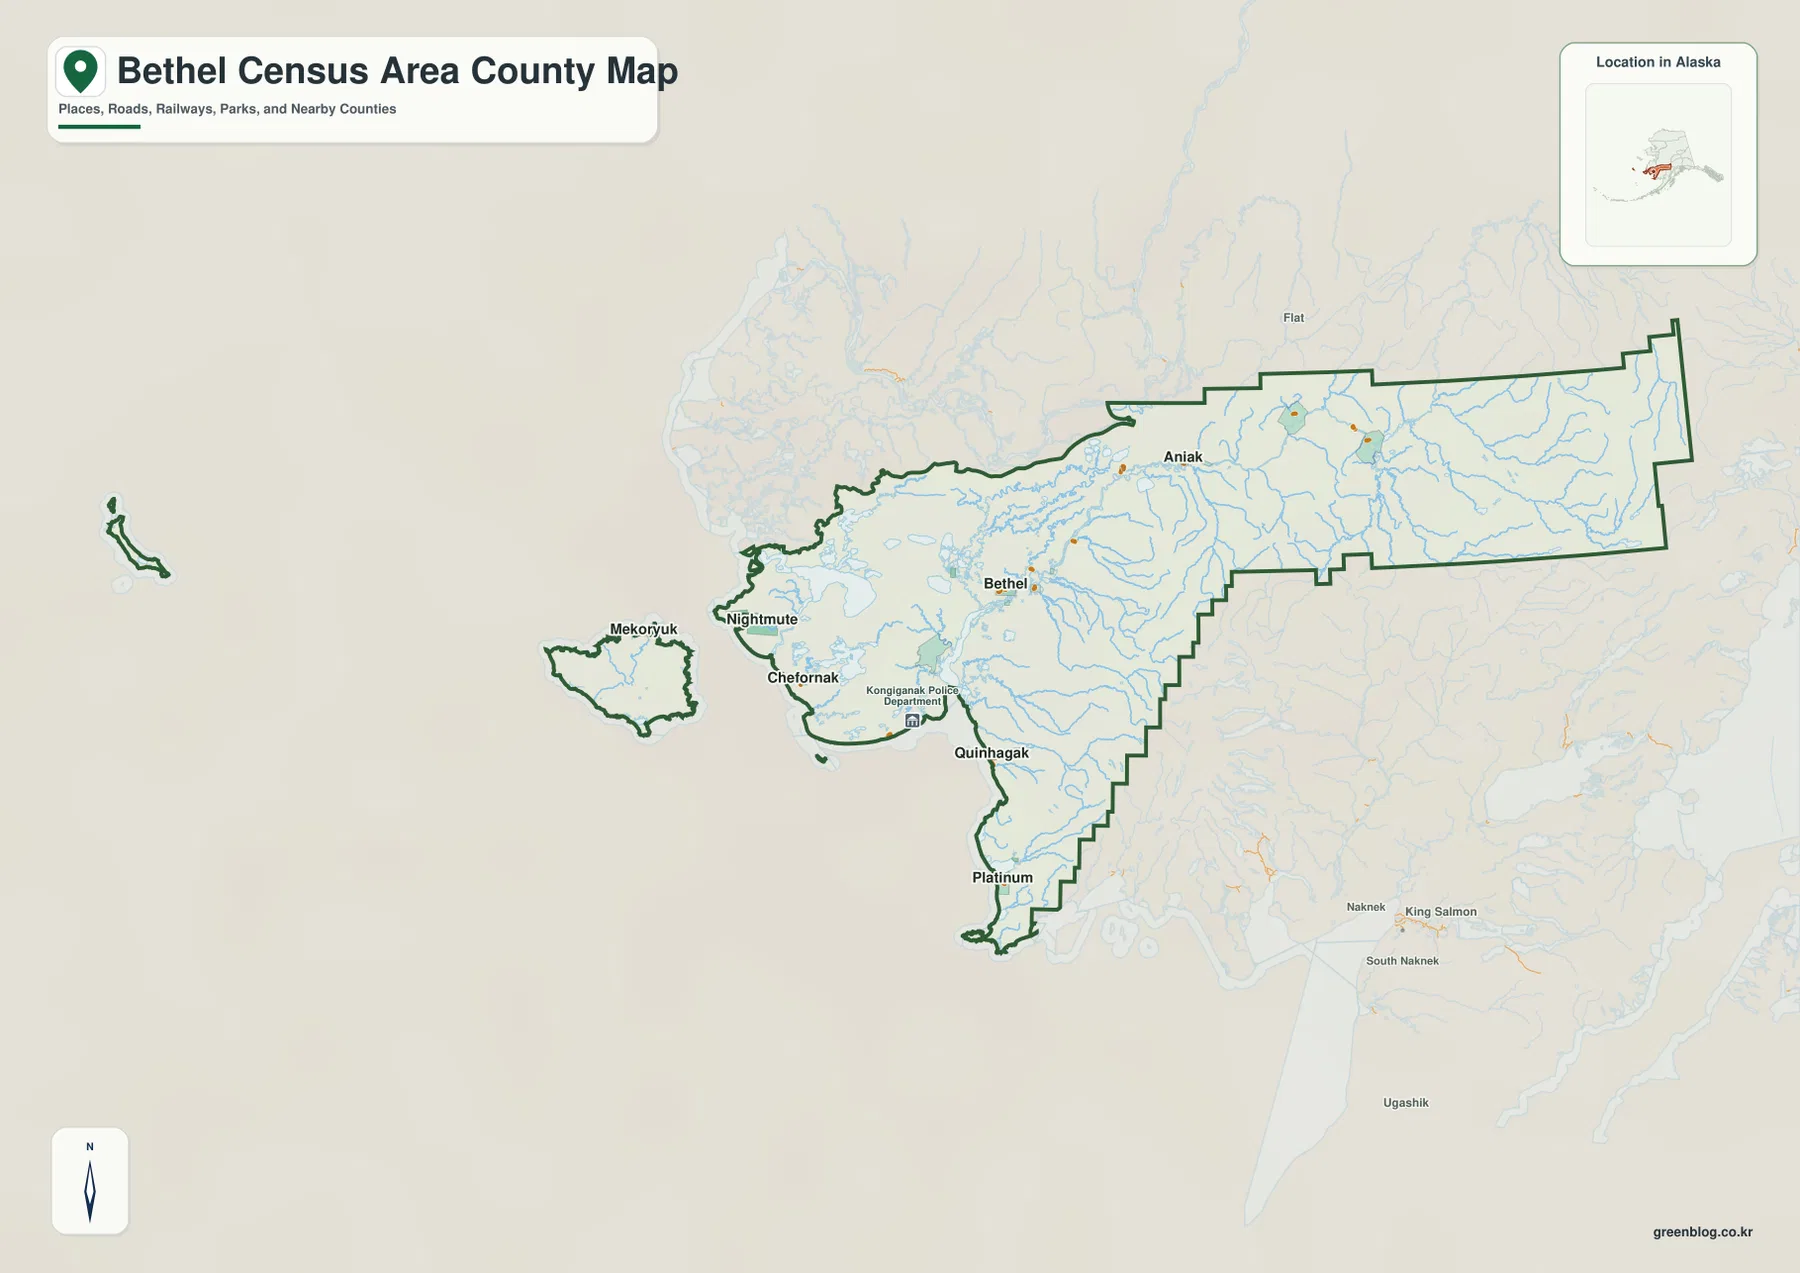
Road markings are visible around selected settlements, but they do not dominate the page in the way they would on a metropolitan county map. Blue river lines cover much more of the interior. That visual balance matters when using the sheet. A road-only reading can make the region seem empty between named places, while the hydrologic background shows that the landscape is heavily divided by water. For general orientation, compare the settlement labels with the nearest large river channels instead of expecting every important location to be connected by a continuous highlighted road network.
The six-city index shows a dispersed pattern around Bethel and the western coast
The city map ranks six selected places and prints a value beside each name. The displayed values are Bethel 6,312, Quinhagak 1,311, Kwethluk 975, Toksook Bay 833, Chefornak 620, and Nunapitchuk 618. These figures are read directly from the supplied CITY INDEX and are not replaced here with a separate current population estimate. Bethel receives the number-one marker near the center-west. Kwethluk and Nunapitchuk sit relatively close to the Bethel area, Quinhagak is farther south, and Chefornak and Toksook Bay are positioned toward the western coastal side.
The city index is not a complete list of every place shown on the general map. Aniak, Nightmute, Mekoryuk, and Platinum, for example, appear on the broader map but not in the six ranked city labels. That difference reflects the purpose of the sheets rather than a contradiction. Use the general map when you need a wider selection of place names and boundary context. Use the city index when you want a cleaner comparison of the selected six communities and their relative positions inside the census area.
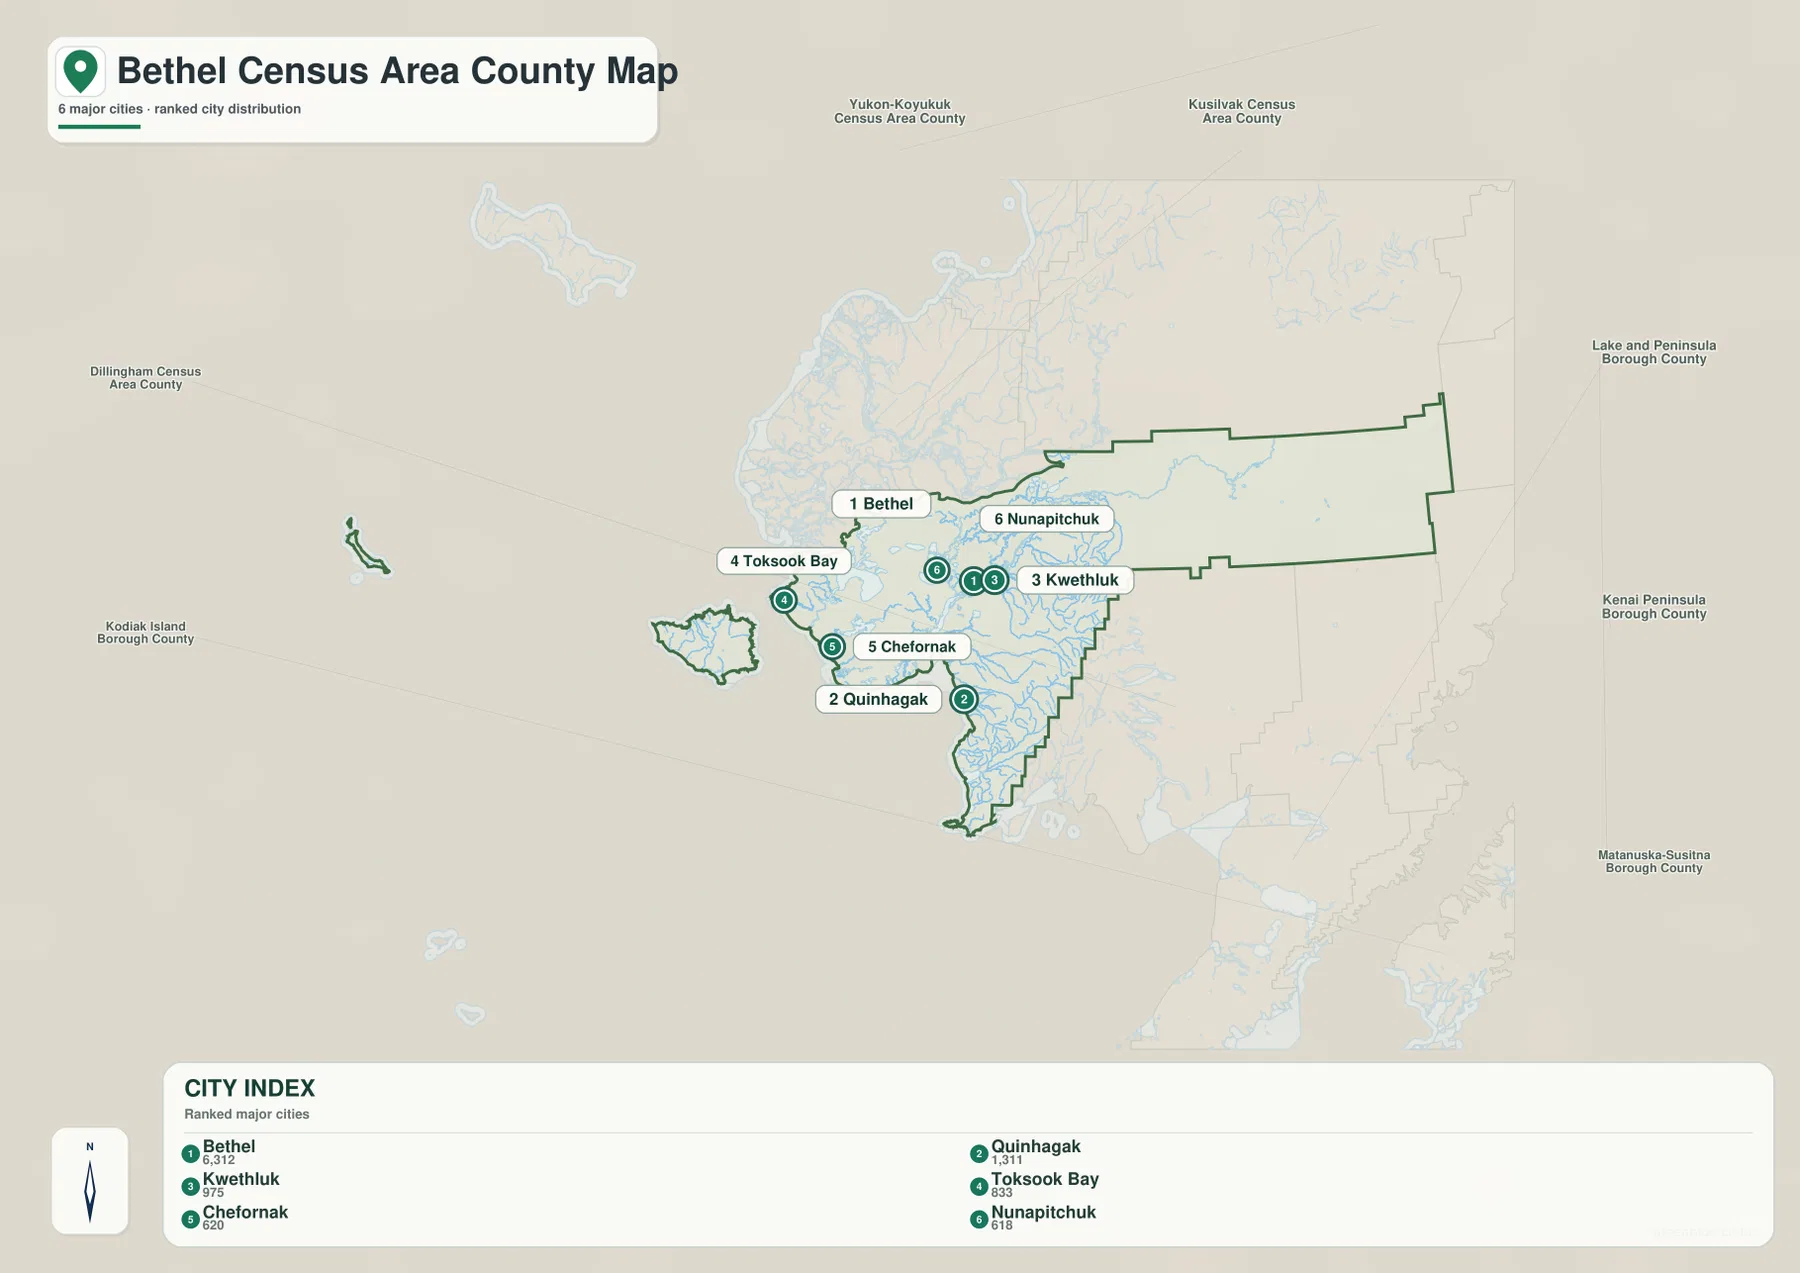
The spacing between those six markers is useful by itself. Bethel is the strongest central reference point, but the other selected communities do not cluster in a single tight urban group around it. Quinhagak lies well to the south. Toksook Bay and Chefornak are displaced toward the western side, while Kwethluk and Nunapitchuk sit in the river-rich interior around Bethel. The sheet therefore works best as a distribution map: it helps readers see which selected communities are near the Bethel area and which are separated toward the coast or farther south.
The Kuskokwim River and its tributaries dominate the water map
The terrain-and-water map gives the clearest explanation for the dense blue network visible on the other sheets. The Kuskokwim River runs through the center of the census area and is joined or approached by several named waterways. Johnson River is labeled to the west of the main river, while Kolavinarak River appears farther southwest. Kwethluk River and Kisaralik River are labeled in the central-southern portion, and Eek River appears still farther south. Talbiksok River is marked north of the Kuskokwim River in the eastern-central part of the map.
Moving toward the west, the water network spreads into a broad lowland with many channels and small water bodies. Baird Inlet is labeled near this coastal side, and the Bering Sea appears in the western inset. The relief background becomes more rugged toward the far eastern side of the census area, where ridges and valleys are more visible than in the flatter western lowlands. The sheet does not provide precise elevation numbers, but it does make the west-to-east terrain contrast easier to recognize.
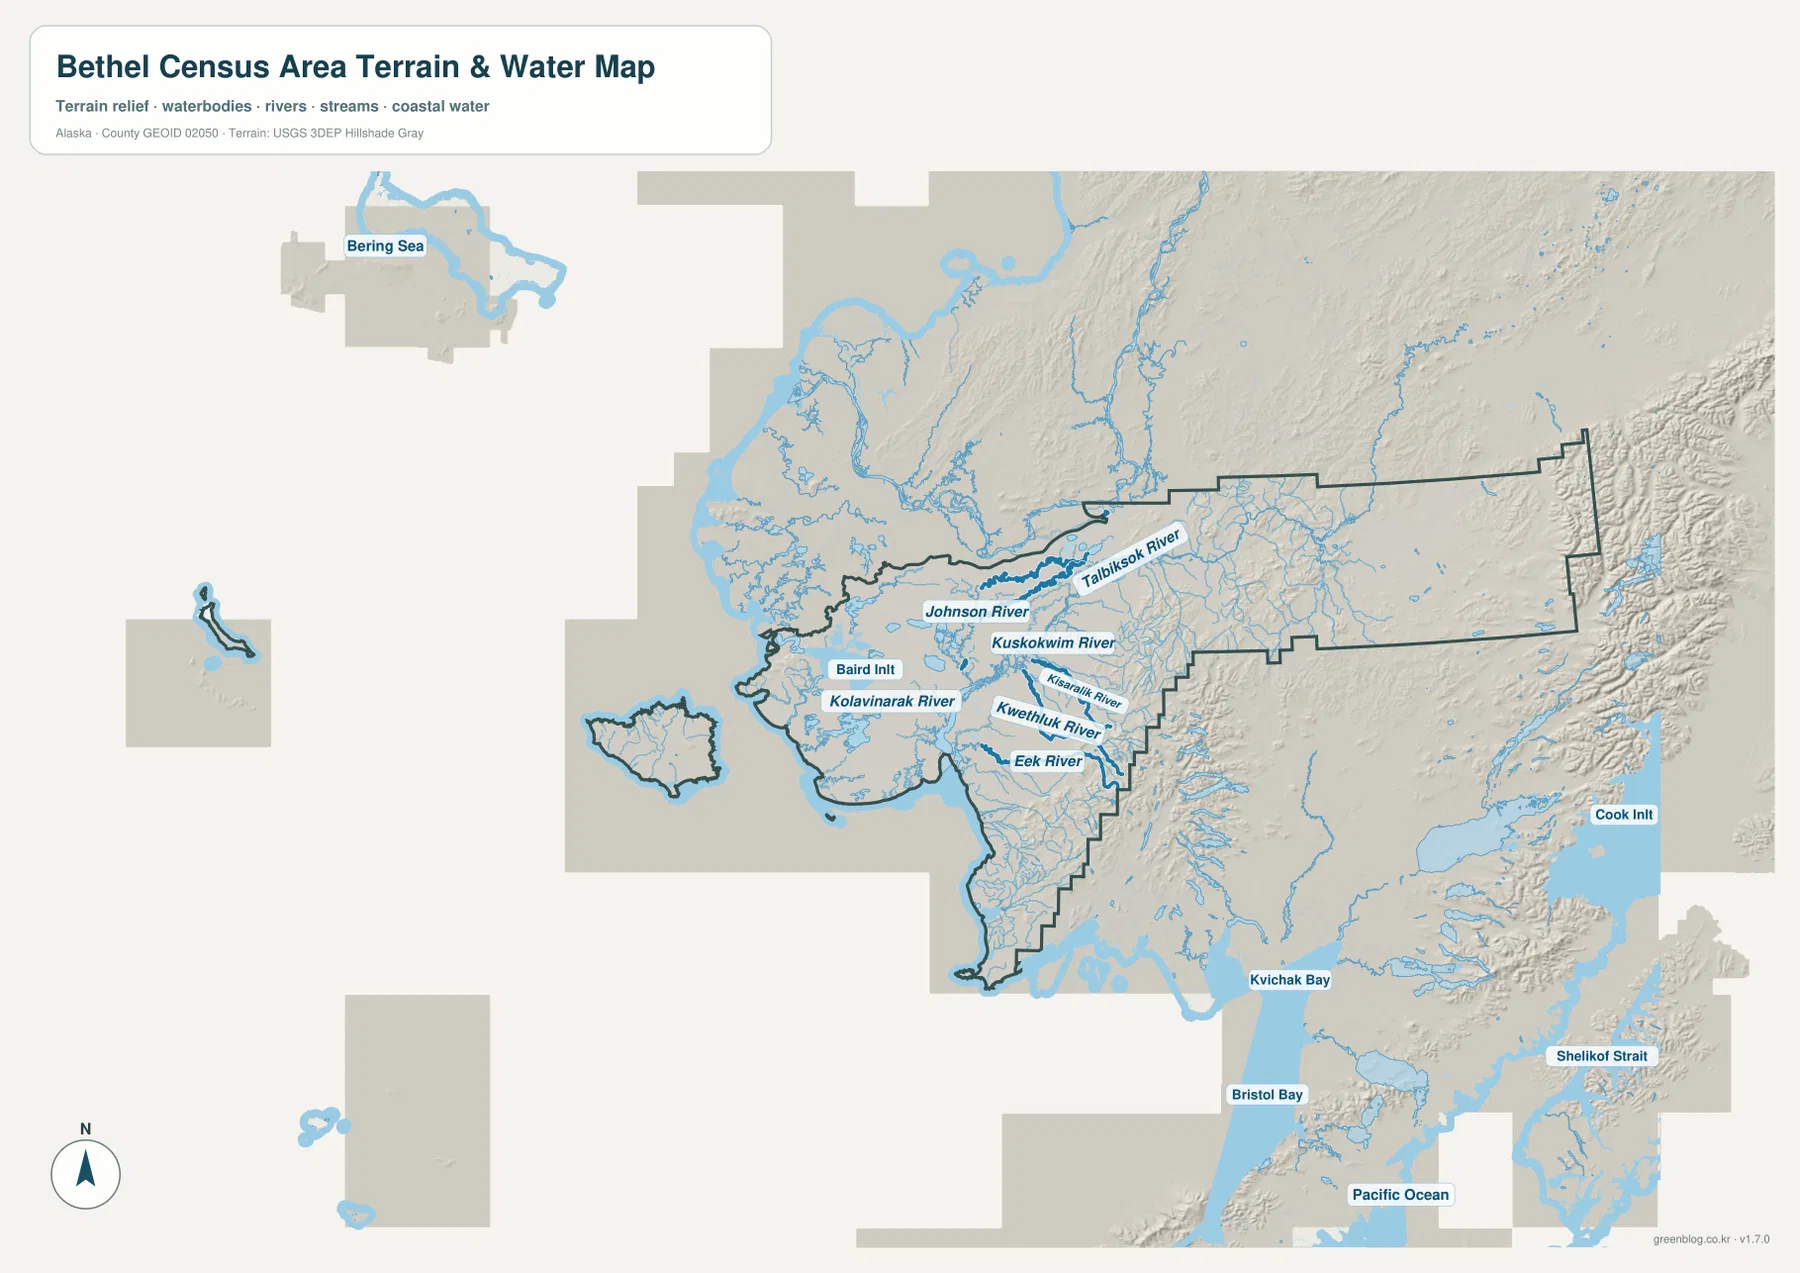
Several large water names outside the target boundary also appear on the wider basemap, including Kvichak Bay, Bristol Bay, Cook Inlet, Shelikof Strait, and the Pacific Ocean. They are regional reference labels, not a list of water bodies inside Bethel Census Area. When focusing on the county-equivalent itself, the dark green outline and the named Kuskokwim drainage inside it are the relevant features. The extra labels simply help place the area within a much broader southwestern Alaska setting.
This sheet should also be used for the job it was designed to do. It is a reference map of terrain relief, rivers, streams, water bodies, and coastal water. It is not a flood-risk map, navigation chart, water-depth product, live river-gauge display, or land-ownership map. Boating, emergency planning, and other safety-sensitive decisions require current official information beyond what is shown here.
A simple reading route starts at Bethel, follows the river, and then moves toward the coast
For a first pass, start with Bethel because it appears clearly on both the general map and the city index. From Bethel, look northeast to Aniak and south toward Quinhagak. Then move west toward Chefornak and Nightmute, and farther outward to the detached island area with Mekoryuk. That sequence turns a complicated outline into a series of recognizable reference points. It also prevents the eastern inland extension from making the western settlement pattern feel smaller than it really is.
Next compare the same region on the city index. Bethel remains the main marker, but Kwethluk and Nunapitchuk appear nearby, while Quinhagak is farther south and Toksook Bay and Chefornak lie toward the west. Because the index selects only six places, it gives a cleaner view of settlement spacing than the general map. It is especially useful for seeing that the selected communities are distributed across river and coastal settings rather than packed into one continuous built-up zone.
Finish with the terrain-and-water sheet. Once Bethel and the nearby communities are already familiar, the Kuskokwim River becomes a geographic framework instead of just another blue line. Follow the river across the central part of the map and then compare Kwethluk River, Kisaralik River, Eek River, Johnson River, and Baird Inlet. This final step helps connect the settlement map with the water landscape that surrounds those places.
Choose the map that matches the question you are trying to answer
The three supplied maps are most useful when they are treated as separate tools rather than as repeated versions of one page. The general map is best for boundaries, a wider set of place names, and overall orientation. The city index simplifies the page to six selected communities. The terrain-and-water map adds the river system, coastal water, and broad relief contrast. Switching between them makes it easier to answer specific questions without forcing every label onto one crowded sheet.
- Boundary and place orientation: use the general map to locate Bethel, Aniak, Quinhagak, Chefornak, Nightmute, Mekoryuk, Platinum, and the long eastern boundary.
- Selected city distribution: use the city index to compare Bethel, Quinhagak, Kwethluk, Toksook Bay, Chefornak, and Nunapitchuk.
- Rivers, coastal water, and terrain: use the terrain-and-water map for the Kuskokwim River, Kwethluk River, Kisaralik River, Eek River, Johnson River, Baird Inlet, and the broad west-to-east relief change.
For classroom or presentation use, one clear sequence is to introduce the census-area outline on the general map, show the dispersed city pattern on the index, and then explain the Kuskokwim River network on the water sheet. If you need larger images for printing or offline work, the ZIP below contains high-resolution JPG versions of the same three map subjects. These maps are suitable for general geographic reference, but they do not replace survey, navigation, legal-boundary, or hazard products.
Frequently Asked Questions
Why is Bethel a useful starting point for reading these maps?
Bethel is the most prominent shared reference point on the general map and the city index, and it also sits near the central Kuskokwim River network shown on the water map. Starting there makes it easier to move northeast toward Aniak, south toward Quinhagak, and west toward Chefornak and Nightmute without losing the larger boundary context.
Which map is best for the Kuskokwim River and nearby tributaries?
The terrain-and-water map is the best choice. It labels the Kuskokwim River along with Johnson River, Kolavinarak River, Kwethluk River, Kisaralik River, Eek River, Talbiksok River, and Baird Inlet. It also provides a relief background that makes the flatter western lowlands and rougher eastern terrain easier to compare.
What is included in the downloadable ZIP?
The ZIP contains three high-resolution JPG files matching the map subjects used in the article: the general county map, the city index, and the terrain-and-water map. It does not include a fourth map, flood product, navigation chart, parcel map, or legal survey. The files are intended for larger-format reference, printing, and offline use.
Map File Information
Download high-resolution JPG versions of the Bethel Census Area maps shown in this article. The ZIP is useful when you need larger files for printing, classroom work, presentations, or offline reference.
- Included Files: 3 high-resolution JPG images
- File Type: JPG files in one ZIP archive
Related Maps
Sources and references
This article is based on the supplied Bethel Census Area maps and the boundary, place, water, and terrain features visible on those sheets. The following federal sources provide authoritative reference systems for U.S. geographic boundaries, hydrography, and elevation data.
Green Map creates custom-edited map images using open geographic data sources such as geoBoundaries, Natural Earth, OpenStreetMap, and government open data. These maps are edited visual materials, not raw data files, and are provided for education, documents, presentations, and graphic reference.