Agriculture covers most of Cass County in the supplied 2025 classification, but the county is not a single uninterrupted farm surface. A large developed area sits near the middle, blue water and wooded strips cross the central part of the county, and smaller developed clusters appear away from the main center. This Cass County Indiana Land Cover Map page uses those visible differences to explain current cover, forest and farmland, impervious surfaces, and the 1985–2025 class comparison.
The four WebP previews can be compared in the article, while the original 2480 × 1754-pixel JPG versions are provided together in one ZIP farther down the page. The general land-cover image works best for a county overview; the other three are useful when the question is specifically about vegetation, hard surfaces, or cells that received a different class at the two comparison dates.
Table of Contents
A 75.06% agricultural county with a much more complex center
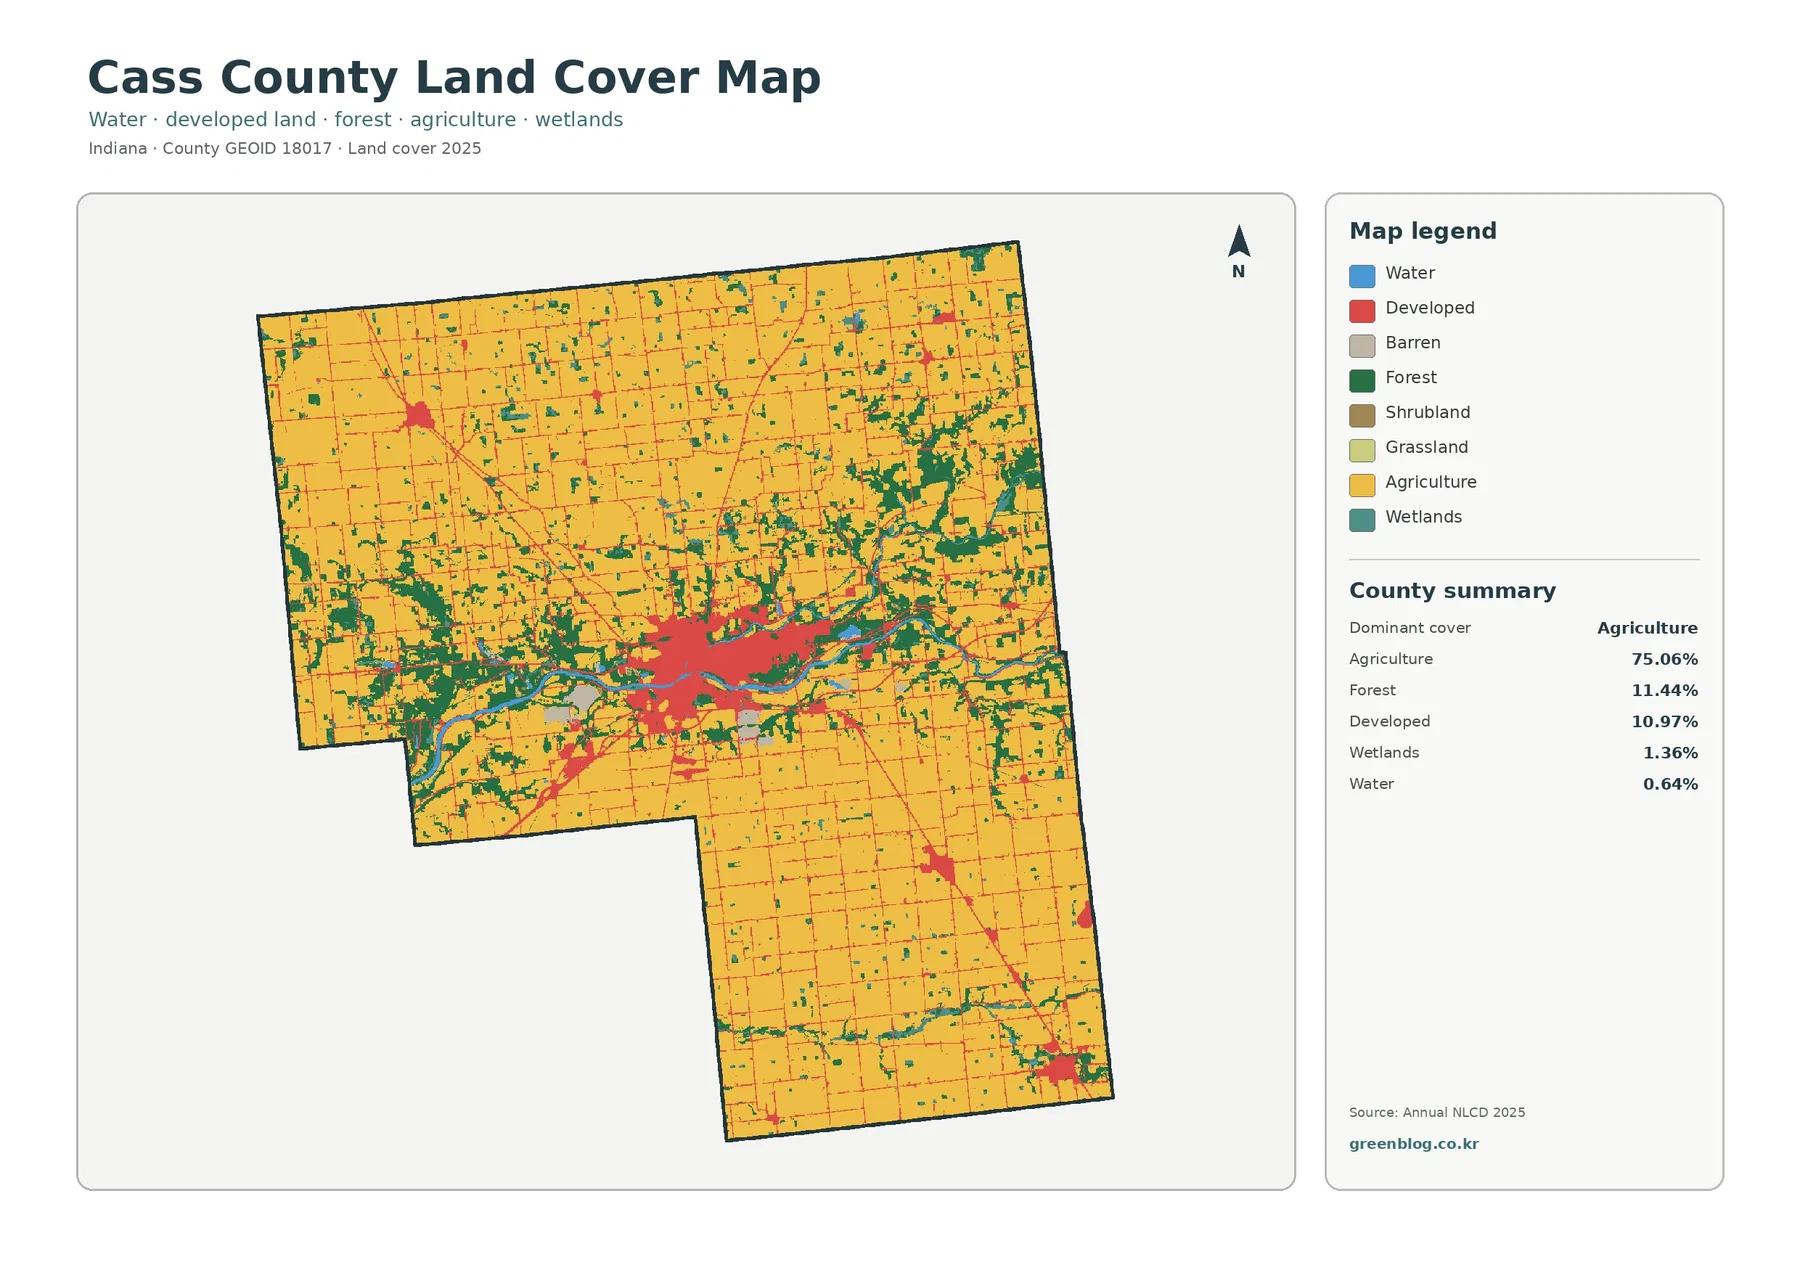
Agriculture is the dominant class at 75.06%. Yellow farm cover fills broad areas in the north and south and remains the background across much of the western and eastern countryside. The visual pattern changes sharply near the center, where developed land, water, forest, and wetland colors meet within a relatively compact area. Instead of treating the county as uniformly agricultural, it is more accurate to separate the broad farm matrix from the central zone where several cover types are packed close together.
Forest accounts for 11.44%, enough to create visible belts and blocks rather than only isolated tree patches. The strongest concentrations follow the central water feature and spread through the east-central and northeastern parts of the county. Wooded cover also appears along a curving water route in the west-central area. In the large agricultural sections, forest is thinner and more fragmented, so the contrast between open farm cover and the darker wooded strips is easy to follow.
Developed land reaches 10.97%. The largest red concentration occupies the middle of the county and extends outward in several thin lines and smaller patches. A separate smaller cluster appears in the northwest, and additional built concentrations can be seen to the south. The preview does not label municipalities or road numbers, so those smaller red areas should not be assigned a place name or route name without a separate verified reference map.
The impervious map separates hard surfaces from the larger developed footprint
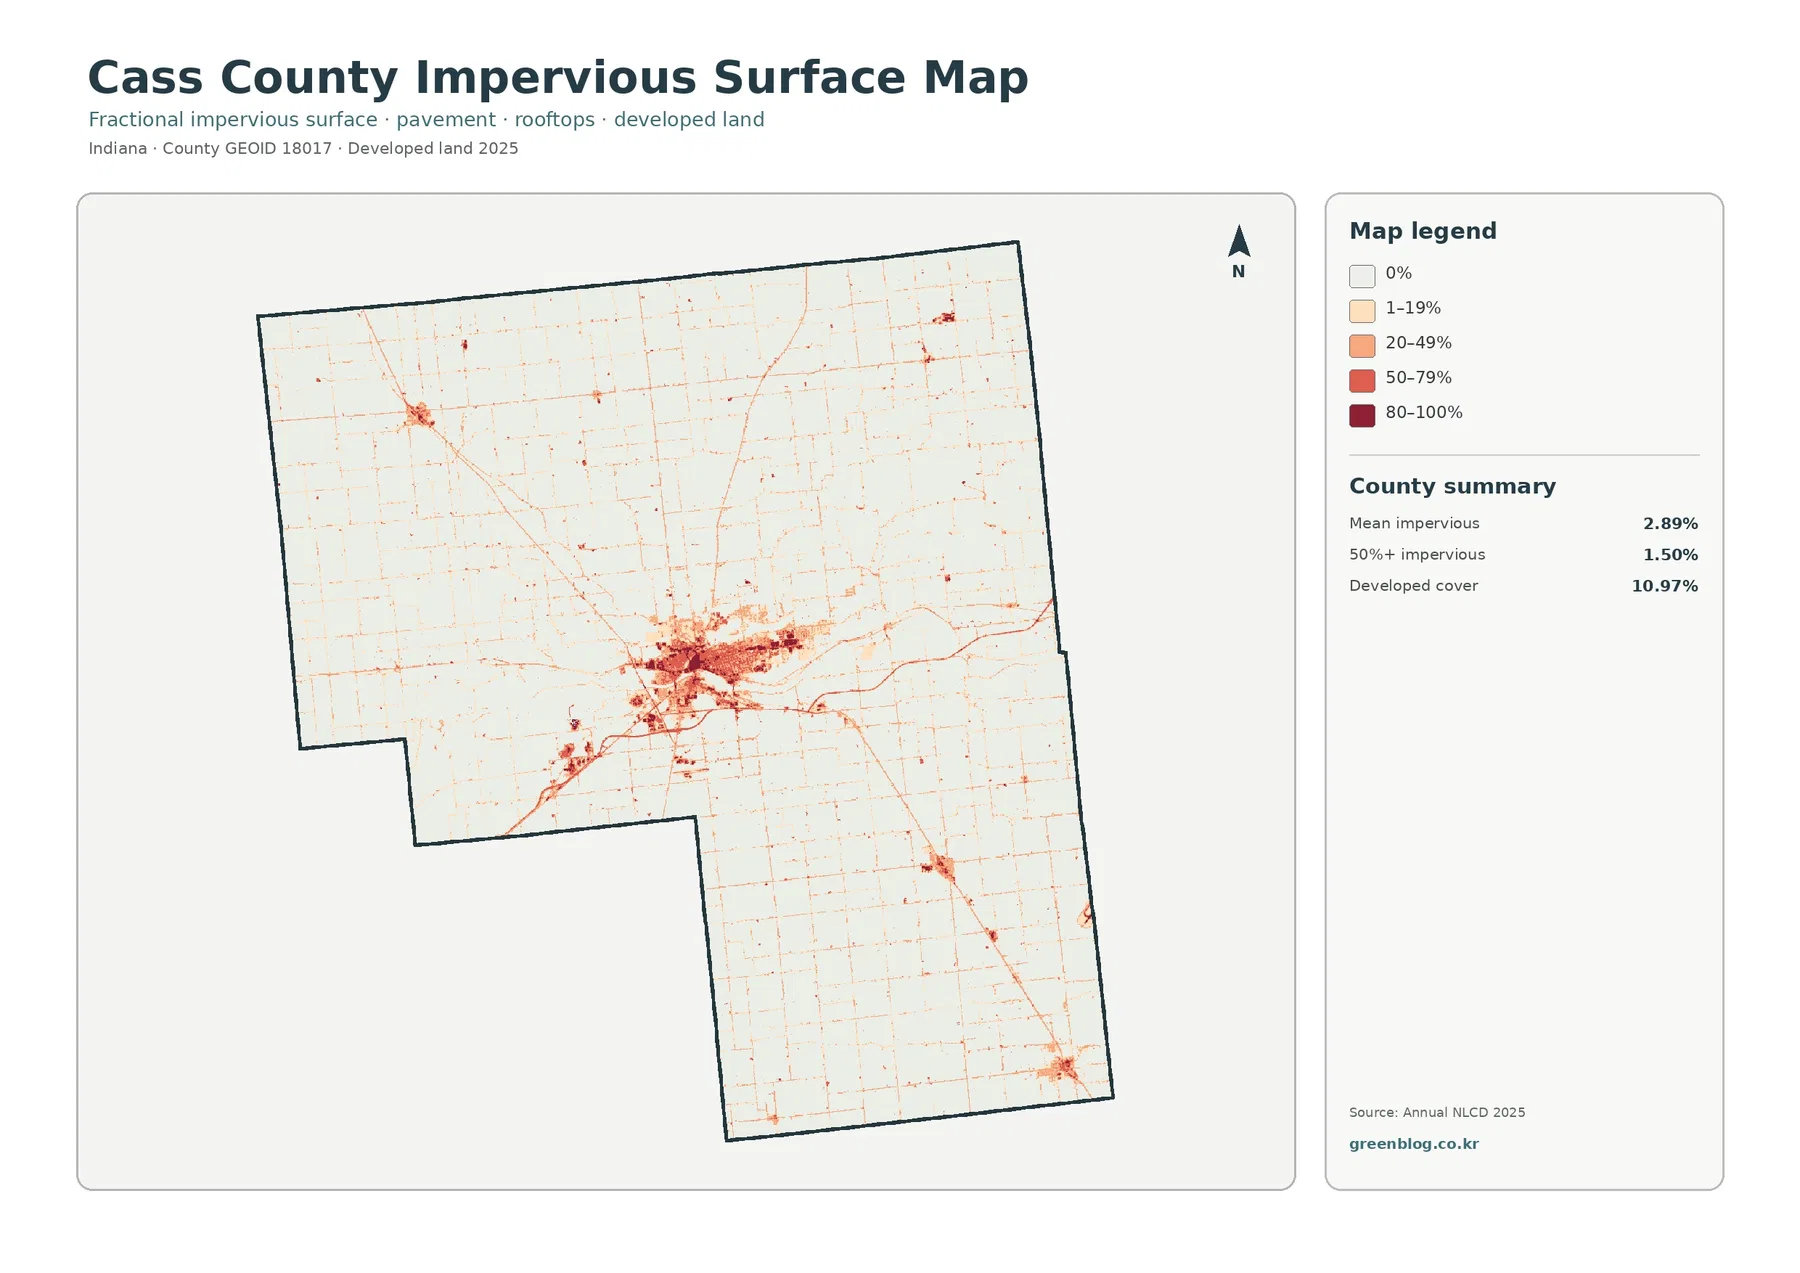
The countywide mean impervious cover is 2.89%, and 1.50% of the county is mapped at 50% impervious or greater. Those figures are much lower than the 10.97% developed share because the two measurements answer different questions. Developed land-cover classes can contain buildings and pavement along with lawns, trees, bare ground, and other permeable surfaces. The impervious layer narrows the view to the fraction occupied by roofs, pavement, parking areas, and similar hard materials.
The darkest values form a dense central cluster. Thin lines and smaller concentrations extend away from it, while much of the farm country remains very light. The northwest cluster visible on the general map is present here as a smaller hard-surface concentration, and several southern locations can also be distinguished from the mostly low-impervious surroundings. This distribution shows why a county average can be modest even when one urbanized center contains many high-value cells.
The 7.85% endpoint difference is a classification comparison, not a damage total
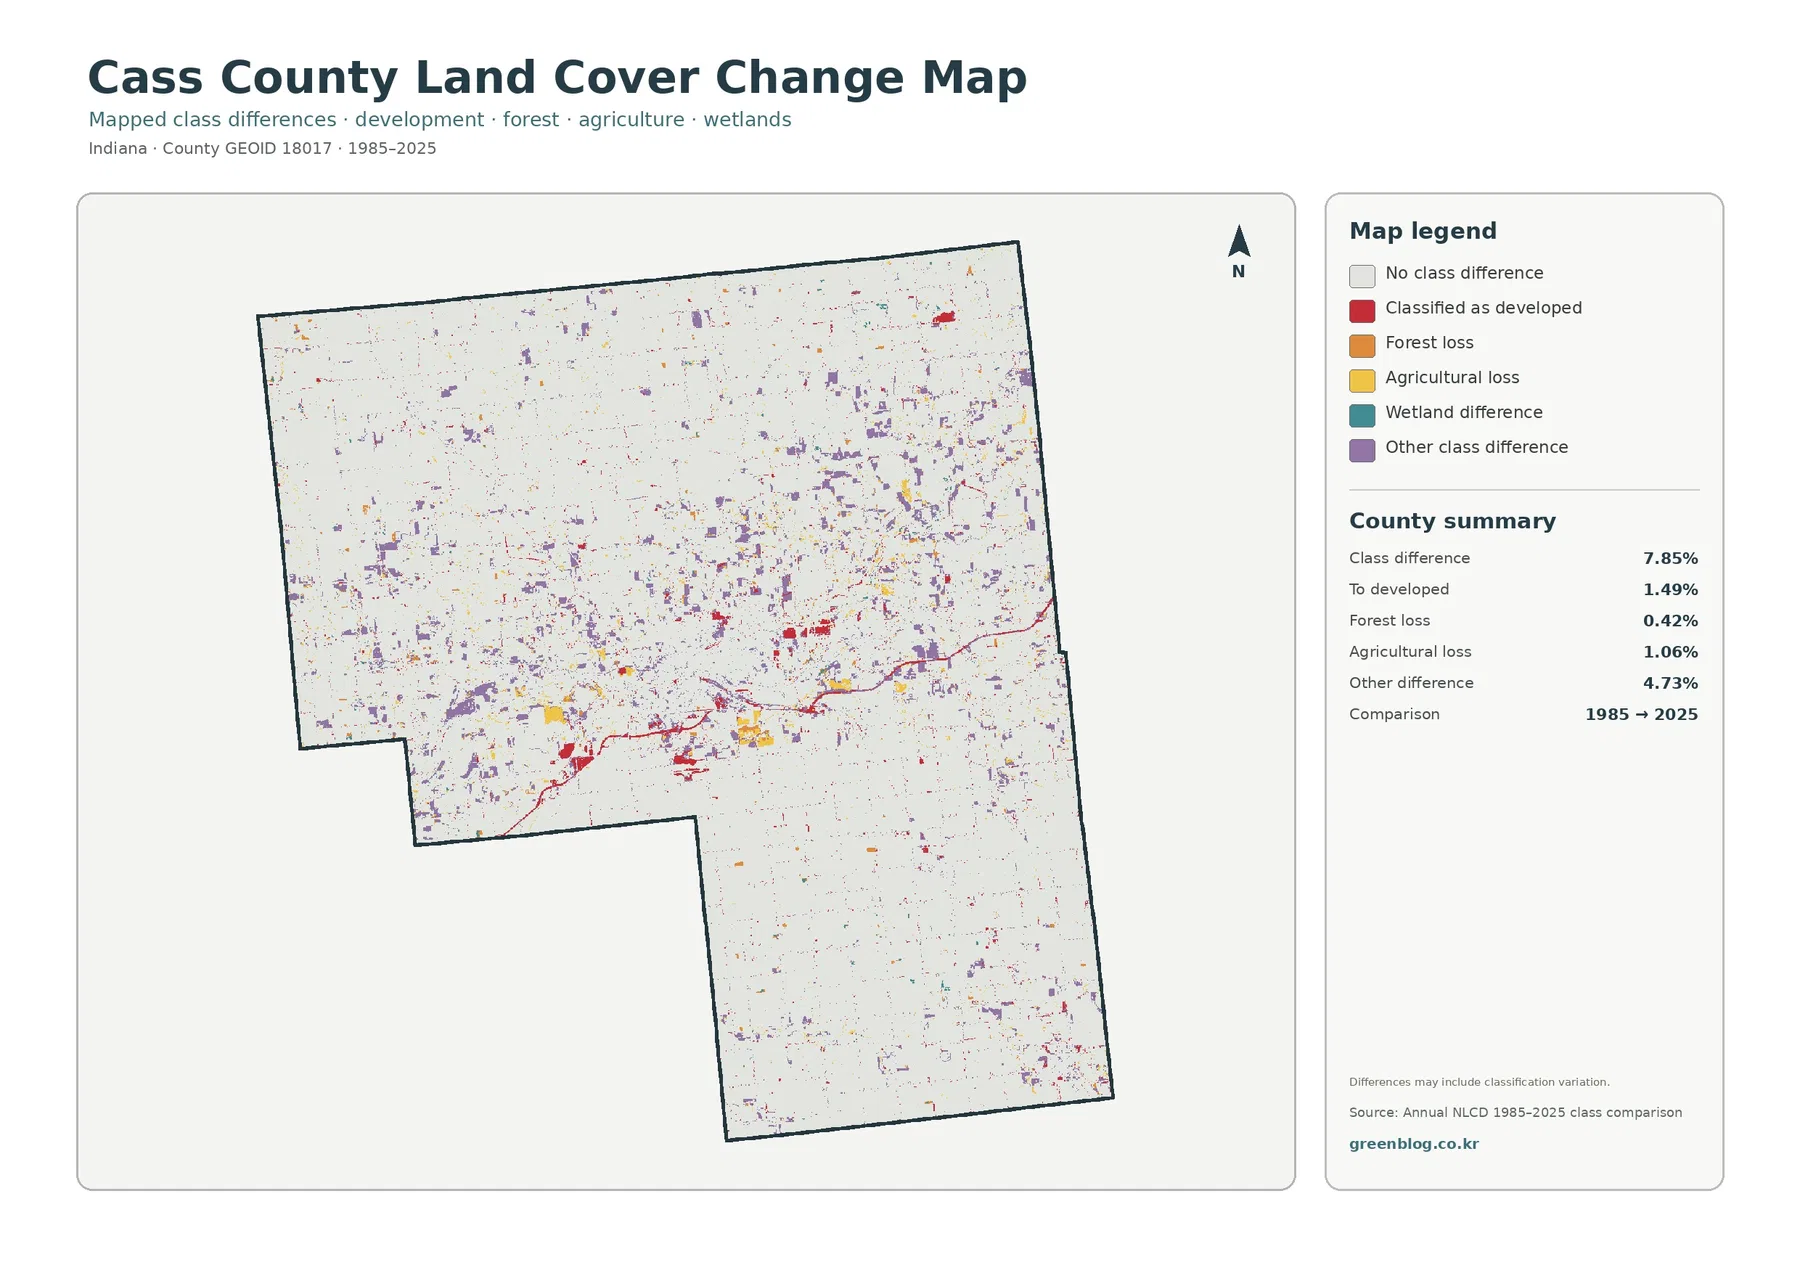
The change summary reports 7.85% total class difference between 1985 and 2025. Listed components include 1.49% classified as developed, 0.42% forest loss, 1.06% agricultural loss, and 4.73% other difference. Wetland difference appears in the legend but has no separate percentage in the summary. A residual should not be calculated and presented as an official wetland figure because the package does not provide that value directly.
Red developed-conversion cells are most noticeable around the central developed area and along a few outward traces. Purple other-difference cells are scattered widely through the northern half and around the center, while yellow agricultural-loss and orange forest-loss cells appear in smaller pieces. The map does not support a story in which all change came from one urban center. Several types of endpoint difference occur in different parts of the county, and the broad “other difference” class is numerically the largest listed component.
“Forest loss” and “agricultural loss” describe a change in class between the two endpoints. They do not state the cause. A cell that moved from forest to another class might reflect clearing, disturbance, recovery cycles, mixed land cover, or classification variation; the same caution applies to agricultural loss. The map itself notes that differences may include classification variation, so determining timing and cause would require intermediate imagery or records that are not part of this ZIP.
Removing the strong red developed class exposes the wooded water routes
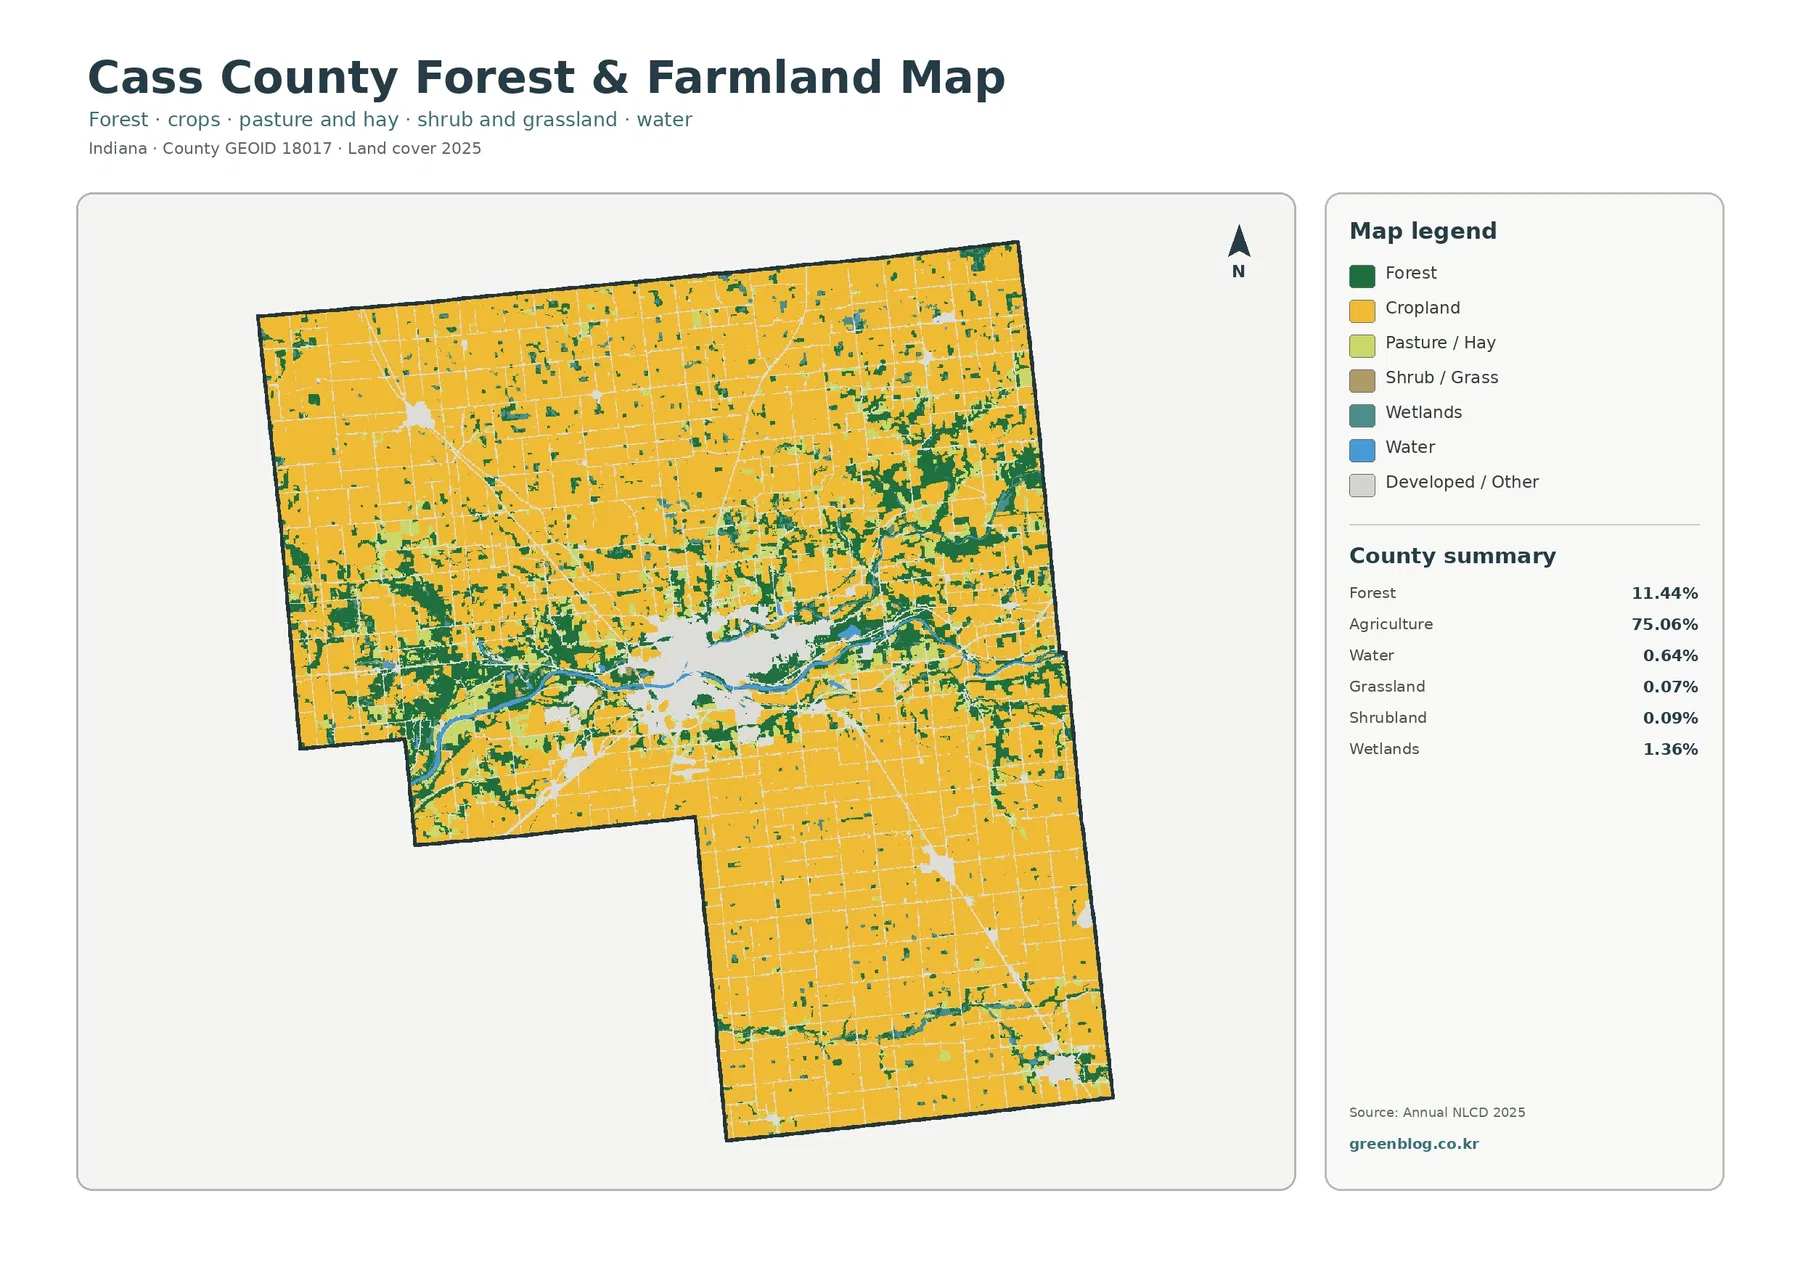
The forest-and-farmland view makes the agricultural dominance even clearer because most developed and miscellaneous surfaces are pale. Large yellow cropland blocks stretch through nearly every part of the county. Against that background, the forested and wet areas near the central water system stand out more strongly, especially east of the main developed opening and along the west-central bend. The map is useful for seeing where natural cover interrupts the farm grid without the red urban class taking most of the viewer’s attention.
Wetlands are listed at 1.36% and open water at 0.64%. These are small shares by area, yet their long, connected shapes give them more visual weight than the percentages might suggest. Blue water marks exposed water surfaces, while the wetland class can include vegetation and wet ground influenced by water. The two colors should not be combined into one “water area,” and the wetland color should not be treated as a legal or jurisdictional wetland boundary.
Water occupies only 0.64%, yet it organizes much of the central pattern
The general map makes an important distinction between area share and map structure. Open water covers only 0.64%, but the blue features form long, narrow routes that pass through several other land-cover types. Forest and wetland colors frequently sit beside those routes, while the largest developed area is also near the same central network. A small percentage can therefore be geographically important when the class is narrow and connected rather than spread as isolated spots.
Land cover is not zoning, ownership, parcel boundaries, or building permission
Land cover describes what the surface is classified as from imagery and related data. A developed cell does not automatically indicate a commercial, industrial, or residential zoning district, and an agricultural cell does not identify the owner, crop, farm operator, or legal parcel. Forest color does not establish a protected forest boundary, and wetland color is not a substitute for a jurisdictional wetland determination.
The source is a generalized raster classification. Each cell summarizes surface conditions rather than reproducing survey lines or individual property features. Enlarging the JPG makes the pixels bigger, but it does not create parcel detail that was never included in the source. Property decisions, engineering work, permitting, and site-scale environmental review need current purpose-built data in addition to these countywide reference maps.
What the 2480 × 1754 JPG files can and cannot provide
The download contains one JPG each for 2025 land cover, forest and farmland, impervious surface and developed land, and 1985–2025 land-cover change. Every JPG measures 2480 × 1754 pixels. They are useful for county profiles, classroom work, reference documents, and presentations where the goal is to compare broad patterns rather than inspect individual properties.
The package does not mark these files as meeting an A3 high-resolution reference, so large-format printing should be tested before relying on fine text or small legend details. The original JPGs are more convenient for saving and printing than the article previews, but they do not contain newer data, higher spatial detail, or legal boundaries. File dimensions and data resolution are separate issues.
The current maps represent the supplied 2025 observation year. Later construction, vegetation change, cultivation, flooding, or other surface changes may not appear. For a current planning or site decision, check whether newer official data are available. These graphics are county-scale reference products and should not replace a survey, parcel map, engineering analysis, flood determination, or wetland delineation.
Choose the map that matches the question instead of showing all four at once
For a general county profile, the 2025 land-cover map is the strongest first choice because it shows the 75.06% agricultural background, the central developed concentration, and the wooded water network in one view. The forest-and-farmland version is better when the emphasis is on cropland meeting forest, wetland, and water. Its faded developed areas remove visual competition and make the natural-cover interruptions easier to explain.
Frequently Asked Questions
What is the largest land-cover class in Cass County?
Agriculture is the largest class at 75.06% in the supplied 2025 summary. Forest follows at 11.44% and developed land at 10.97%, while wetlands account for 1.36% and open water for 0.64%. The map also shows that the smaller forest and water shares are geographically important around the central part of the county.
Why is developed cover 10.97% when mean impervious cover is 2.89%?
Developed land-cover classes can include lawns, trees, bare ground, and other permeable surfaces around buildings and roads. Impervious cover isolates the hard fraction such as rooftops, pavement, and parking areas. The two measures describe related but different properties of developed landscapes.
Does the 7.85% 1985–2025 class difference mean that much land was damaged?
No. It is the share of cells assigned different classes at the two endpoints, and the map notes that classification variation may be included. It does not identify damage, timing, or cause. Intermediate imagery and local records would be needed to explain specific changes.
Sources and Reference Data
- MRLC Annual NLCD Data – official access point for the current land-cover and comparison products used by this map set
- USGS Annual NLCD Land Cover Classification – definitions and guidance for forest, agriculture, wetlands, developed land, and related classes
- U.S. Census Bureau TIGER/Line Shapefiles – official county-boundary reference for Cass County, Indiana
Map File Information
The ZIP contains four original JPG maps for comparing Cass County’s 2025 land cover, forest and farmland, impervious and developed surfaces, and 1985–2025 class differences.
- Included Files: Four original JPG land-cover maps used in this article
- File Type: JPG images packaged in a ZIP archive
- Intended Use: Printing, education, presentations, and map-based projects
Related Maps
- Adams County Indiana Land Cover Map
- Allen County Indiana Land Cover Map
- Bartholomew County Indiana Land Cover Map
Green Map creates custom-edited map images using open geographic data sources such as geoBoundaries, Natural Earth, OpenStreetMap, and government open data. These maps are edited visual materials, not raw data files, and are provided for education, documents, presentations, and graphic reference.