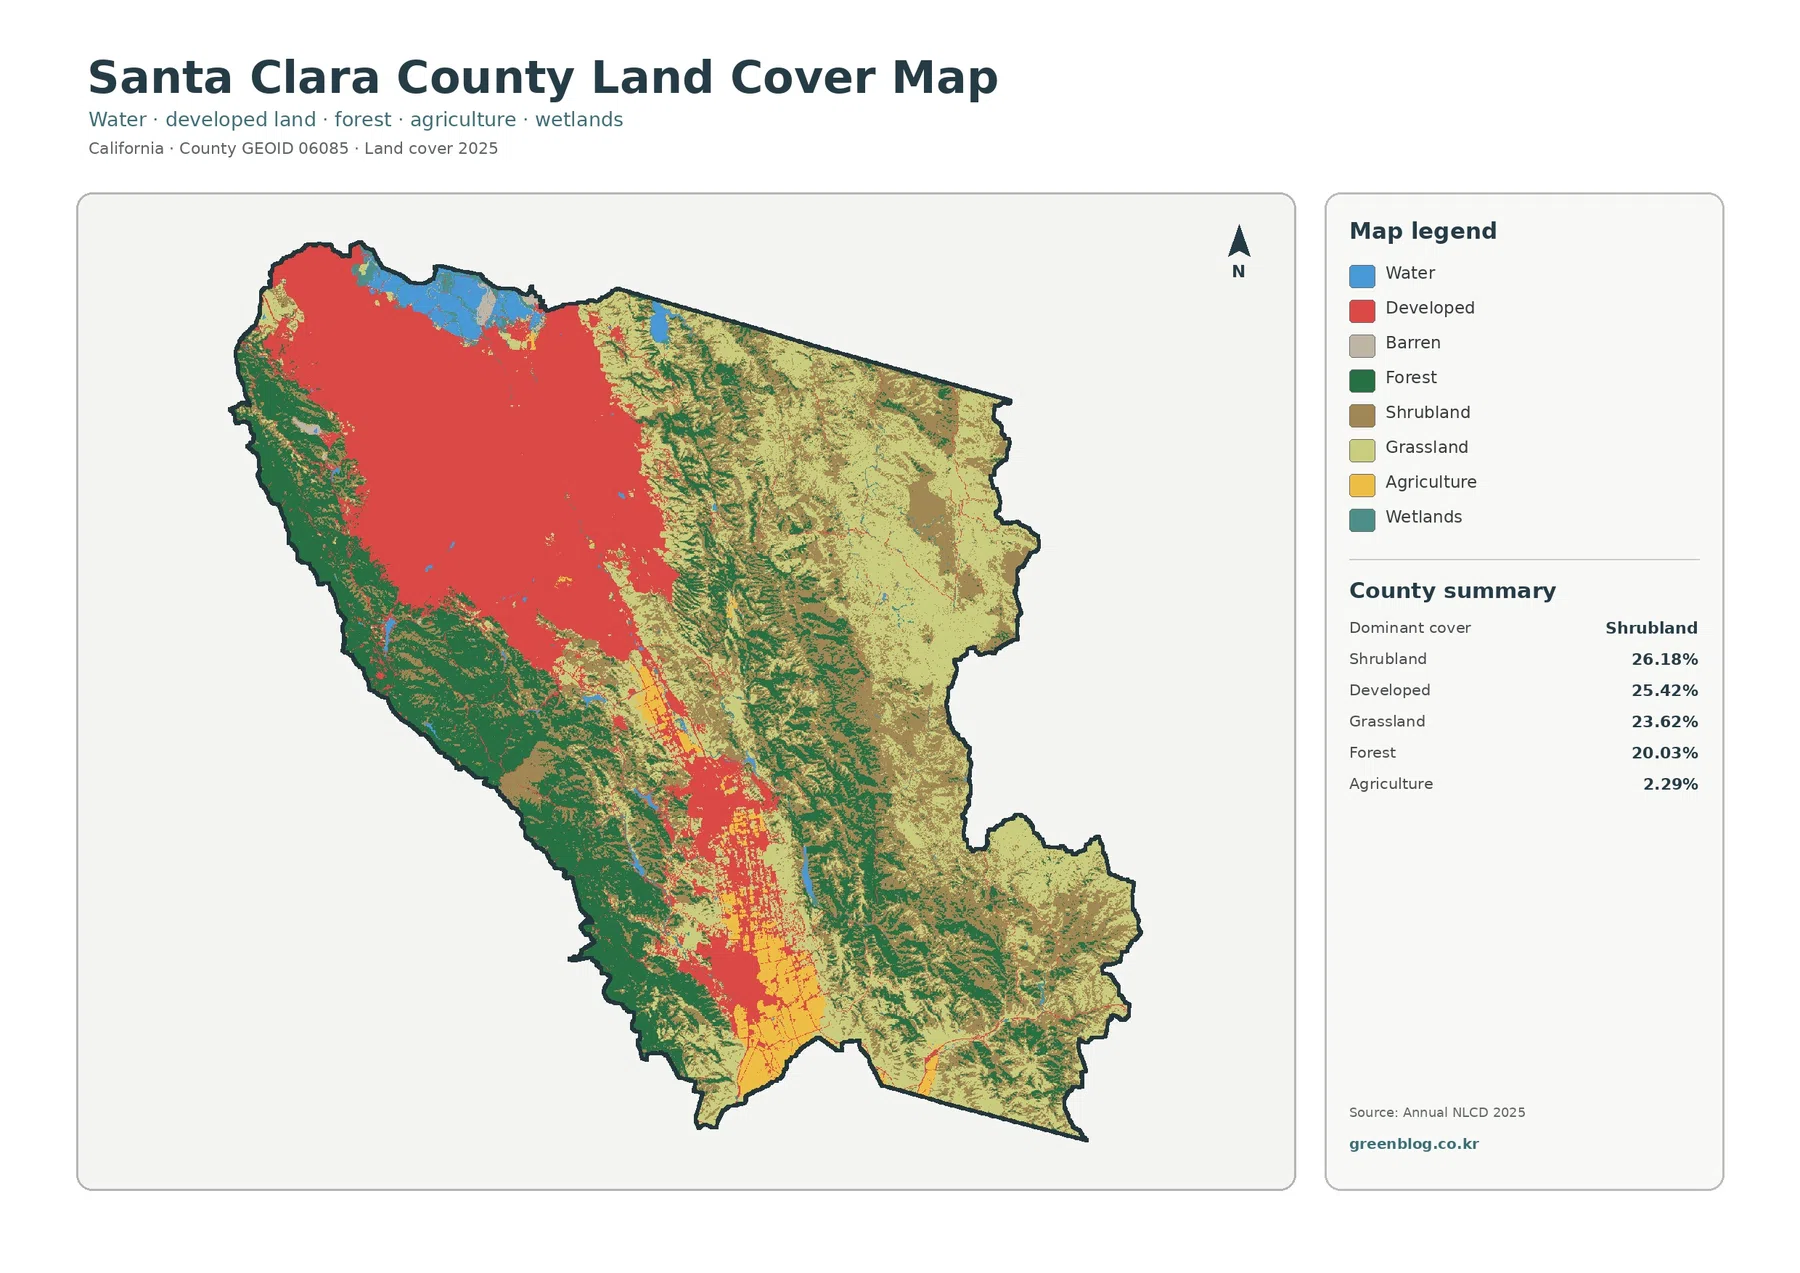
The Santa Clara County California Land Cover Map reveals a county that is far more varied than its Silicon Valley reputation suggests. A broad developed footprint fills much of the north, while shrubland and grassland spread across the eastern and southeastern hills and forest forms a strong band along the western side. The 2025 summary places shrubland first at 26.18%, followed closely by developed cover at 25.42%, grassland at 23.62%, and forest at 20.03%.
Four coordinated views make those contrasts easier to separate: general land cover, forest and farmland, fractional impervious surface, and mapped class differences from 1985 to 2025. The page previews use 1800 × 1273 WebP images, while the download contains the four original 2480 × 1754 JPG maps. They are useful for county-scale reference, classroom comparison, reports, and presentations where readers need to see how the urban valley relates to surrounding open and wooded land.
Table of Contents
A County Where the Urban Floor Does Not Fill the Boundary
Santa Clara County contains one of California’s best-known metropolitan landscapes, yet the developed area is strongly concentrated rather than evenly spread. The large northern block dominates the eye because it is continuous, but the county outline extends far beyond that urban floor. To the east and southeast, open shrub and grass classes occupy broad uplands. To the west, forest becomes the more persistent cover. Farther south, development narrows into separate valley communities and sits beside agricultural and open land rather than forming one uninterrupted city surface.
The Developed Footprint Is Dense in the North and Thinner to the South
The impervious-surface view gives the clearest picture of how concentrated the built environment is. Impervious surface means pavement, rooftops, parking areas, and other materials that shed water instead of allowing it to soak directly into soil. Darker values crowd together across the northern urban area, creating a dense network that is not repeated across the eastern hills. Southward, high values become narrower and more fragmented, following settled parts of the valley while most surrounding uplands remain pale.
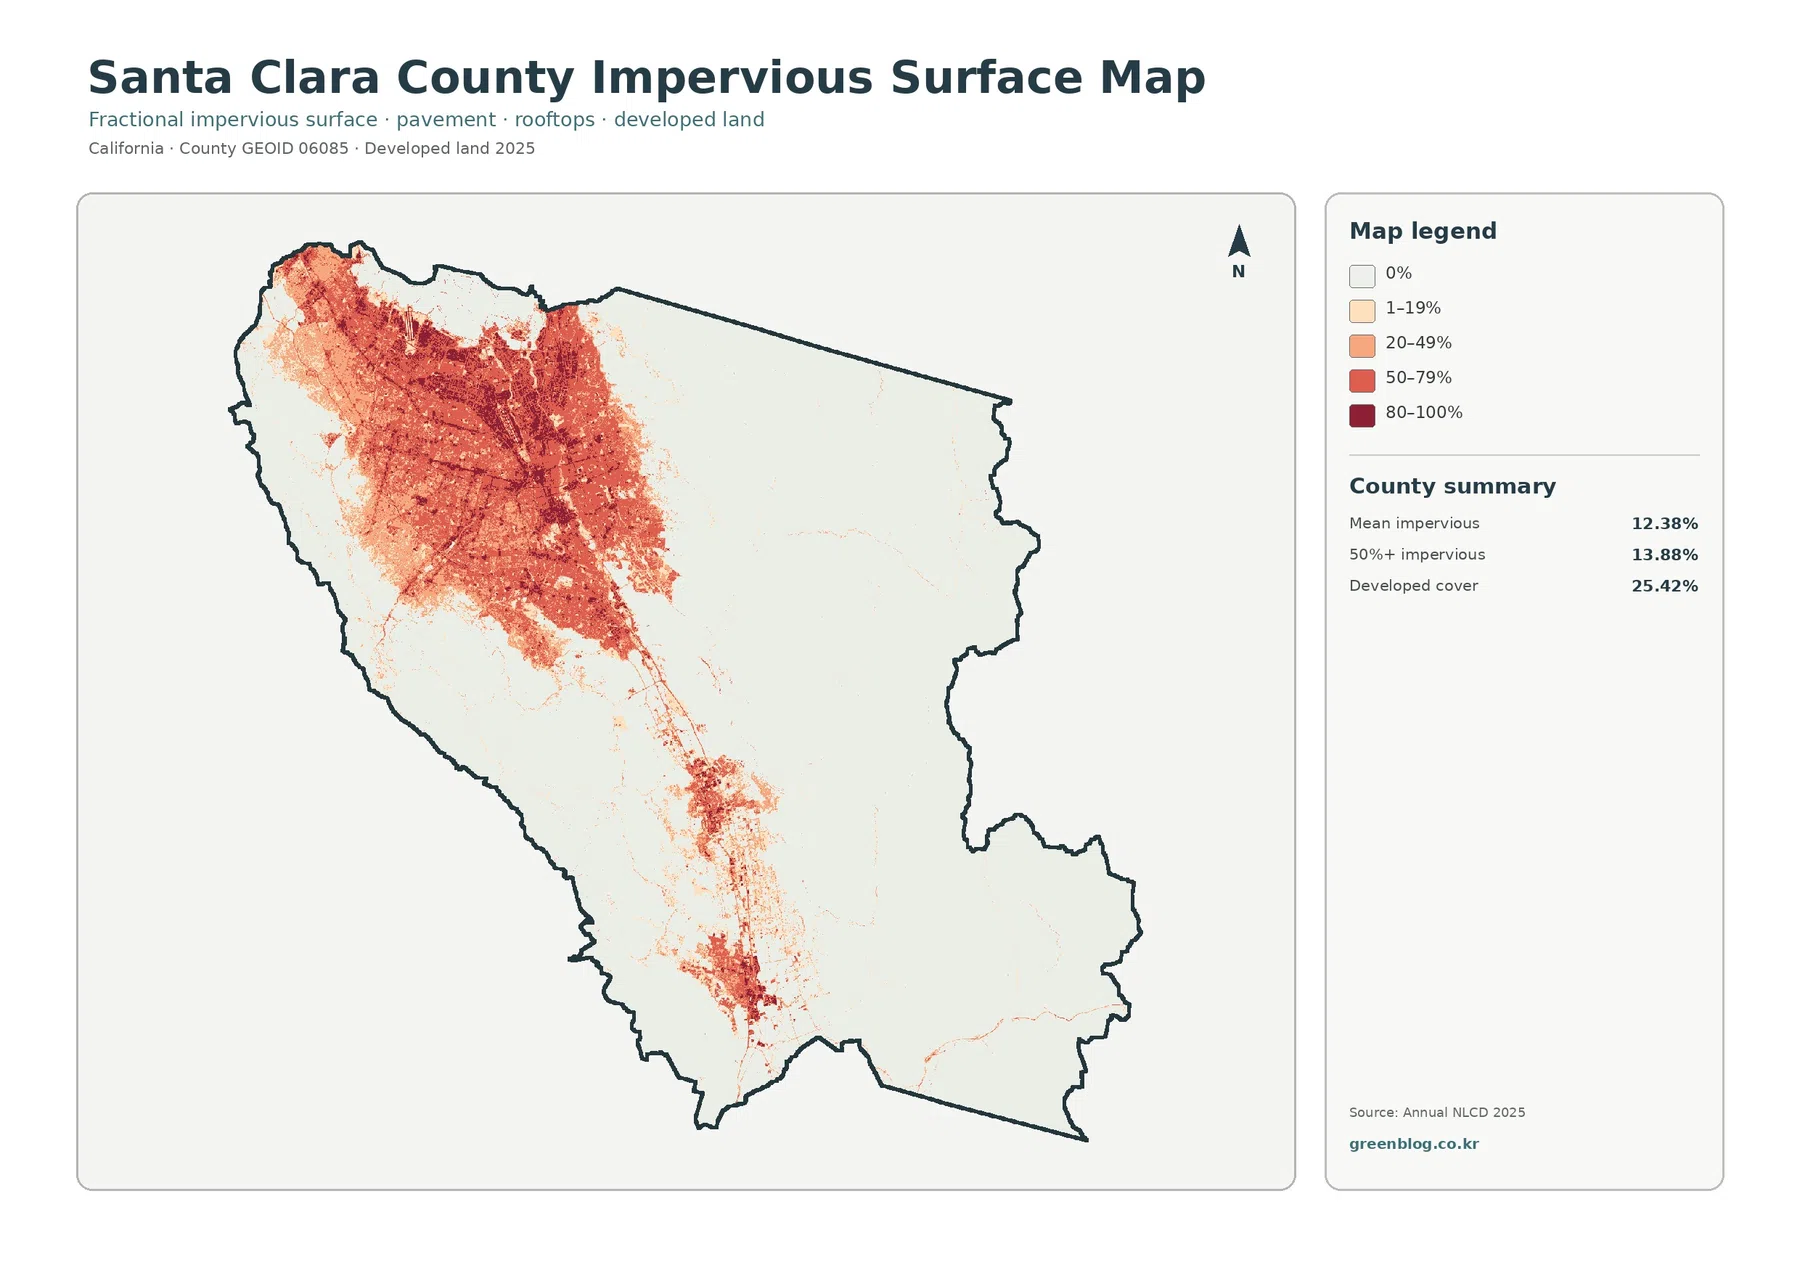
The countywide mean impervious value is 12.38%, and the map summary reports 13.88% of the county in cells with at least 50% impervious cover. That is different from the 25.42% developed-land figure. A cell can belong to a developed land-cover class while still containing trees, lawns, bare soil, or other surfaces that absorb water. The impervious product measures the fraction of hard surface within a cell, so it provides more detail about intensity inside developed areas than the categorical land-cover map does.
Open Hills Account for a Large Share of 2025 Cover
Switching to the general 2025 land-cover map changes the emphasis. The northern urban area remains prominent, but the eastern half of the county is dominated by shrubland and grassland rather than development. Shrubland is the single largest summarized class at 26.18%, while grassland covers 23.62%. The two open-cover categories occur together across large areas but are not interchangeable: the classification separates areas dominated by shrubs from areas where grasses and herbaceous vegetation are more characteristic.
Forest and Farming Occupy Different Parts of the Valley and Hills
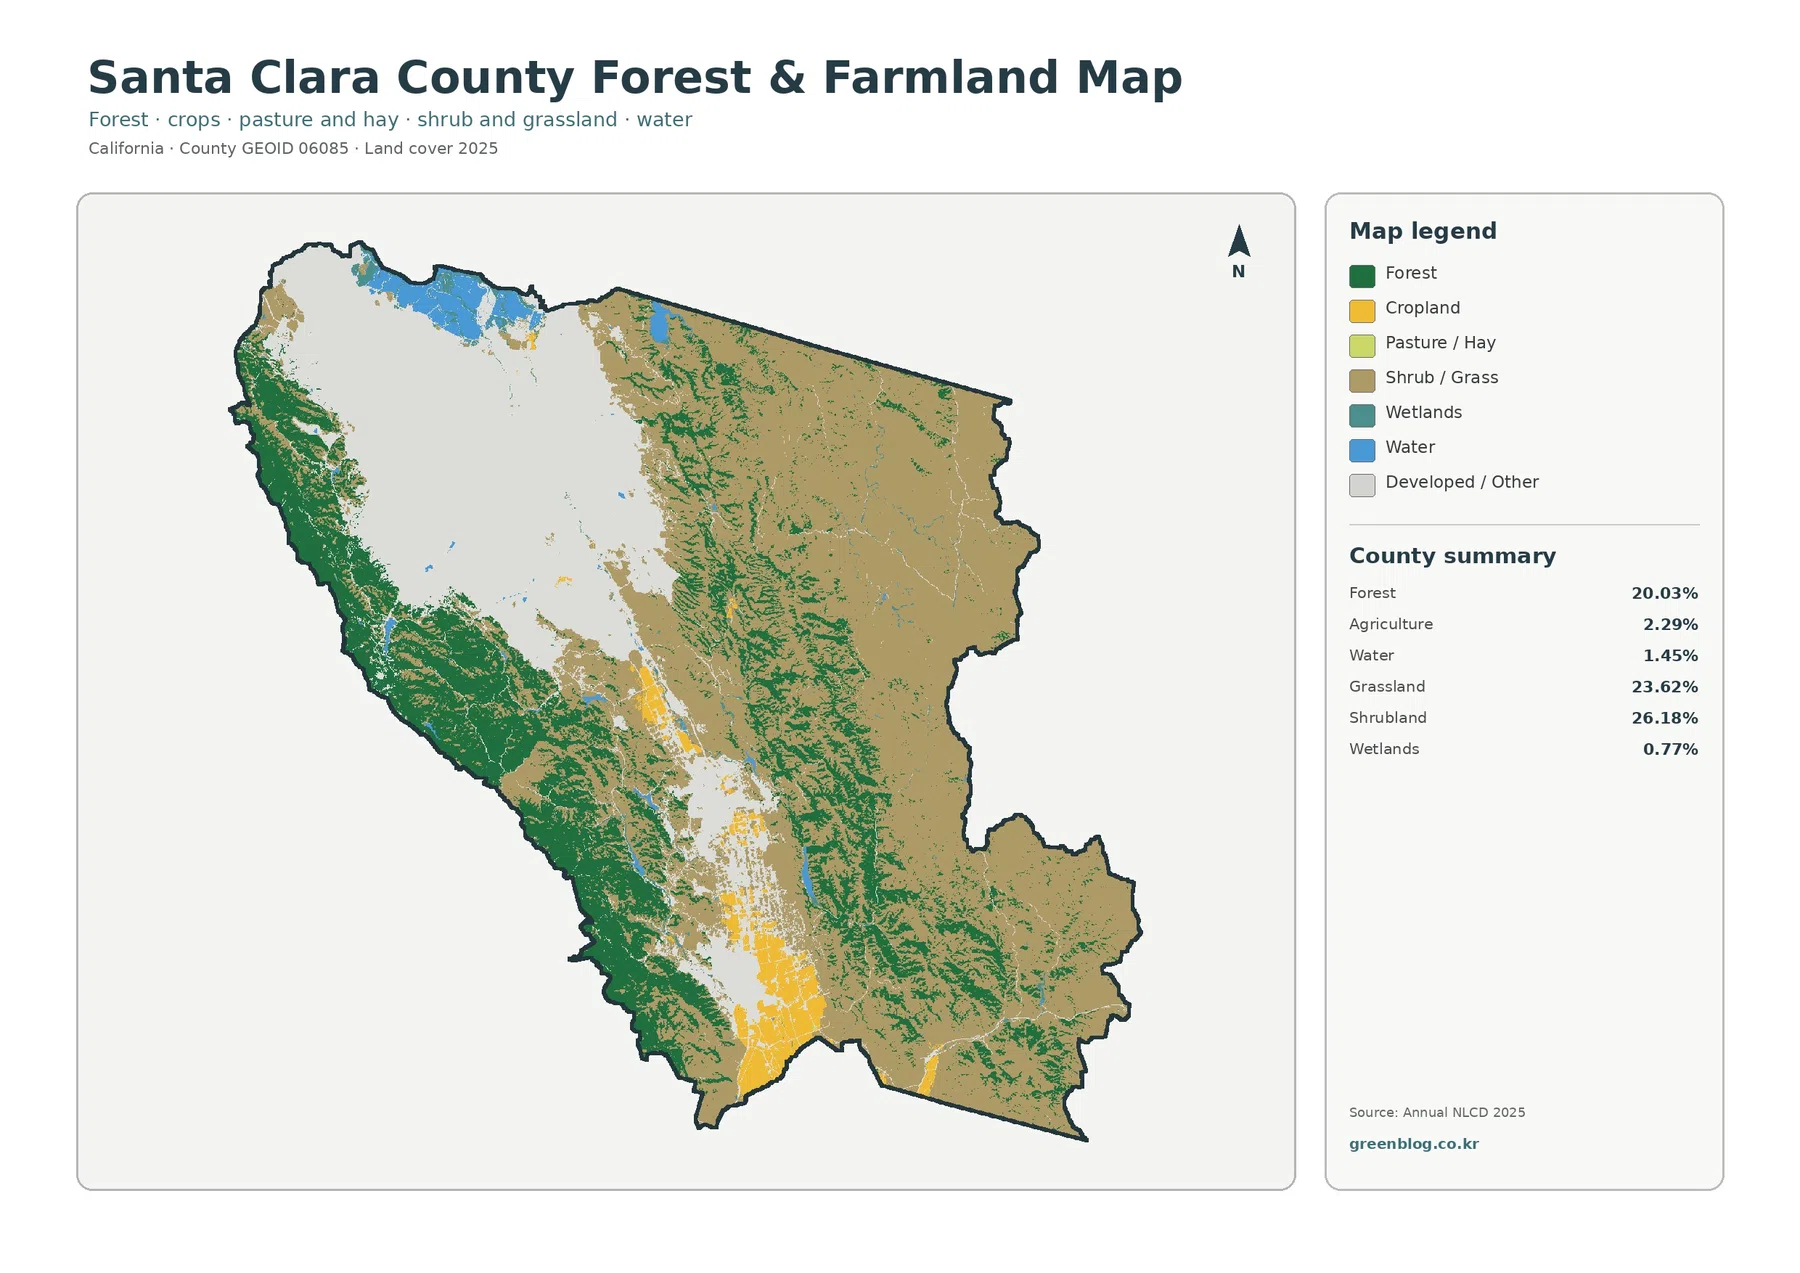
The forest-and-farmland map removes much of the visual competition from the developed classes. Forest stands out in green along the western mountains and through many southern ridges, while agriculture is highlighted in yellow along flatter valley land. The county summary repeats forest at 20.03% and agriculture at 2.29%, but it also makes the smaller water and wetland shares easier to track: water is 1.45% and wetlands 0.77%. Shrubland and grassland remain important background classes because they occupy so much of the eastern and southern uplands.
Coyote Valley provides useful local context for this pattern. The Santa Clara Valley Open Space Authority describes Coyote Valley, just south of San José, as a landscape where agriculture, water resources, open space, and wildlife connectivity remain important. It also lies between the Santa Cruz Mountains and the Diablo Range. On the county map, the broad northern developed area narrows toward this valley, where agricultural and open covers are more visible before development becomes more pronounced again farther south.
The small mapped percentage of agriculture should not be confused with a small agricultural economy. The County of Santa Clara’s 2024 Crop Report lists gross agricultural production of $389.917 million. That figure measures production value, while the 2.29% on this map measures a land-cover category over the county’s entire area. A relatively small amount of intensively used valley land can therefore have economic importance that is not obvious from its share of county acreage. The map and the crop report answer different questions and are more informative when kept separate.
What the 1985–2025 Comparison Does and Does Not Say
The change map compares the class assigned in 1985 with the class assigned in 2025. Its summary reports a class difference across 22.61% of the county. Within the categories highlighted on the map, 3.33% is shown as changing to developed, 3.00% as forest loss, 0.51% as agricultural loss, and 15.62% as another class difference. Red development changes appear around parts of the northern urban edge and in several southern valley locations, while purple “other” differences cover much larger sections of the eastern side.
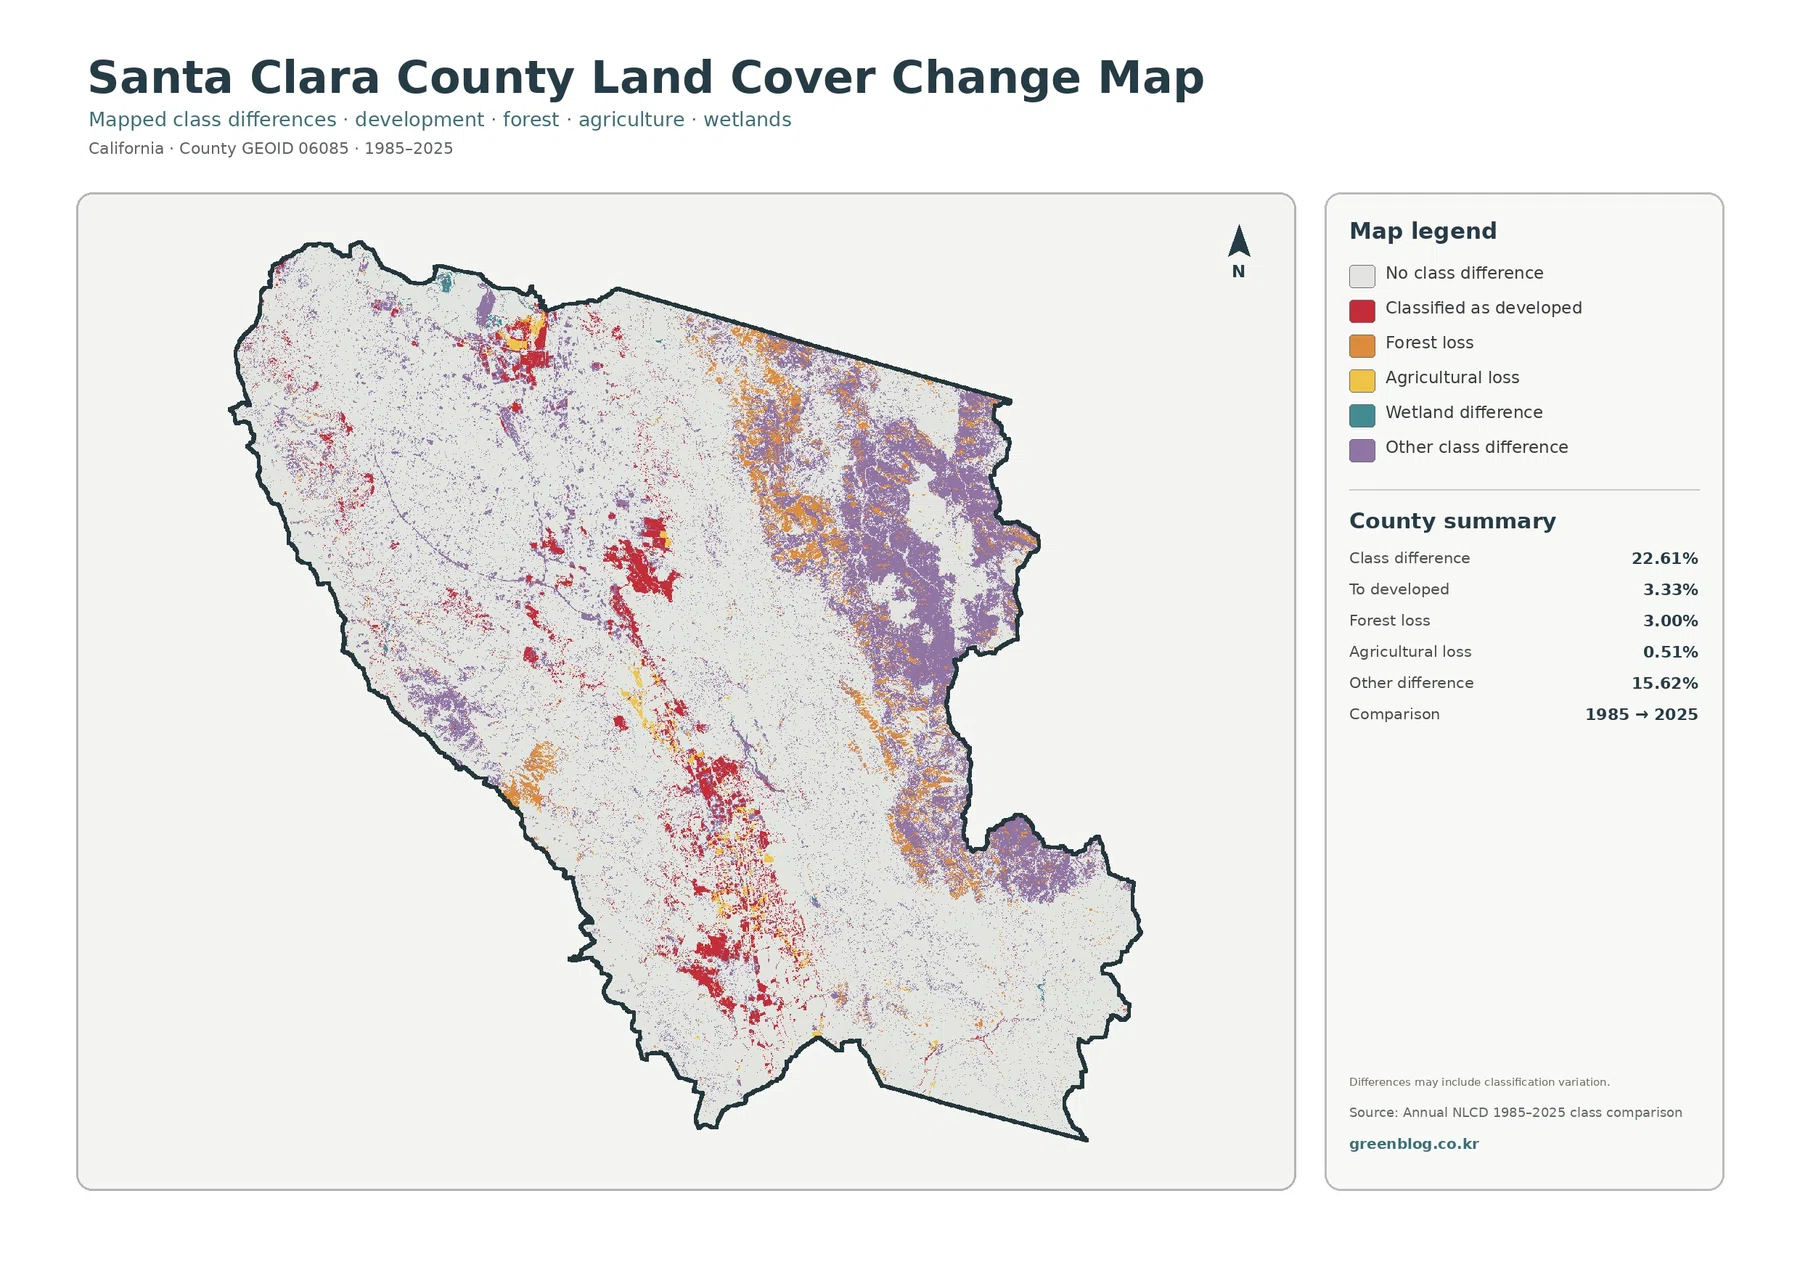
A colored change cell is not a diagnosis of what happened on the ground. The map itself notes that differences may include classification variation. A forest-loss label, for example, should not automatically be described as logging, wildfire, or construction without another source. Grassland and shrubland can also be difficult to separate consistently in dry landscapes from one observation period to another. The safest interpretation is that the two endpoint classes differ and the location may deserve closer review.
Download the Four Original JPG Maps
The WebP images in the article are optimized previews. The ZIP package contains one original JPG for each map type at 2480 × 1754 pixels. The asset manifest marks these as original-resolution files but does not identify them as meeting the package’s A3 high-resolution reference, so it is better to check legibility at the intended print size before producing a large poster. For screen use, reports, slides, and ordinary handouts, keeping the original JPG dimensions avoids an unnecessary extra round of image compression.
Resolution, Classification, and Parcel-Level Limits
Annual NLCD is raster based and derived from Landsat imagery at 30-meter resolution. In practical terms, each mapped cell represents an area roughly 30 meters by 30 meters. A cell can contain more than one real-world surface, especially along roads, stream edges, neighborhood boundaries, and narrow agricultural fields. The classification assigns or summarizes the dominant surface information at that scale, which is why a close zoom should not be expected to match fences, lot lines, or individual buildings.
Frequently Asked Questions
Why is developed cover 25.42% while mean impervious surface is only 12.38%?
They measure different things. Developed land cover is a categorical class that can include vegetation and other permeable surfaces inside a developed setting. Impervious surface estimates the hard-surface fraction within each cell. A developed residential area with yards and trees can therefore be classified as developed without being close to 100% impervious.
Does the 2.29% agriculture share mean farming is unimportant in Santa Clara County?
No. The 2.29% figure is a countywide land-cover share, not an economic measure. The County’s 2024 Crop Report lists $389.917 million in gross agricultural production. The forest-and-farmland map is useful for locating agricultural cover, especially in the southern valley, while crop reports are the better source for production value and commodity information.
Can the 22.61% class-difference figure be treated as exact physical land change?
It should be treated more cautiously. The map compares classifications at two endpoints and explicitly notes that class differences may include classification variation. The 22.61% figure identifies where the assigned classes differ between 1985 and 2025; determining the physical cause requires intermediate annual data and, where necessary, local imagery or records.
Sources and Local Context
- MRLC Annual NLCD Data — official access to Annual NLCD land-cover and impervious-surface products.
- USGS Annual NLCD Collection 1.2 — product documentation for the 30-meter annual land-cover series, including the 2025 extension.
- County of Santa Clara Annual Crop Reports — county agricultural production and commodity statistics.
- Santa Clara Valley Open Space Authority: About Coyote Valley — local information on agriculture, water resources, open space, and landscape connections south of San José.
- U.S. Census Bureau TIGER/Line Shapefiles — official administrative boundary data used for county geography.
Map File Information
The ZIP contains four original Santa Clara County JPG maps covering 2025 land cover, forest and farmland, impervious surface, and the 1985–2025 class comparison.
- Included Files: Use only the versions confirmed in the article and supplied images
- File Type: Use the confirmed download contents
- Intended Use: Printing, education, presentations, and map-based projects
Related Maps
- Alameda County California Land Cover Map
- Alpine County California Land Cover Map
- Amador County California Land Cover Map
Green Map creates custom-edited map images using open geographic data sources such as geoBoundaries, Natural Earth, OpenStreetMap, and government open data.
These maps are edited visual materials, not raw data files, and are provided for education, documents, presentations, and graphic reference.