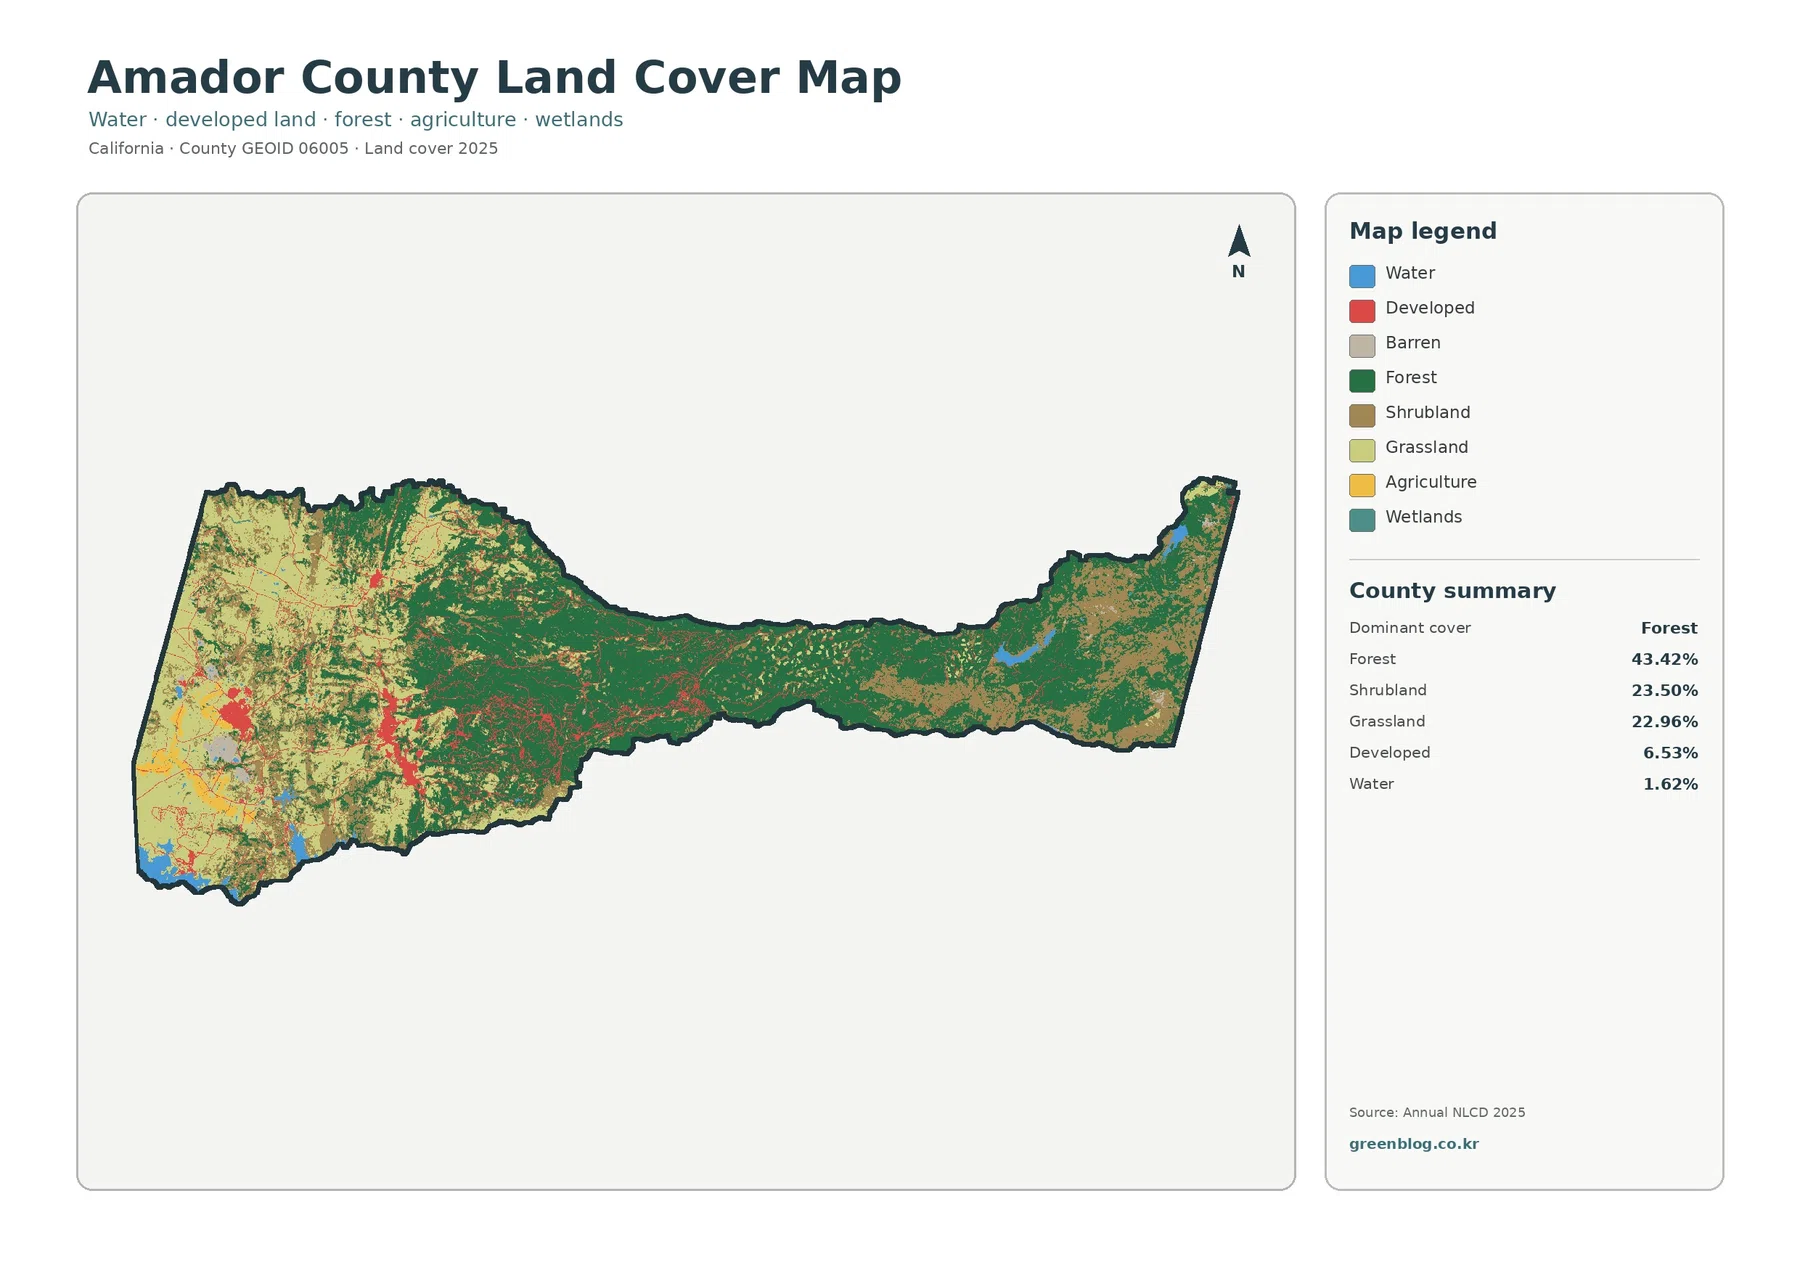
Amador County’s 2025 land-cover map shows a clear shift across its long east-west shape. Forest is the largest class at 43.42%, but shrubland at 23.50% and grassland at 22.96% together occupy nearly half of the county. The western end contains more open cover and most of the visible developed patches, while the middle and eastern portions are dominated by broad forest and shrubland areas. That contrast is more informative than the countywide percentages alone.
This page provides four views of the same county: current land cover, forest and farmland, impervious surface and developed land, and mapped class differences from 1985 to 2025. The WebP images are intended for quick viewing on the page, and the four original JPG maps are available together in one ZIP download. Moving between the maps helps separate broad developed cover from actual hard surfaces and present-day composition from long-term classification differences.
Table of Contents
The western developed footprint is small countywide but visually concentrated
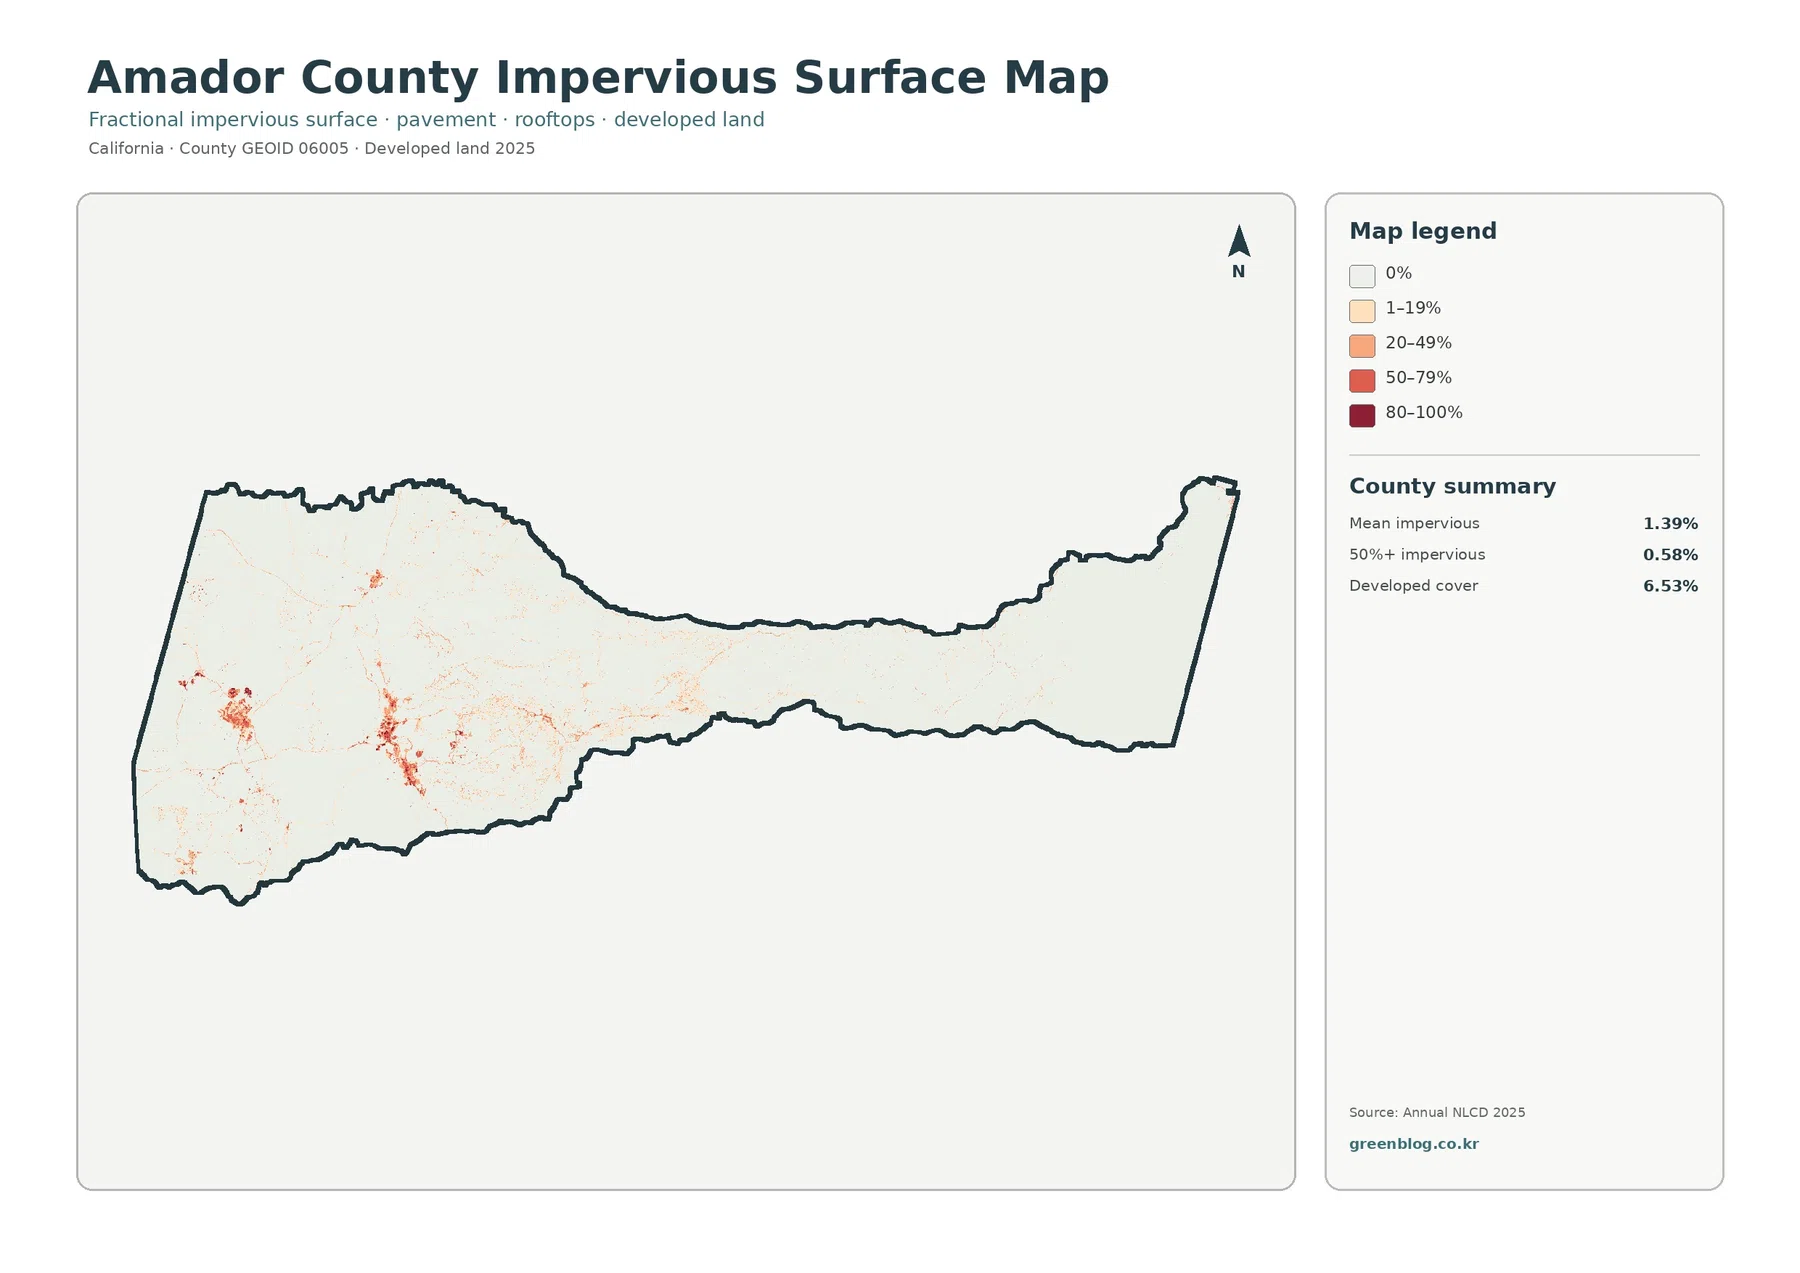
Developed land accounts for 6.53% of Amador County in the 2025 summary. That share is modest compared with forest, shrubland, or grassland, yet the red developed class is easy to notice because it is not evenly scattered. Several concentrations appear in the western part of the county, with thinner developed traces extending toward the center. The eastern portion contains far fewer red patches, so the distribution creates a strong geographic contrast even though development remains a relatively small countywide class.
The impervious-surface map sharpens that comparison. Impervious surface means pavement, roofs, parking areas, and other surfaces that do not readily absorb water. The countywide mean is 1.39%, and only 0.58% of the county is mapped at 50% impervious or more. Most of the image is therefore very light, while orange and red values form small clusters and thin lines in the west. A reader looking only at the 6.53% developed figure could easily overestimate how much of that area is actually hard surface.
Developed cover and impervious percentage are related but not interchangeable. A developed land-cover cell can include lawns, trees, soil, or other permeable ground mixed with buildings and streets. The impervious product instead estimates the fraction of the cell occupied by hard surface. Comparing the two maps at the same location is useful for distinguishing a broader settlement footprint from the places where pavement and rooftops are most concentrated.
Forest leads at 43.42%, but shrubland and grassland explain much of the open terrain
Forest is the dominant 2025 land-cover class at 43.42%. Dark green covers large parts of the county’s central and eastern reach, and smaller forest patches also occur farther west. The pattern is not a single uninterrupted block. Shrubland, grassland, water, and smaller developed or barren areas break the forest into broad patches and corridors, especially near transitions between the western open landscape and the more heavily forested center.
Shrubland makes up 23.50% and grassland 22.96%. In the west, grassland and shrubland occupy wide areas and create a much lighter map than the forested middle. At the far eastern end, shrubland becomes prominent again among forest patches, while grassland is less extensive. The county’s overall surface therefore cannot be described simply as “mostly forest.” Nearly half of the mapped area is open shrub or grass cover. Its location changes markedly from one end of the county to the other.
Water is 1.62% of the county and appears as several clearly visible blue areas despite its small percentage. Developed land is 6.53%, while barren and wetland classes occur in much smaller pieces. These minor classes matter when reading local sections of the map because they often provide visual reference points within the much larger forest, shrubland, and grassland pattern. The legend should be kept nearby when zooming in, particularly where pale barren land could otherwise be mistaken for a developed surface.
Only 1.07% is mapped as agriculture, so open land should not be read as farmland by default
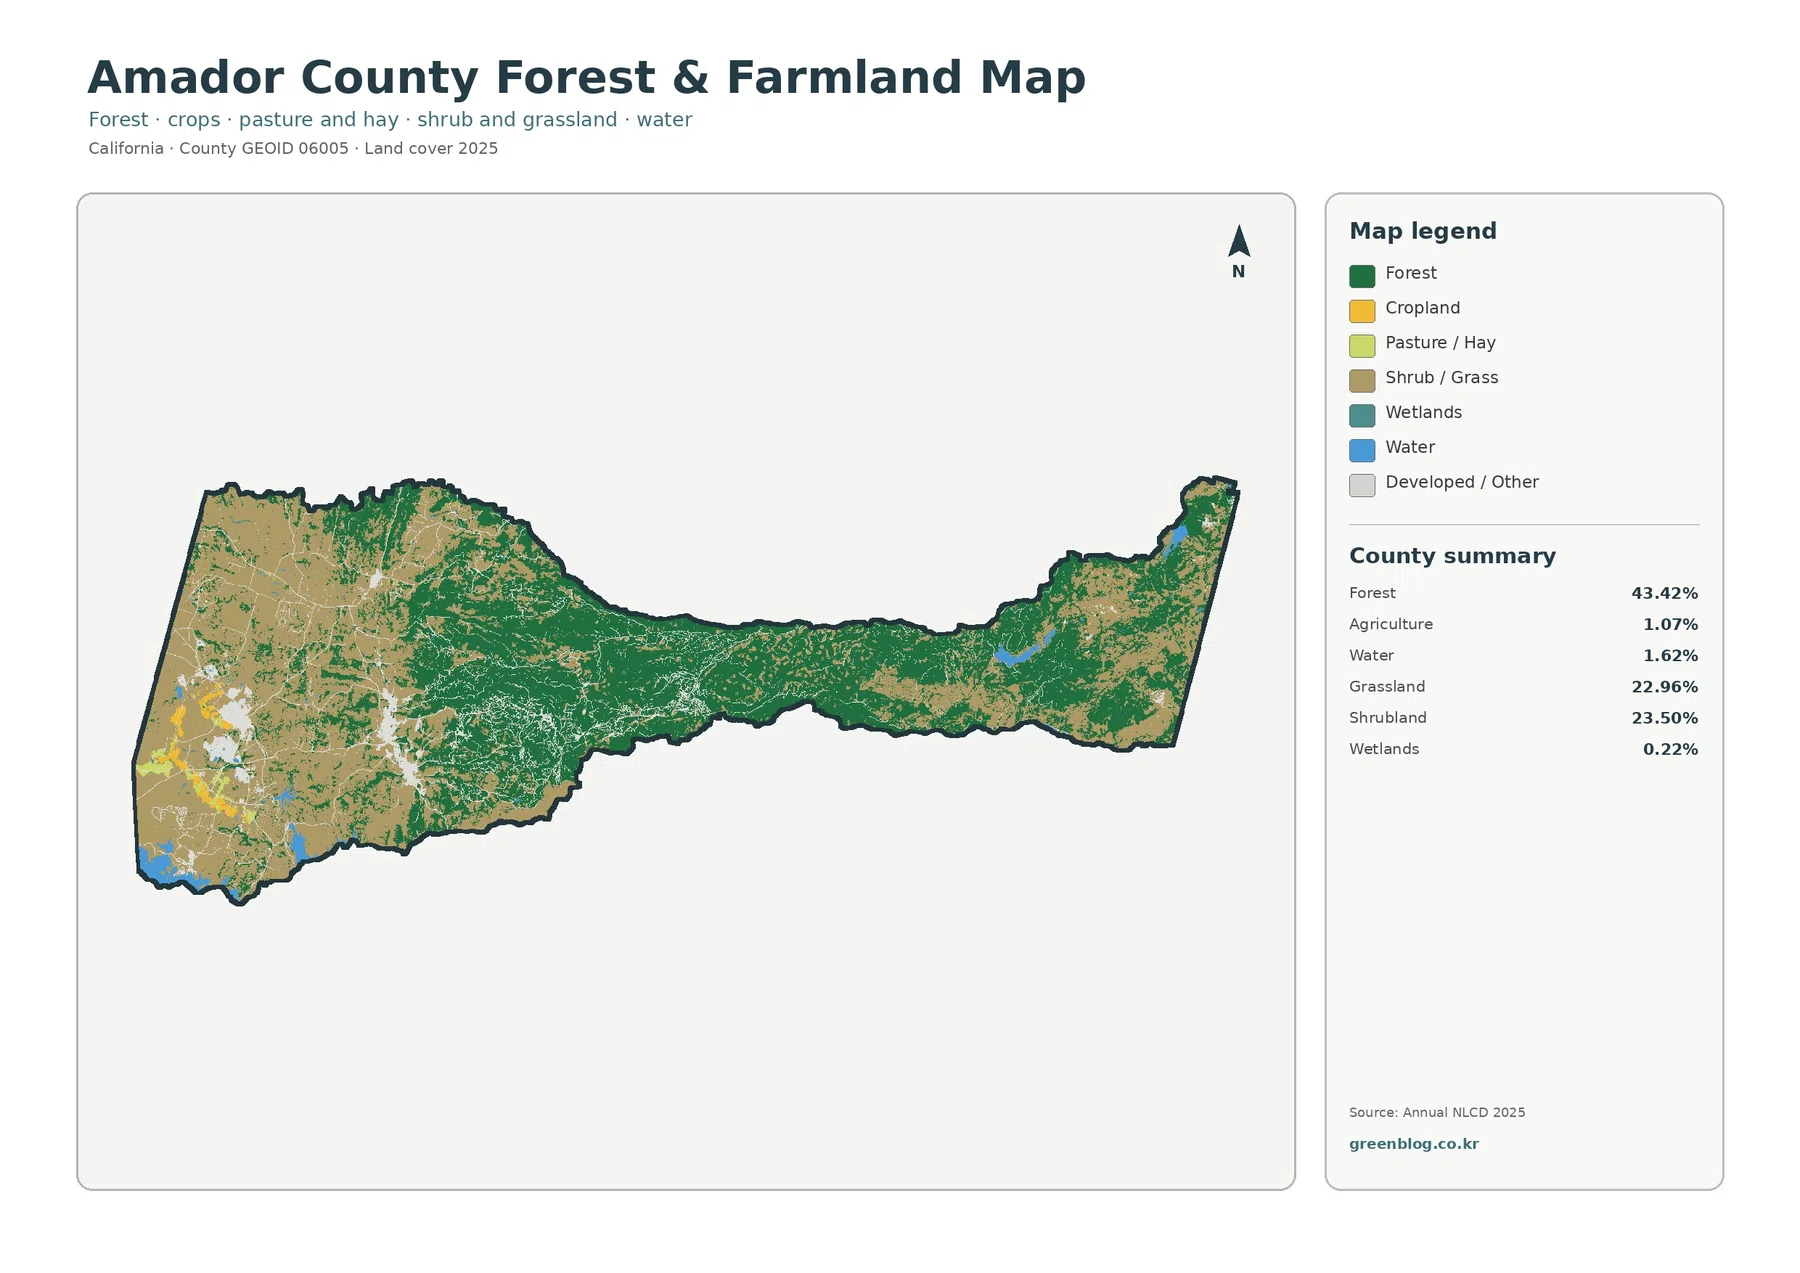
The forest-and-farmland map removes some of the smaller distinctions and makes the contrast between wooded, agricultural, open, wet, and developed/other surfaces easier to follow. Agriculture is only 1.07% of Amador County. Yellow cropland and pasture/hay areas appear mainly as limited patches in the western portion, while the much larger tan and light-green areas represent shrubland and grassland. This distinction is important because an open, treeless surface is not automatically agricultural land.
Forest remains 43.42% in this view, while shrubland is 23.50% and grassland is 22.96%. The simplified legend makes the central forest band especially clear and shows how open cover becomes more common toward the west. Water is 1.62% and wetlands are 0.22%. The wetland percentage is very small at county scale, so individual wetland pixels are easy to miss unless the map is viewed at a larger size.
Land cover should not be confused with zoning, ownership, or permitted land use. A shrubland or grassland pixel only reports how the surface was classified in the remote-sensing product. It does not show whether a parcel is used for grazing, protected as open space, eligible for development, or subject to a particular zoning designation. Questions about a specific property should be answered with current county planning and parcel resources, not with this generalized raster map.
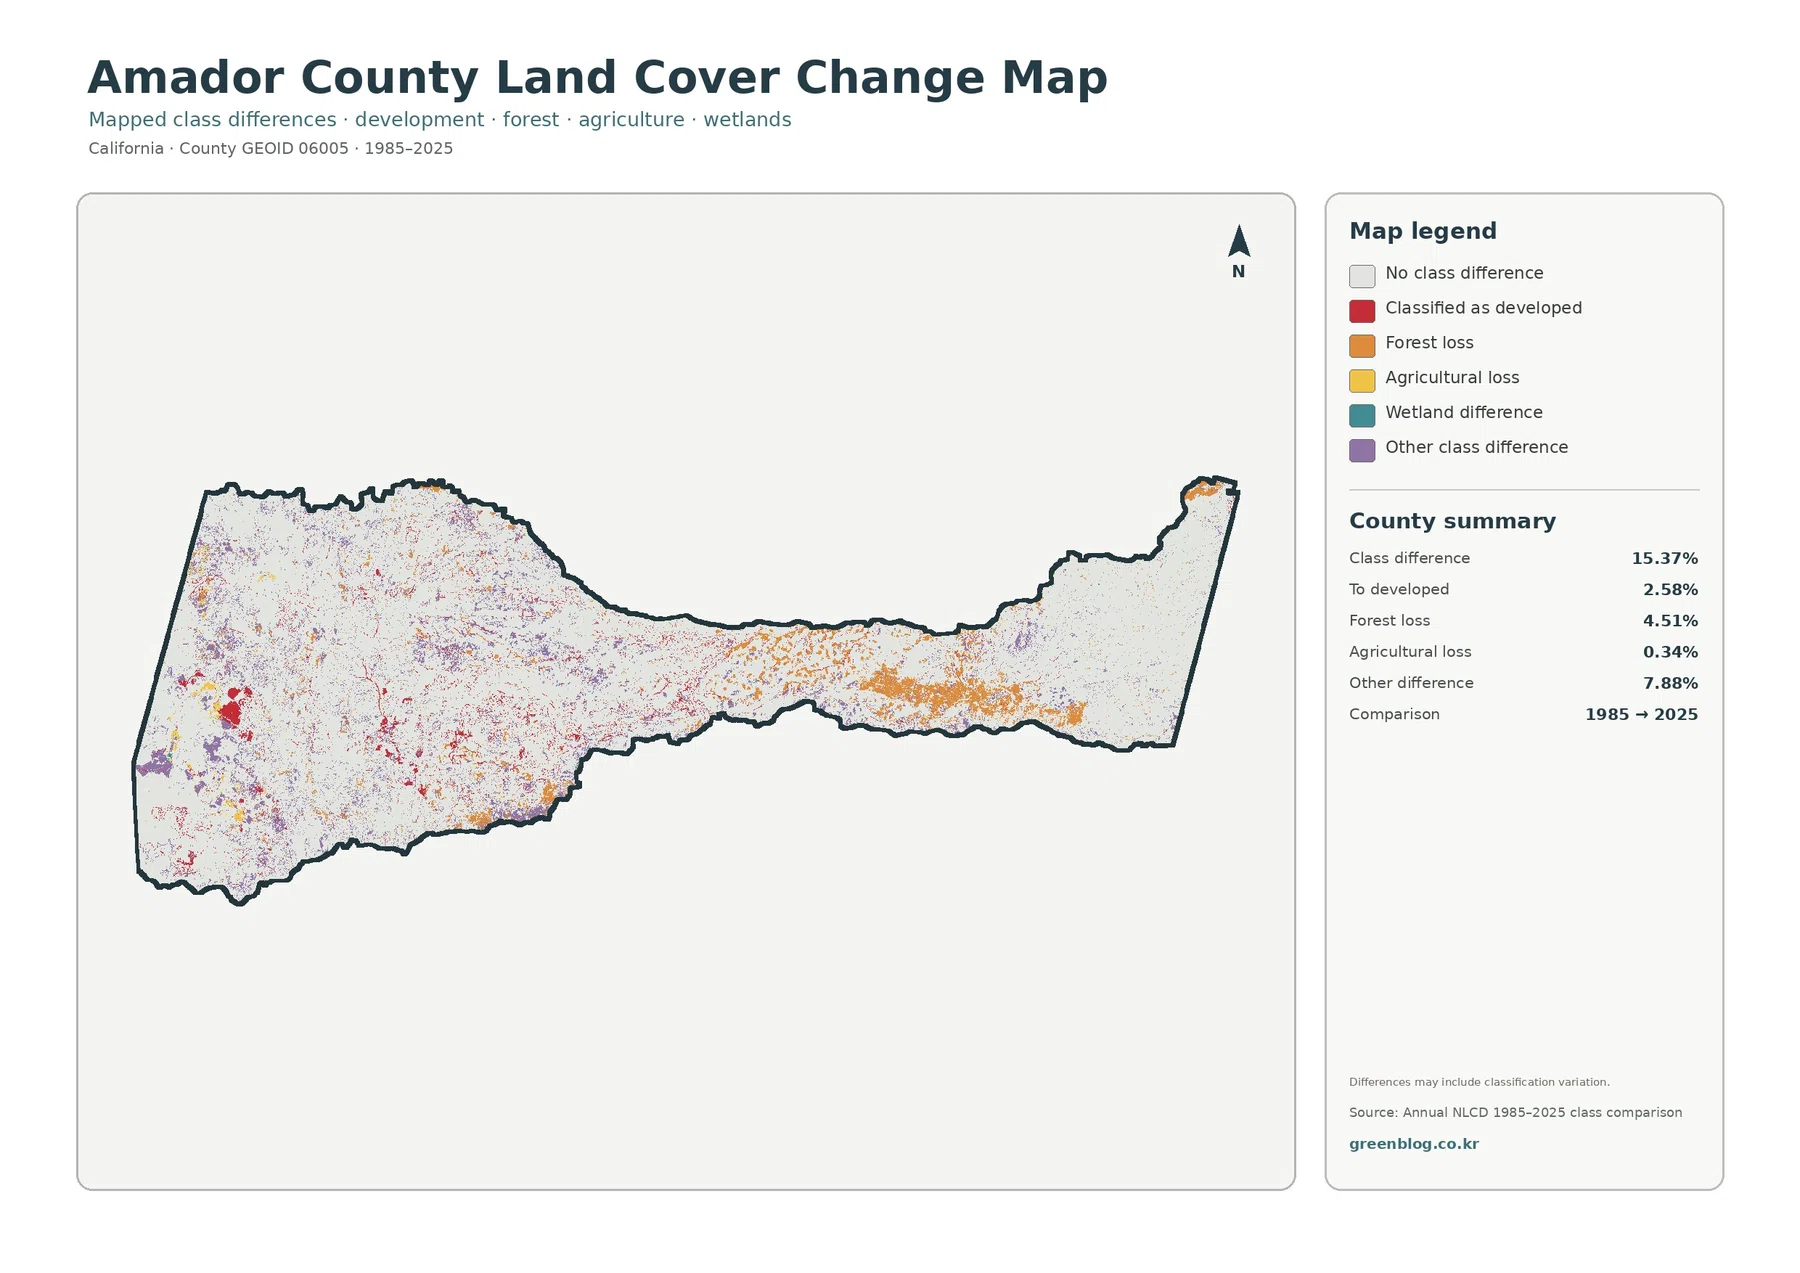
The 1985–2025 map separates development, forest loss, and other class differences
Across the county, 15.37% of cells are shown as having a class difference between 1985 and 2025. The summary assigns 2.58% to the “to developed” category, 4.51% to forest loss, 0.34% to agricultural loss, and 7.88% to other class differences. Red development changes are most noticeable in the west, whereas orange forest-loss patches extend through parts of the center and east. Purple other differences are widely scattered, especially across the western half.
Those values should not be treated as a direct reconstruction of the 1985 land-cover percentages. The 43.42% forest figure describes the 2025 map, while 4.51% forest loss describes cells assigned to a change category between two dates. A county can retain a large present forest share and still show many pixels that changed classification over forty years. Adding and subtracting the summary percentages would ignore transitions among other classes and the way the comparison product is defined.
The legend also contains a wetland-difference category, although the right-hand summary does not provide a separate percentage for it. More importantly, the map notes that class differences may include classification variation. Satellite observations, mixed pixels, seasonal conditions, and classification methods can all affect how a cell is labeled. The change map is therefore best used to locate areas that deserve closer review rather than as proof that every colored cell experienced a permanent land-use conversion.
County planning and watershed sources help place the unlabeled map in local context
Amador County’s official Countywide Housing Element coordinates planning information for the county together with Amador City, Ione, Jackson, Plymouth, and Sutter Creek. The supplied land-cover graphics do not label those city boundaries, so a developed cluster should not be assigned to a specific municipality from color alone. The county planning material is a useful companion when a reader wants to move from the broad surface pattern to named communities and current planning information.
Official California water-quality material also describes the Sacramento-Amador subwatershed as changing from flatter western terrain toward rolling and steeper Sierra foothill landscapes farther east. That regional background helps explain why a long county can contain such different surface patterns from one side to the other. It should still be treated as context rather than a substitute for the supplied maps: the land-cover figures on this page come from the map package, not from the watershed document.
The water category deserves the same care. Blue surfaces are easy to recognize on the map, but the graphic does not label individual rivers, reservoirs, or watershed boundaries. A user studying a named water body should cross-reference a hydrography or watershed source instead of inferring the name from shape alone. The land-cover map is most reliable for comparing broad surface classes within the county boundary.
Reading the four maps in sequence reduces common land-cover mistakes
Start with the general 2025 map when the goal is to understand overall composition. It keeps forest, shrubland, grassland, developed land, agriculture, water, wetlands, and barren cover in one legend. Next, the forest-and-farmland map simplifies the scene and makes it easier to see that agriculture is only 1.07%, even though open land is widespread. The impervious map should then be used for questions about pavement and rooftops rather than assuming all developed land is hard surface.
The change map works best after the present-day pattern is familiar. It answers a different question: where did the mapped class differ between 1985 and 2025, and which broad change category was assigned? This sequence can be useful for environmental education, watershed discussions, presentation graphics, landscape comparisons, and early planning context. Each map contributes a different piece of information instead of serving as a decorative variation of the same county outline.
Scale remains an important limitation. Annual NLCD is raster data, so each cell summarizes a small area rather than following parcel boundaries exactly. Narrow roads, small buildings, stream edges, or mixed vegetation can be generalized. If a project requires legal boundaries, exact acreage, engineering measurements, or parcel-level decisions, the map should be replaced or supplemented with the appropriate authoritative dataset.
The JPG download is 2480×1754 pixels per map, below the package’s A3 high-resolution reference
The ZIP contains four original JPG files: 2025 land cover, forest and farmland, impervious surface and developed land, and the 1985–2025 class-change map. Each image is 2480×1754 pixels. The supplied asset manifest specifically marks this size as not meeting its A3 high-resolution reference, so the maps should not be described as guaranteed high-resolution A3 artwork. A test print at the intended size is recommended when small legend text must remain sharp.
The on-page WebP previews are useful for browsing, while the JPG files provide the larger finished graphics for documents, slides, worksheets, and moderate-size printing. They are not raw GIS layers. Users who need to recalculate percentages, inspect individual raster cells, or combine the data with other boundaries should download the official Annual NLCD and Census source data linked below.
Frequently Asked Questions
What are the largest 2025 land-cover classes in Amador County?
Forest is the largest at 43.42%, followed by shrubland at 23.50% and grassland at 22.96%. Together, those three classes account for most of the county and explain the strong contrast between forested and open areas.
Why is developed cover 6.53% when mean impervious surface is only 1.39%?
The products measure different things. Developed land-cover cells can contain lawns, trees, soil, and other permeable surfaces, while the impervious layer estimates the share occupied by pavement, roofs, and other hard surfaces.
Does the 15.37% class difference mean that 15.37% of Amador County was permanently converted to a new land use?
No. The comparison can include classification variation, and its categories describe differences between two mapped dates. Confirming permanent land-use change requires additional annual data, imagery, or local records.
Map File Information
The ZIP contains four original JPG maps for Amador County: 2025 land cover, forest and farmland, impervious surfaces and developed land, and the 1985–2025 land-cover change comparison.
- File Type: ZIP containing four JPG files
Related Maps
- Alameda County California Land Cover Map
- Alpine County California Land Cover Map
- A Craighead County Arkansas Land Cover Map
Sources and References
Land-cover percentages and 1985–2025 change values in this article come from the supplied Amador County map package. The following official sources provide the Annual NLCD classification framework, county boundary data, and local planning or watershed context used to interpret the maps.
- MRLC Annual NLCD Data — official access to Annual NLCD land-cover products.
- USGS Annual NLCD Land Cover Classification — explains the principal land-cover classes used in Annual NLCD.
- U.S. Census Bureau TIGER/Line Shapefiles — official geographic boundary data for county mapping.
- Amador County Countywide Housing Element — official planning information covering the county and its incorporated cities.
- California Regional Water Quality Control Board — Sacramento-Amador Subwatershed — official regional context for watershed and terrain conditions involving part of Amador County.
Green Map creates custom-edited map images using open geographic data sources such as geoBoundaries, Natural Earth, OpenStreetMap, and government open data.
These maps are edited visual materials, not raw data files, and are provided for education, documents, presentations, and graphic reference.