Maricopa County is defined by a striking contrast: a broad continuous urban area fills the middle of the county, while desert and mountain country extends far beyond it. Phoenix sits at the center of a dense group of cities, major highways, and river corridors, but the county boundary reaches well west and southwest into much less urban land. The maps on this page show that contrast through county boundaries and roads, major-city distribution, water and terrain, and elevation. Matching high-resolution JPG files are available together in the download box below.
The first thing to notice is how tightly Phoenix, Mesa, Gilbert, Chandler, Scottsdale, Glendale, Tempe, Peoria, and several western suburbs cluster compared with the rest of the county. Gila Bend, by contrast, sits well to the southwest of the Phoenix metropolitan area. That separation makes Maricopa County more than a map of metropolitan Phoenix: it also includes long stretches of lower desert, isolated ridges, river washes, and a much higher northeastern margin.
Table of Contents
Phoenix fills the middle, while the county stretches far beyond it
The general county map places Phoenix near the center of a nearly continuous urban band. Glendale, Peoria, and Surprise extend toward the northwest; Avondale, Goodyear, and Buckeye spread west along the I-10 corridor. To the east and southeast, Scottsdale, Tempe, Mesa, Gilbert, and Chandler form another closely spaced group. The amount of developed area shown around these cities is very different from the open western and southwestern parts of the county.
Major roads follow the same concentration. Interstate 10 crosses the urban area from the Buckeye side through Phoenix and continues east. Interstate 17 runs north from Phoenix, while US 60 provides another major cross-county route. Loop 303 is visible around the western suburbs, and AZ 87 and AZ 88 head toward rougher country in the northeast and east. These roads make the basic map useful for seeing where the metropolitan grid gives way to much more widely spaced routes.
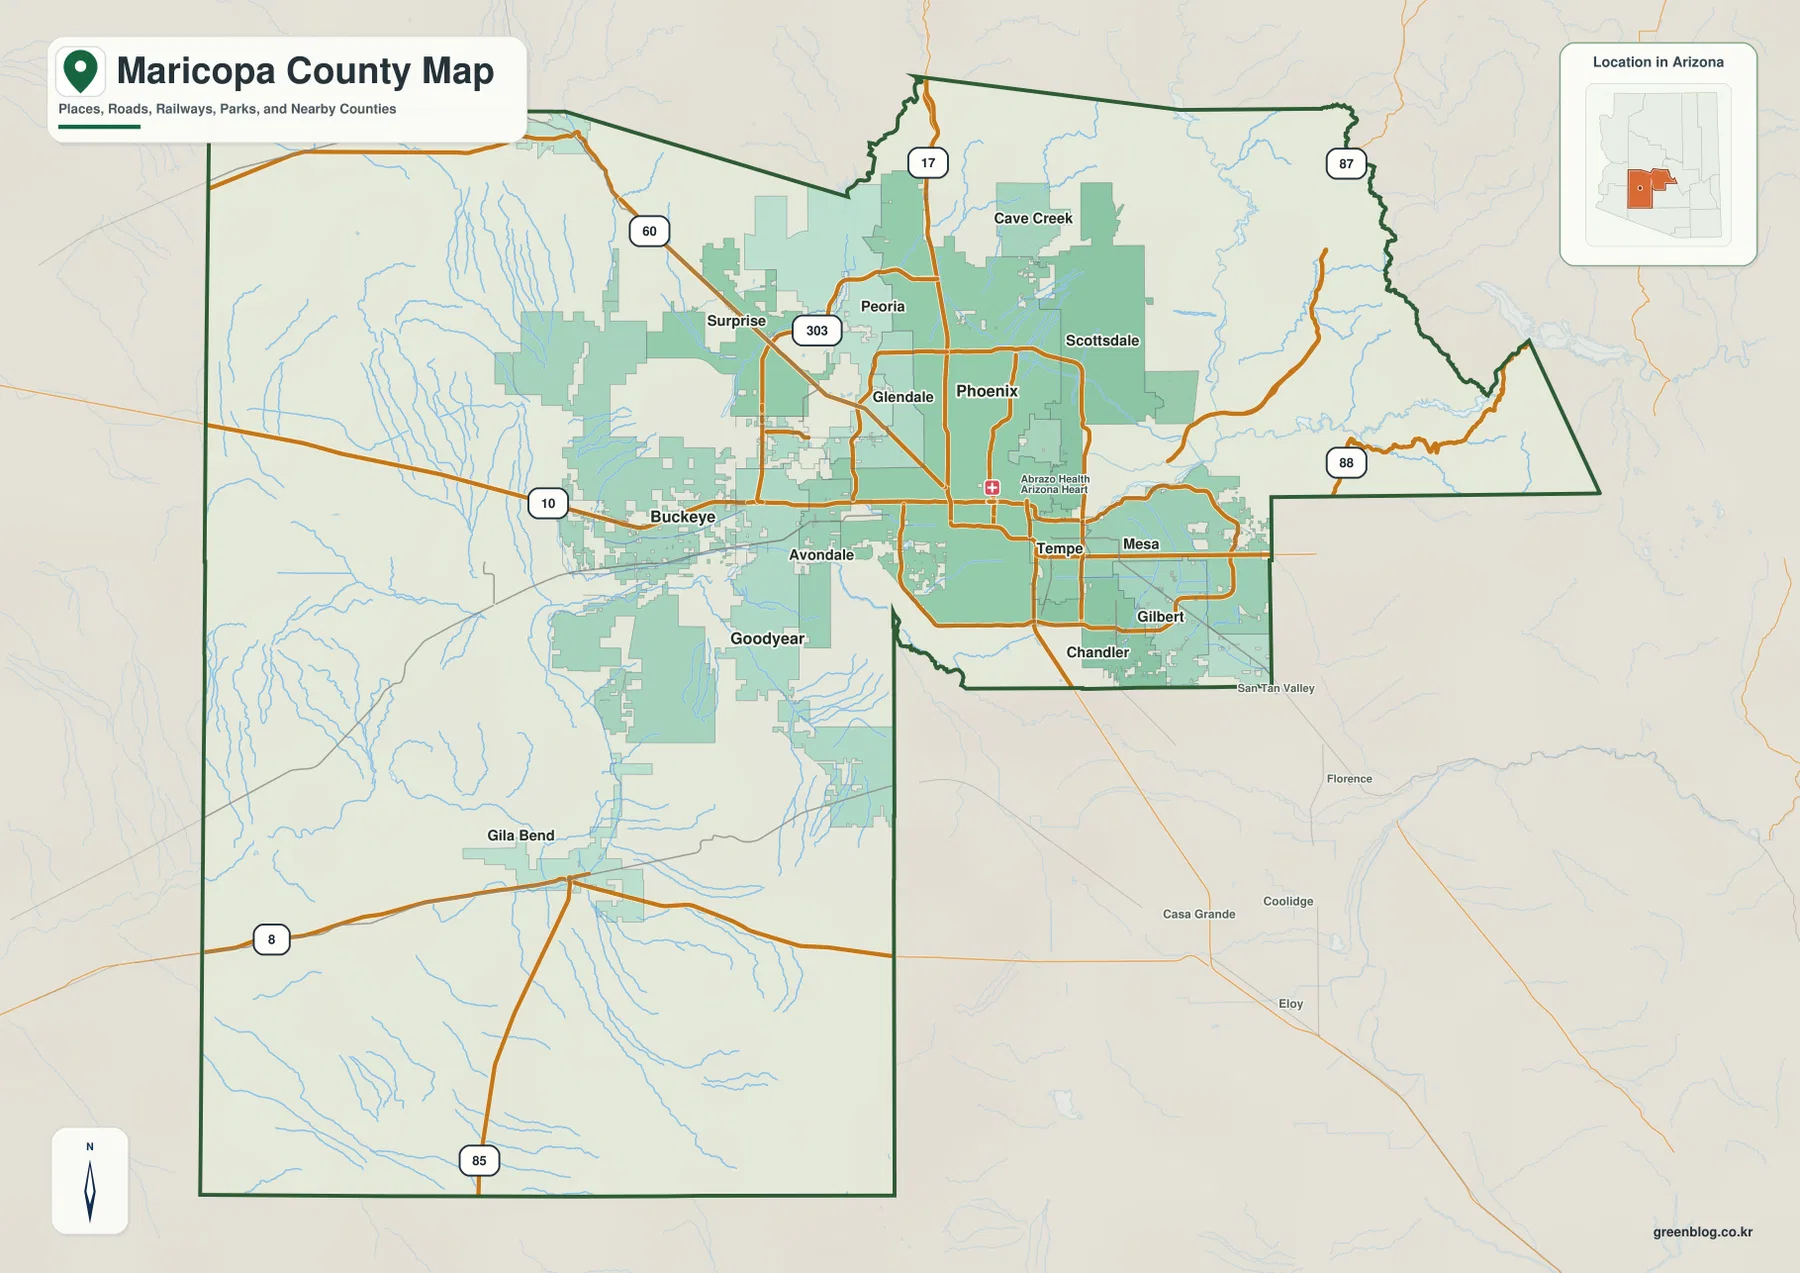
The county outline itself is irregular. It has a broad western block, a more urbanized central and southeastern section, and a narrower projection toward the east. That shape matters when reading the map because the Phoenix metro area occupies only part of the total county. A visitor looking only at the central cluster could easily miss how far Maricopa County extends into sparsely settled desert and mountain terrain.
Six major cities reveal how concentrated the metro core is
The city-index map strips away much of the road detail and highlights six major cities. Its printed index ranks Phoenix first, Mesa second, Gilbert third, Chandler fourth, Glendale fifth, and Scottsdale sixth. The numbers are part of the supplied map’s city index, so they are best used as labels for this map rather than as a claim about a newly calculated current population ranking.
The geometry is more important than the ranking. Phoenix is surrounded by Glendale to the west, Scottsdale to the northeast, and Mesa to the east. Gilbert and Chandler sit close together to the southeast. All six markers occupy a relatively compact portion of the county, leaving the broad western and southwestern sections without comparable major-city points. That visual gap is one of the clearest ways to understand the county’s urban concentration.
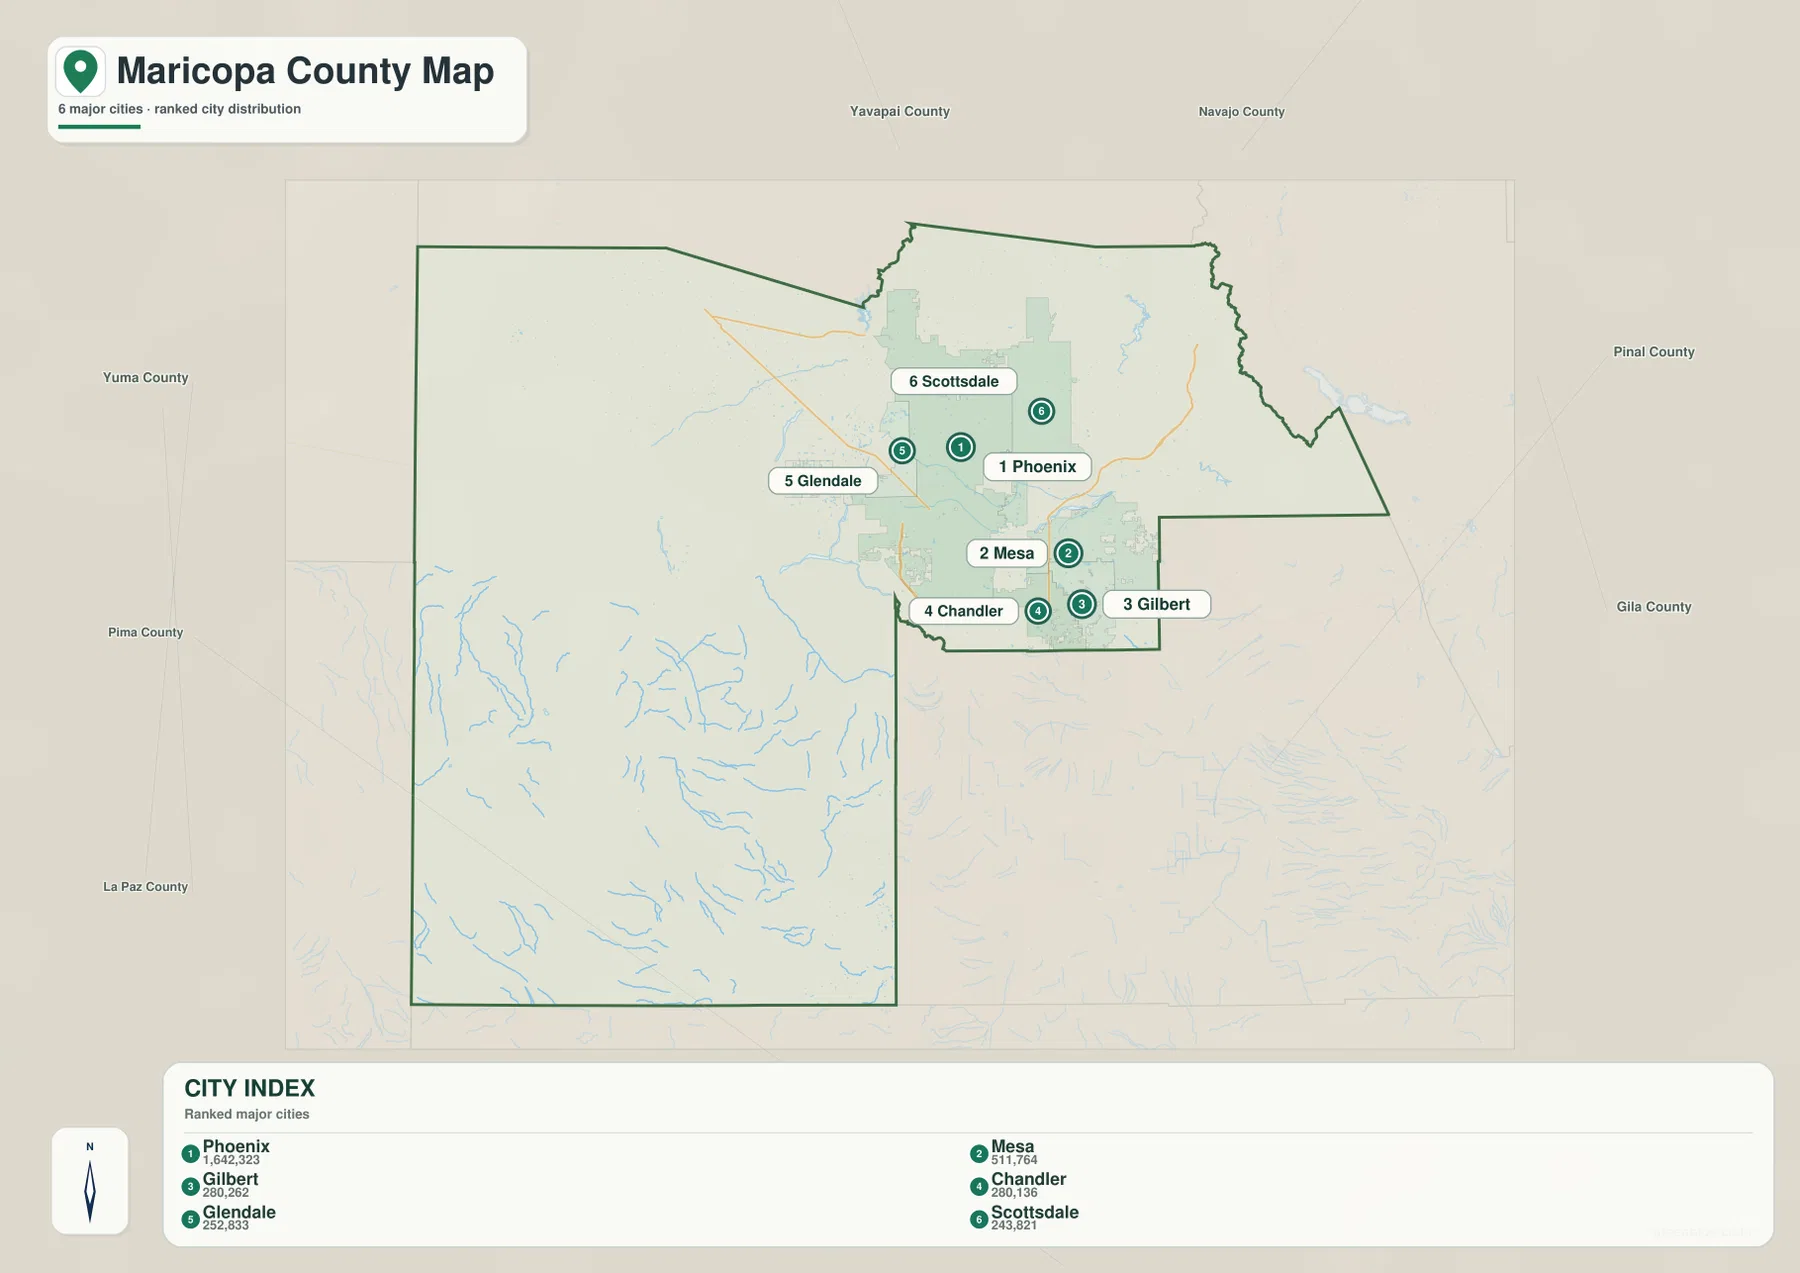
This is not a driving-distance or travel-time map. Its value is in showing relative placement. From Phoenix, the major-city pattern fans east toward Scottsdale and Mesa and then southeast toward Gilbert and Chandler, while Glendale lies to the west. The layout helps explain why many roads and developed areas overlap in the metropolitan core even though the county as a whole is much larger.
Salt River, Gila River, and Verde River connect the low basin to higher country
The terrain-and-water map changes the emphasis completely. The Salt River enters from the east and follows lower terrain toward the central part of the county. The Gila River crosses the south-central area and continues west, while the Verde River approaches from the northeast. Sycamore Creek is labeled near the northeastern side, adding another watercourse that descends from rougher terrain.
Several named water bodies appear in the higher northeastern section, including Bartlett Reservoir and Saguaro Lake, with Fountain Hills Lake shown farther toward the metro edge. To the west, the Hassayampa River and Agua Fria River trace long north-south paths through more open terrain. The map also labels Gila Bend Canal in the southwest. Together, these features show that the county’s water geography is not concentrated in one place but follows several different valleys and mountain fronts.
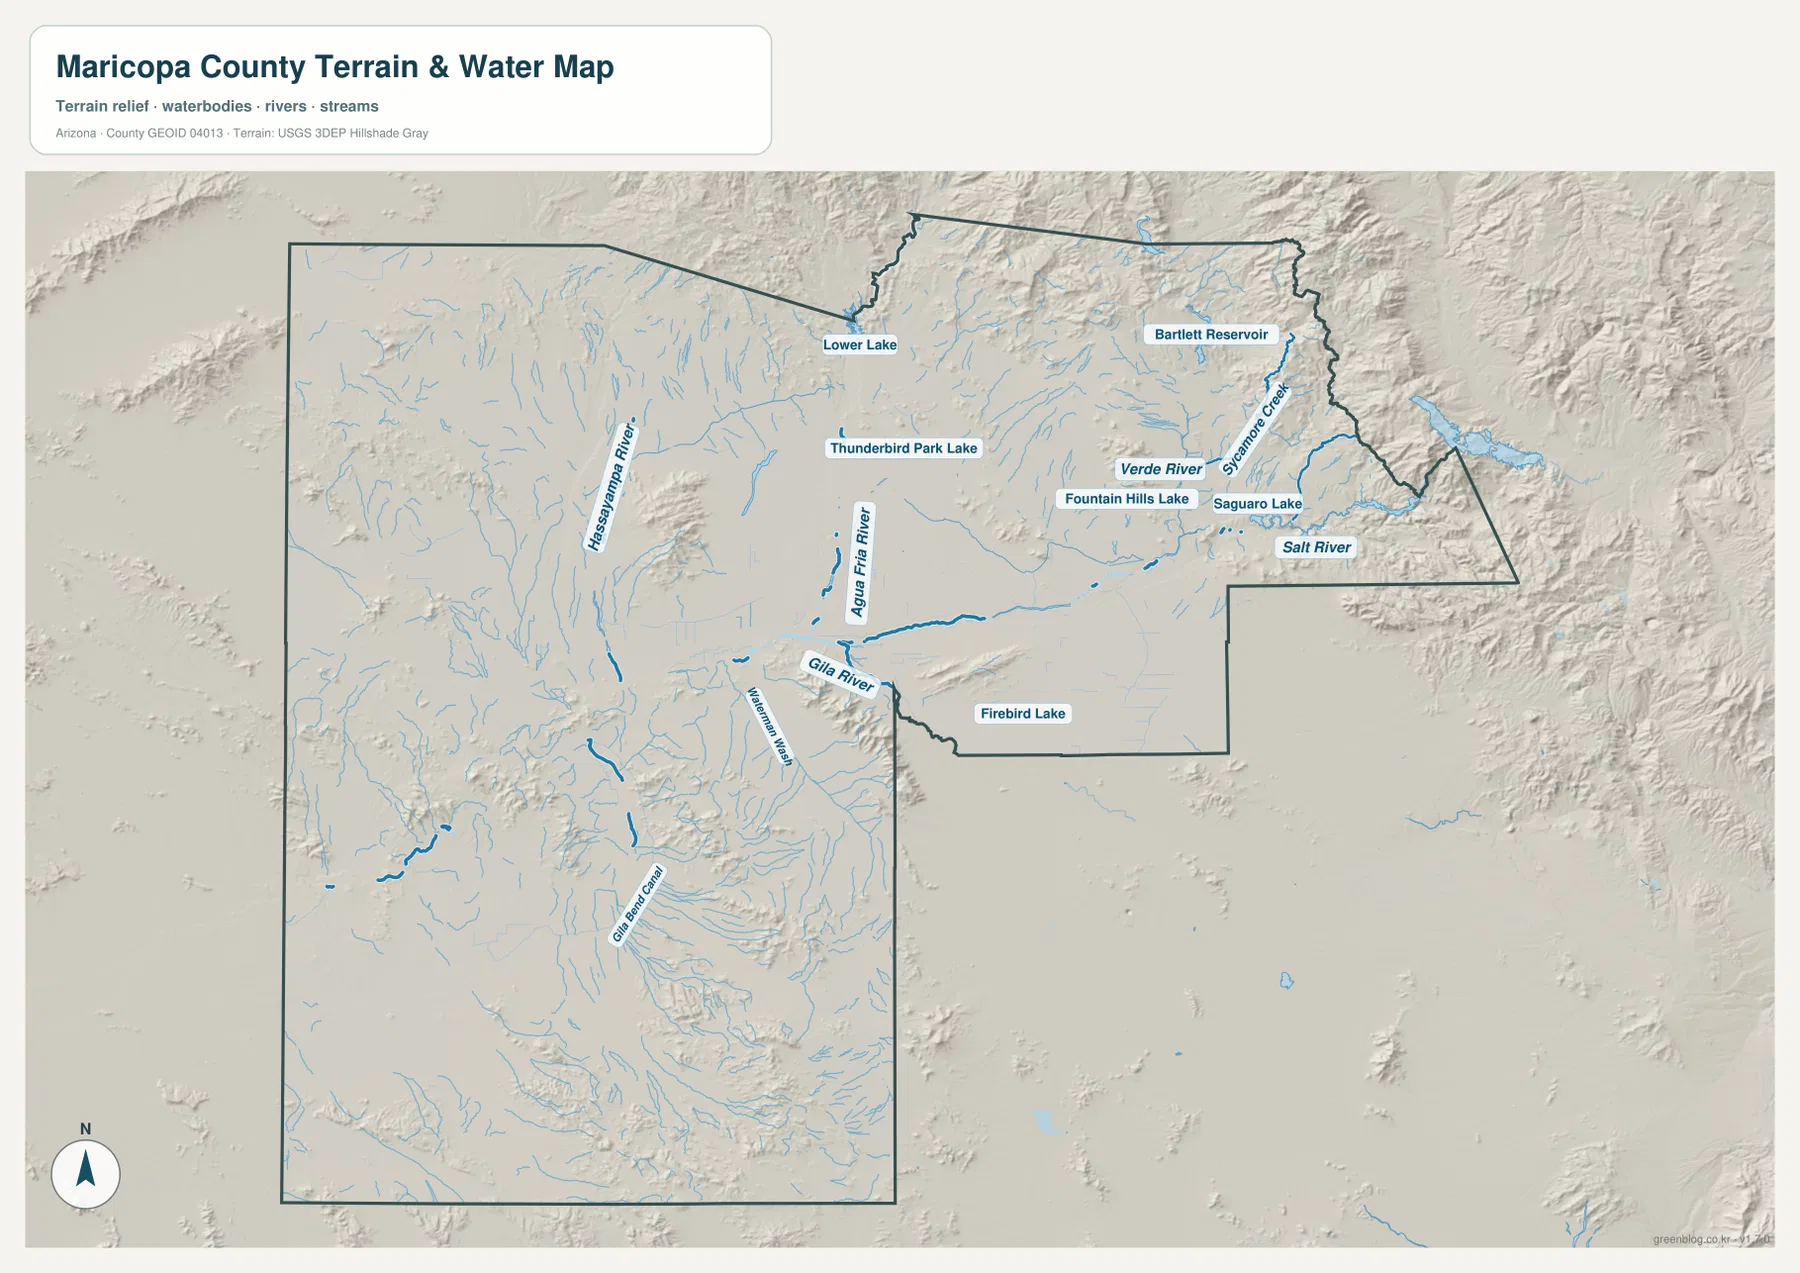
The shaded relief is especially useful around the northeastern reservoirs because the channels sit among much steeper land than the central basin. In the west and southwest, the same map shows broad low areas crossed by many smaller washes. This is a reference map for waterways and terrain, not a flood-zone, parcel, legal-boundary, or navigation product. Flood risk or property-specific questions require the appropriate official datasets.
A low Phoenix basin rises sharply toward the northeastern mountains
The elevation map makes the county’s relief easy to compare. Its legend reports an actual range of about 130 to 2,269 meters, with a mean of 498 meters. Most of the central and western county appears in the lower elevation colors, while the northern and especially northeastern edge rises into much higher terrain. That change is large enough to be visible immediately without needing contour lines.
The northeastern corner contains the broadest concentration of high ridges, and the eastern projection also climbs above the central basin. Smaller isolated ranges rise from the western desert as well, but they are surrounded by much lower country. The Phoenix metropolitan area occupies a generally lower basin interrupted by local mountains, which helps explain the visual difference between the dense urban center and the rougher county margins.
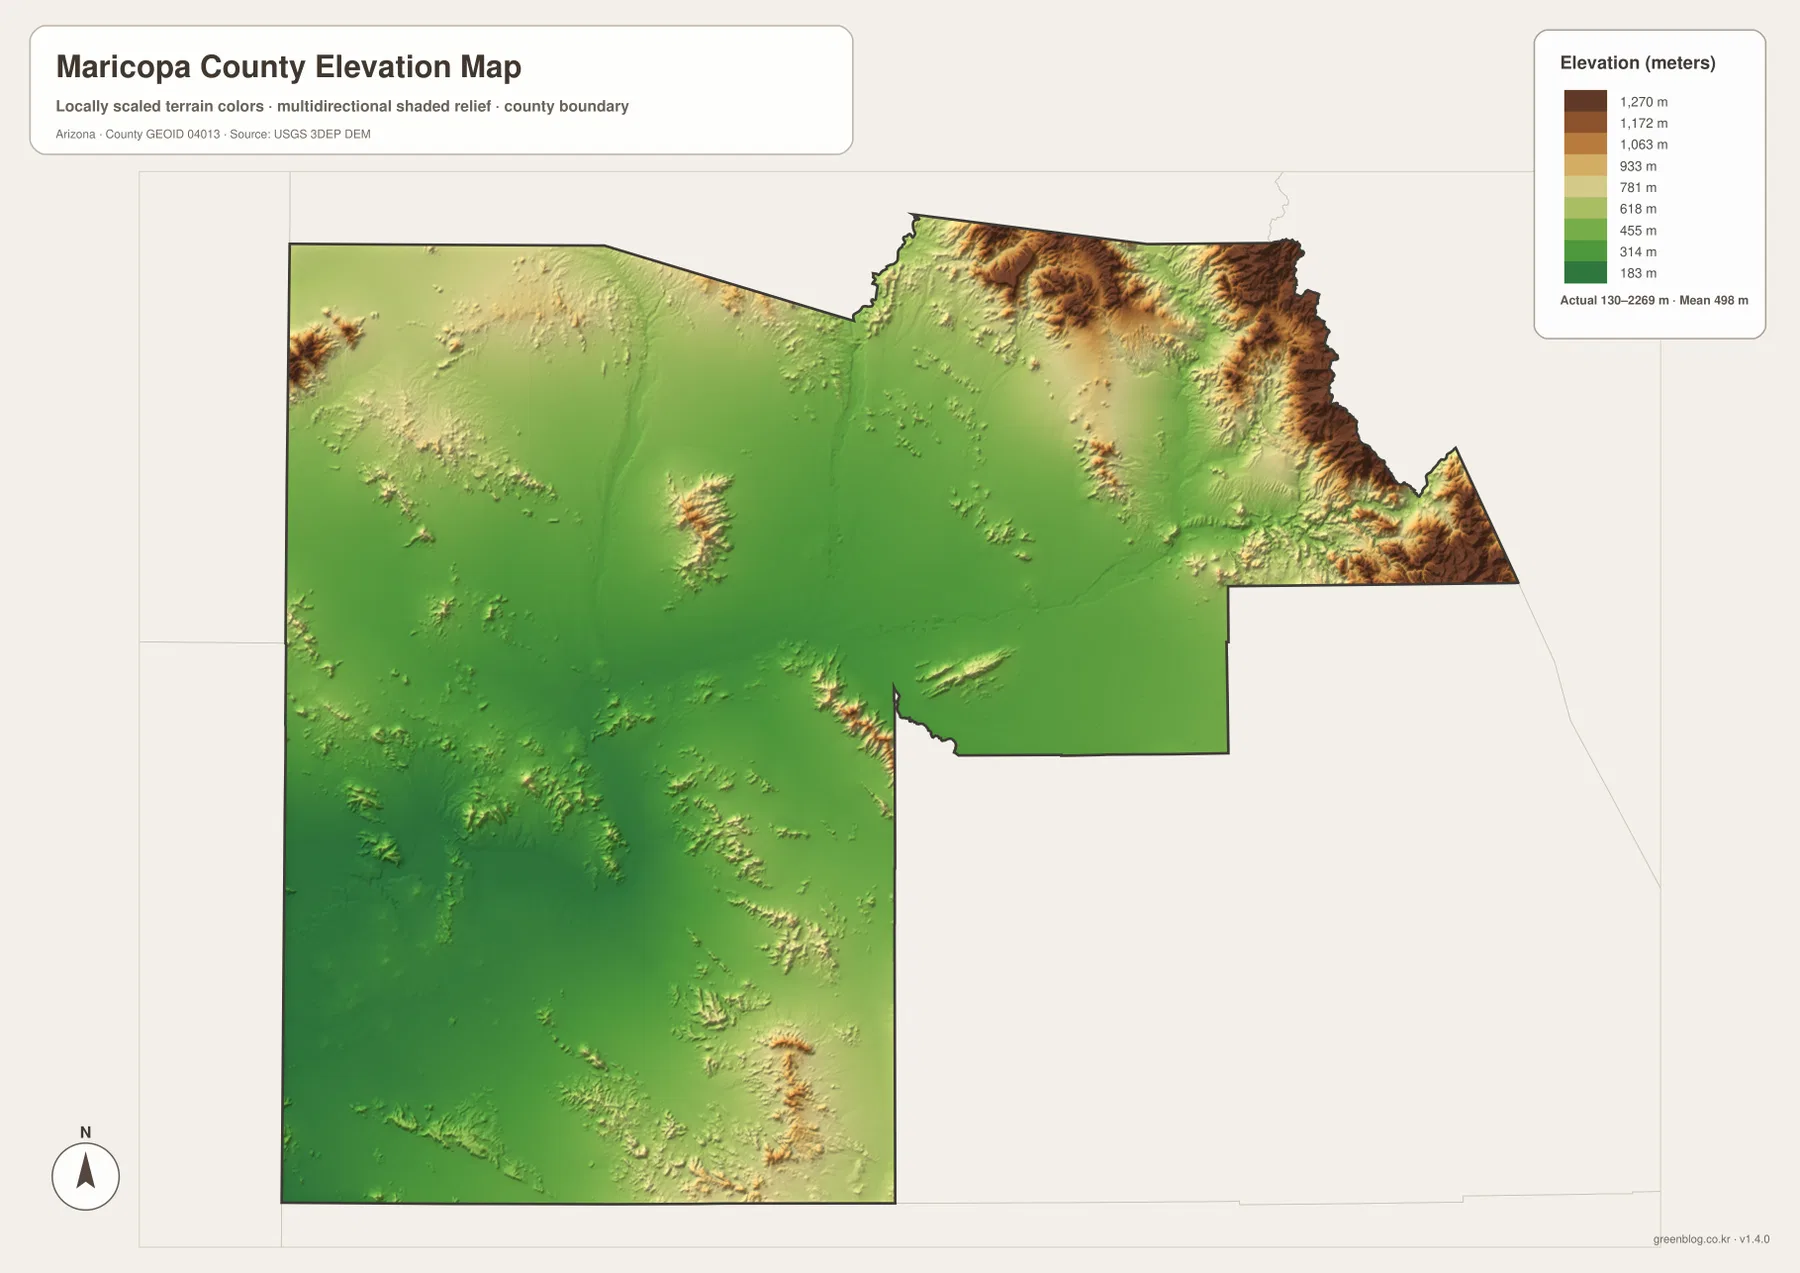
The elevation surface is designed for county-scale comparison. It should not be treated as survey-grade or engineering-grade measurement for a road, building site, or property. For those tasks, the underlying elevation data should be checked at an appropriate scale. Here, the main takeaway is the large rise from the metropolitan basin toward the northeast and the presence of isolated mountain ranges within otherwise low desert terrain.
Reading roads, cities, rivers, and relief as one county
Each map answers a different practical question about Maricopa County, but the strongest picture comes from comparing them. The densest group of cities sits where I-10, I-17, US 60, and other major roads cross the central basin. The Salt and Gila rivers also follow lower ground through or near this broad low area. Farther northeast, the city symbols thin out as reservoirs, river valleys, and higher ridges become more prominent.
West of the main metro area, the urban pattern becomes less continuous after Surprise and Buckeye. The county still extends a long distance across lower desert, and Gila Bend stands apart in the southwest near a different road pattern. That makes the western and southwestern map sections useful reminders that Maricopa County is not simply a boundary around Phoenix; it includes a large amount of open land with very different settlement and terrain.
Use the general map when roads, communities, and the county boundary matter most. The city map is best for comparing the placement of the six highlighted major cities. The terrain-and-water map is more useful for Salt River, Gila River, reservoirs, and mountain drainage, while the elevation map makes the basin-to-mountain change easiest to see. The downloadable archive below contains the original high-resolution JPG versions of all four supplied maps.
Frequently Asked Questions
Why are Phoenix, Mesa, Gilbert, and Chandler so close together on the city map?
The supplied city map shows the county’s six highlighted major cities concentrated in the metropolitan core. Phoenix is central, Mesa lies to the east, and Gilbert and Chandler are grouped to the southeast. Glendale is west of Phoenix and Scottsdale is to the northeast. The map is meant to compare relative locations, not road mileage or travel time.
Where does elevation change the most across Maricopa County?
The largest county-scale contrast is between the broad low basin across the central and western sections and the much higher terrain along the north and northeast. The map legend gives an actual range of roughly 130 to 2,269 meters, so the difference is substantial even though much of metropolitan Phoenix occupies relatively low ground.
Which rivers and reservoirs are labeled on the water map?
Major labels include the Salt River, Gila River, Verde River, Hassayampa River, and Agua Fria River. Bartlett Reservoir and Saguaro Lake are also shown in the northeastern portion of the county. The map is for geographic reference and terrain context rather than flood determination or navigation.
Map File Information
The download ZIP contains high-resolution JPG versions of the four Maricopa County maps described on this page.
- Included Versions: county and roads map, major-city map, terrain and water map, elevation map
- File Type: JPG
Related Maps
Sources and references
- U.S. Census Bureau TIGER/Line Shapefiles – county boundary and geographic reference
- USGS National Hydrography – rivers, streams, and water features
- USGS 3D Elevation Program – elevation reference
Green Map creates custom-edited map images using open geographic data sources such as geoBoundaries, Natural Earth, OpenStreetMap, and government open data. These maps are edited visual materials, not raw data files, and are provided for education, documents, presentations, and graphic reference.