Brown County occupies a broad part of northeastern South Dakota, with Aberdeen serving as the easiest reference point for reading the county. On the main map, US 12 crosses Aberdeen from west to east while the US 281 corridor runs north toward Westport and Frederick. Groton lies to the east, Warner sits south of Aberdeen, and Hecla, Columbia, and Frederick are spread across the northern half. The physical maps add another layer: the James River and its tributaries cross the lower terrain, while the western side rises above much of the center and east. High-resolution JPG versions of the supplied maps are available as a ZIP download on this page.
A good way to use the set is to begin with Aberdeen and then move outward. The road map establishes the positions of the larger towns and highways; the city-index view makes the separation among Aberdeen, Groton, Warner, Hecla, Columbia, and Frederick easier to see. The water map shifts attention to the James, Elm, and Maple rivers, Richmond Lake, and several reservoirs. Finally, the elevation image explains why the western side looks different from the greener, lower central and eastern areas. Each view is most useful when it answers a specific question rather than when every feature is treated as equally important.
Table of Contents
Use Aberdeen, US 12, and US 281 to orient the county
Aberdeen is the most prominent built-up area on the general county map. The city is labeled near the southern half of Brown County, with Presentation College also shown inside the urban area. US 12 passes through Aberdeen and continues east toward Groton, creating the clearest east–west reference on the page. North of Aberdeen, the highway corridor marked with US 281 and State Route 9 continues through Westport toward Frederick. When the map is viewed at full size, rail lines and additional local roads add useful context without overwhelming the larger county pattern.
Groton appears near the eastern side along US 12, while Warner is south of Aberdeen. Columbia is north of the county center, Frederick is far to the northwest of Aberdeen, and Hecla occupies the northeast. Smaller labels such as Stratford, Ferney, Verdon, and Prairiewood Village help fill in the spaces between the larger places. This arrangement matters because Brown County is not a case where nearly every town clusters around the county seat. The northern places are widely separated, so the main road map is especially useful for understanding direction and relative location.
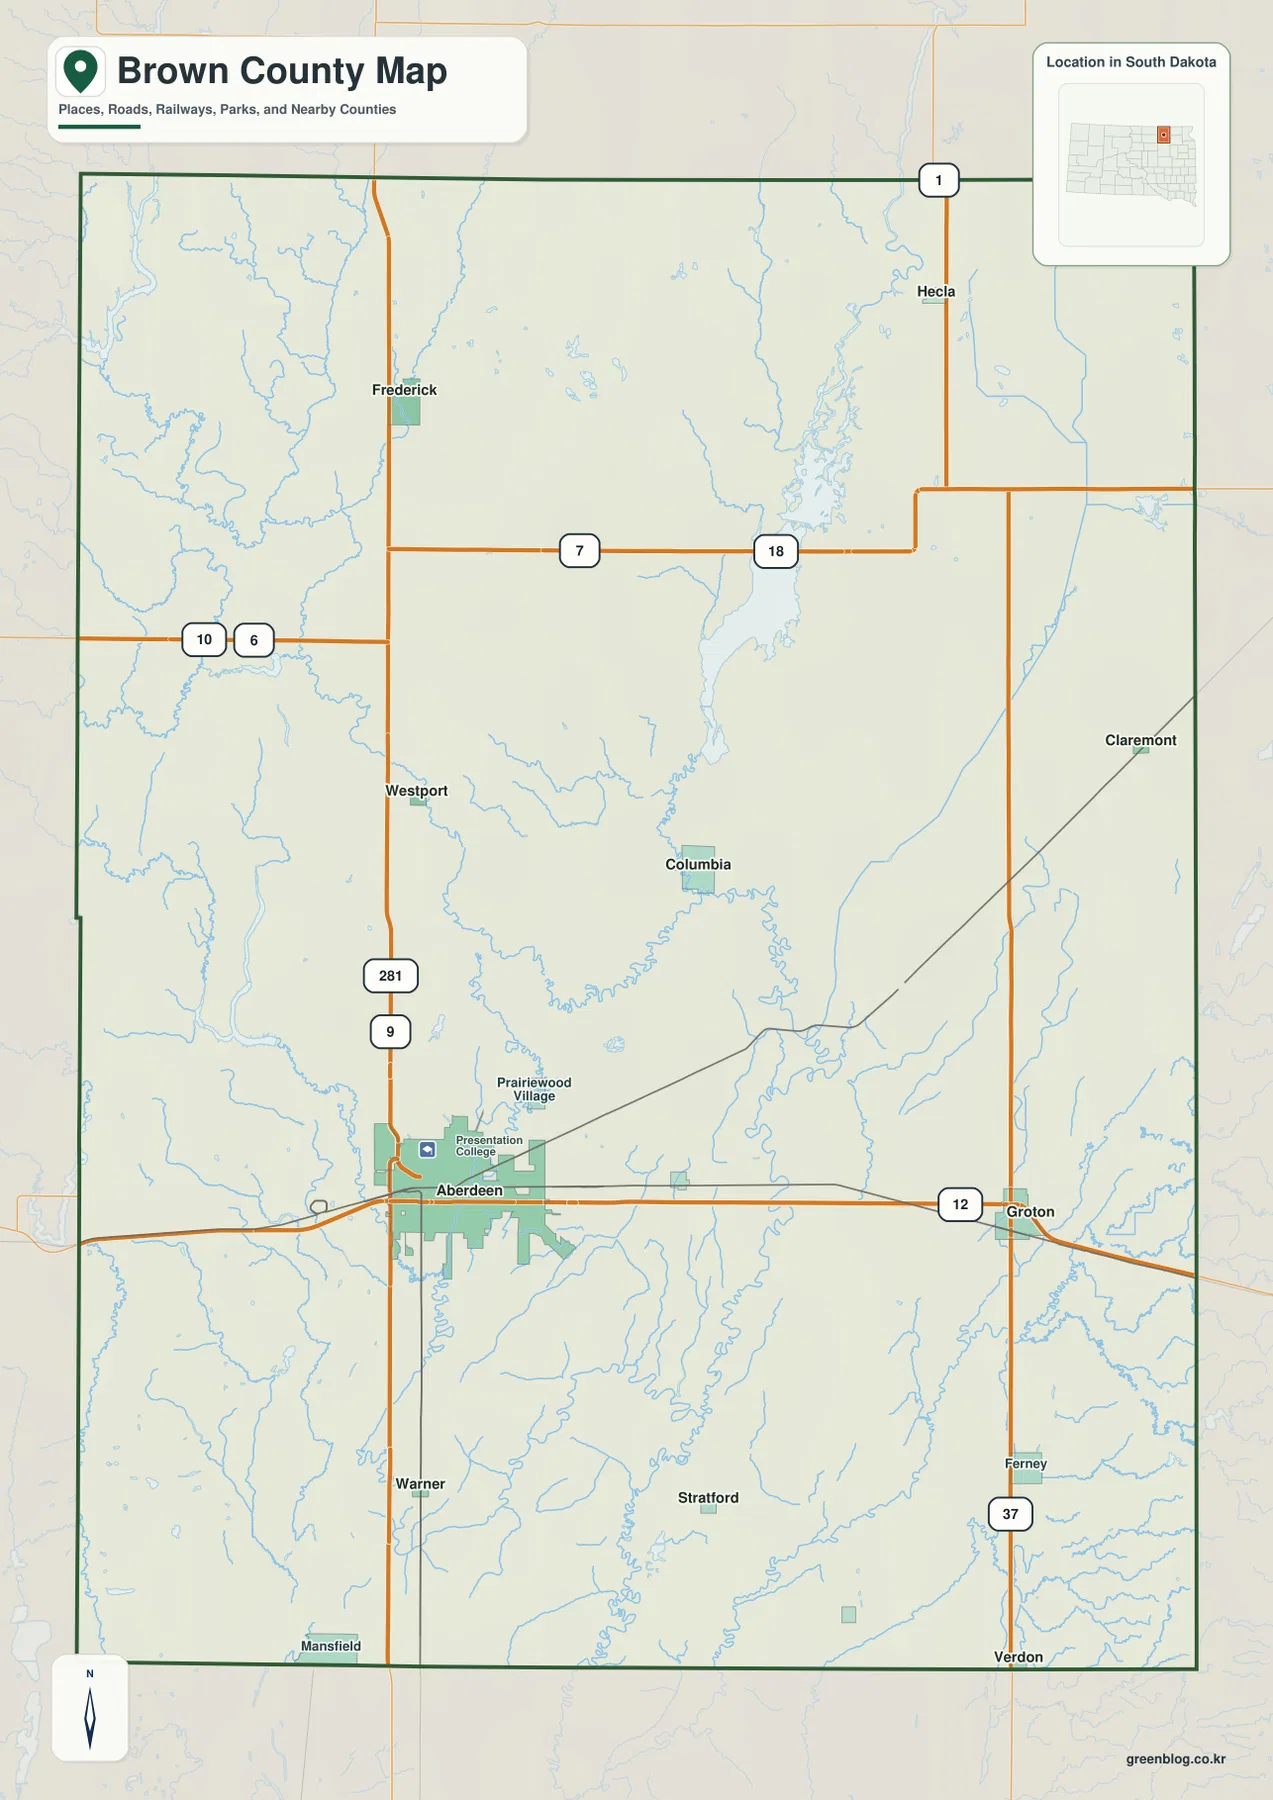
Additional numbered highways appear around the edges of the map. State Route 37 runs along the eastern side near Groton and Ferney, while Route 1 is visible farther north. Route markers 7 and 18 cross the northern interior, and Routes 10 and 6 appear near the western edge. These lines are best treated as county-scale orientation rather than street-level navigation. Farm entrances, individual parcels, local road conditions, and legal rights-of-way require a more detailed current source.
The official Brown County website describes the county as being in northeastern South Dakota and identifies Aberdeen as the county seat. That background fits the visual emphasis of the map, where Aberdeen is the largest mapped urban area and the point where major transportation lines are easiest to follow. For a visitor who only needs a quick geographic framework, locating Aberdeen first and then tracing north to Frederick, east to Groton, and south to Warner provides a simple starting pattern.
Aberdeen dominates the city index, while the other towns are widely spaced
The city-index map highlights six places and ranks them with numbered markers. Its printed CITY INDEX shows Aberdeen 28,189, Groton 1,691, Warner 512, Hecla 182, Columbia 161, and Frederick 160. Those figures are presented here strictly as values printed on the supplied map; they should not be treated as a substitute for a current Census estimate. If an up-to-date population figure or a specific statistical year matters, the U.S. Census Bureau should be checked separately. On this page, the index is most useful for comparing the displayed hierarchy and the locations of the six places.
The spatial pattern is clear even without using the numbers as current population data. Aberdeen sits in the south-central part of the county, with Groton well to the east. Warner is south of Aberdeen, Columbia lies north of the county center, Frederick is in the northwest, and Hecla is in the northeast. The large gaps between those northern towns are part of what makes the map useful. A reader can see that the county’s important named settlements are spread across a broad rural area rather than arranged in one continuous urban corridor.
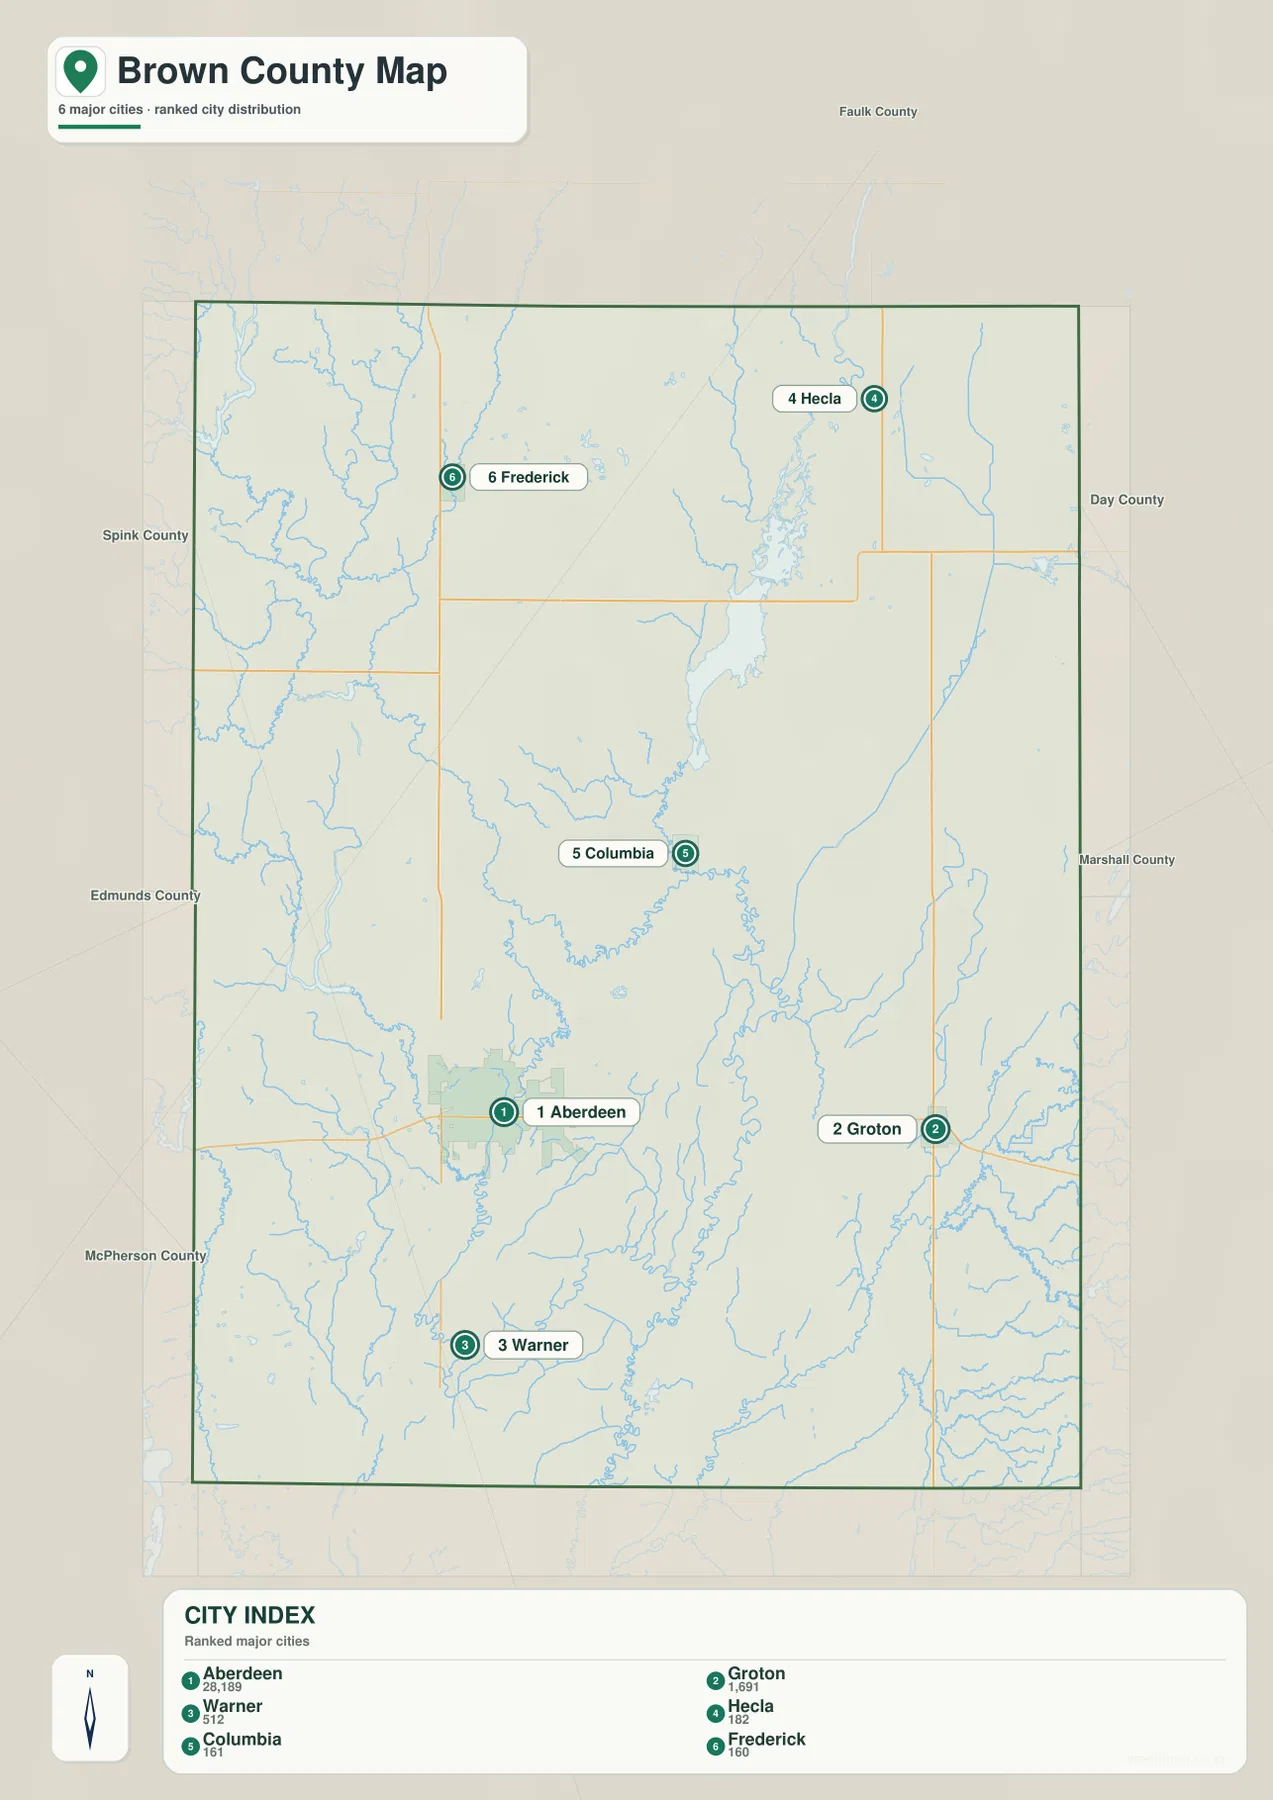
This city view intentionally removes much of the detail found on the general map. That makes it easier to compare the six highlighted places, but it also means that smaller settlements and many road labels disappear. For Groton and Aberdeen, switching back to the general map immediately reveals the US 12 connection. Frederick becomes easier to place when the US 281 corridor is restored, while Columbia and Hecla make more sense when nearby streams and reservoirs are added in the water map. The maps therefore work best as complementary references rather than as interchangeable versions of the same information.
James River, reservoirs, and lakes define much of the low country
The terrain-and-water image gives the James River the strongest visual role. Its name appears in the upper-right part of the county, and the major channel continues through the central and southern drainage system. Farther west, the Elm River and Maple River are labeled prominently, with the Maple River bending toward the larger interior water network. Thin tributaries spread across much of the county, so the drainage is not limited to a few isolated blue lines. The density of smaller streams becomes much more apparent here than on the road-focused map.
Several named lakes and reservoirs provide useful landmarks. Elm Lake lies near the northwest corner, and Willow Creek Lake appears farther south and east. Richmond Lake is shown in the western half, while Mud Lake Reservoir and the long Columbia Road Reservoir sit north of the county center. Lords Lake and Salt Lake are labeled in the southwest, and the map also identifies Foote Creek, Moccasin Creek, Mud Creek, and Dry Run. These names make it possible to follow the county from one water feature to another without relying on roads.
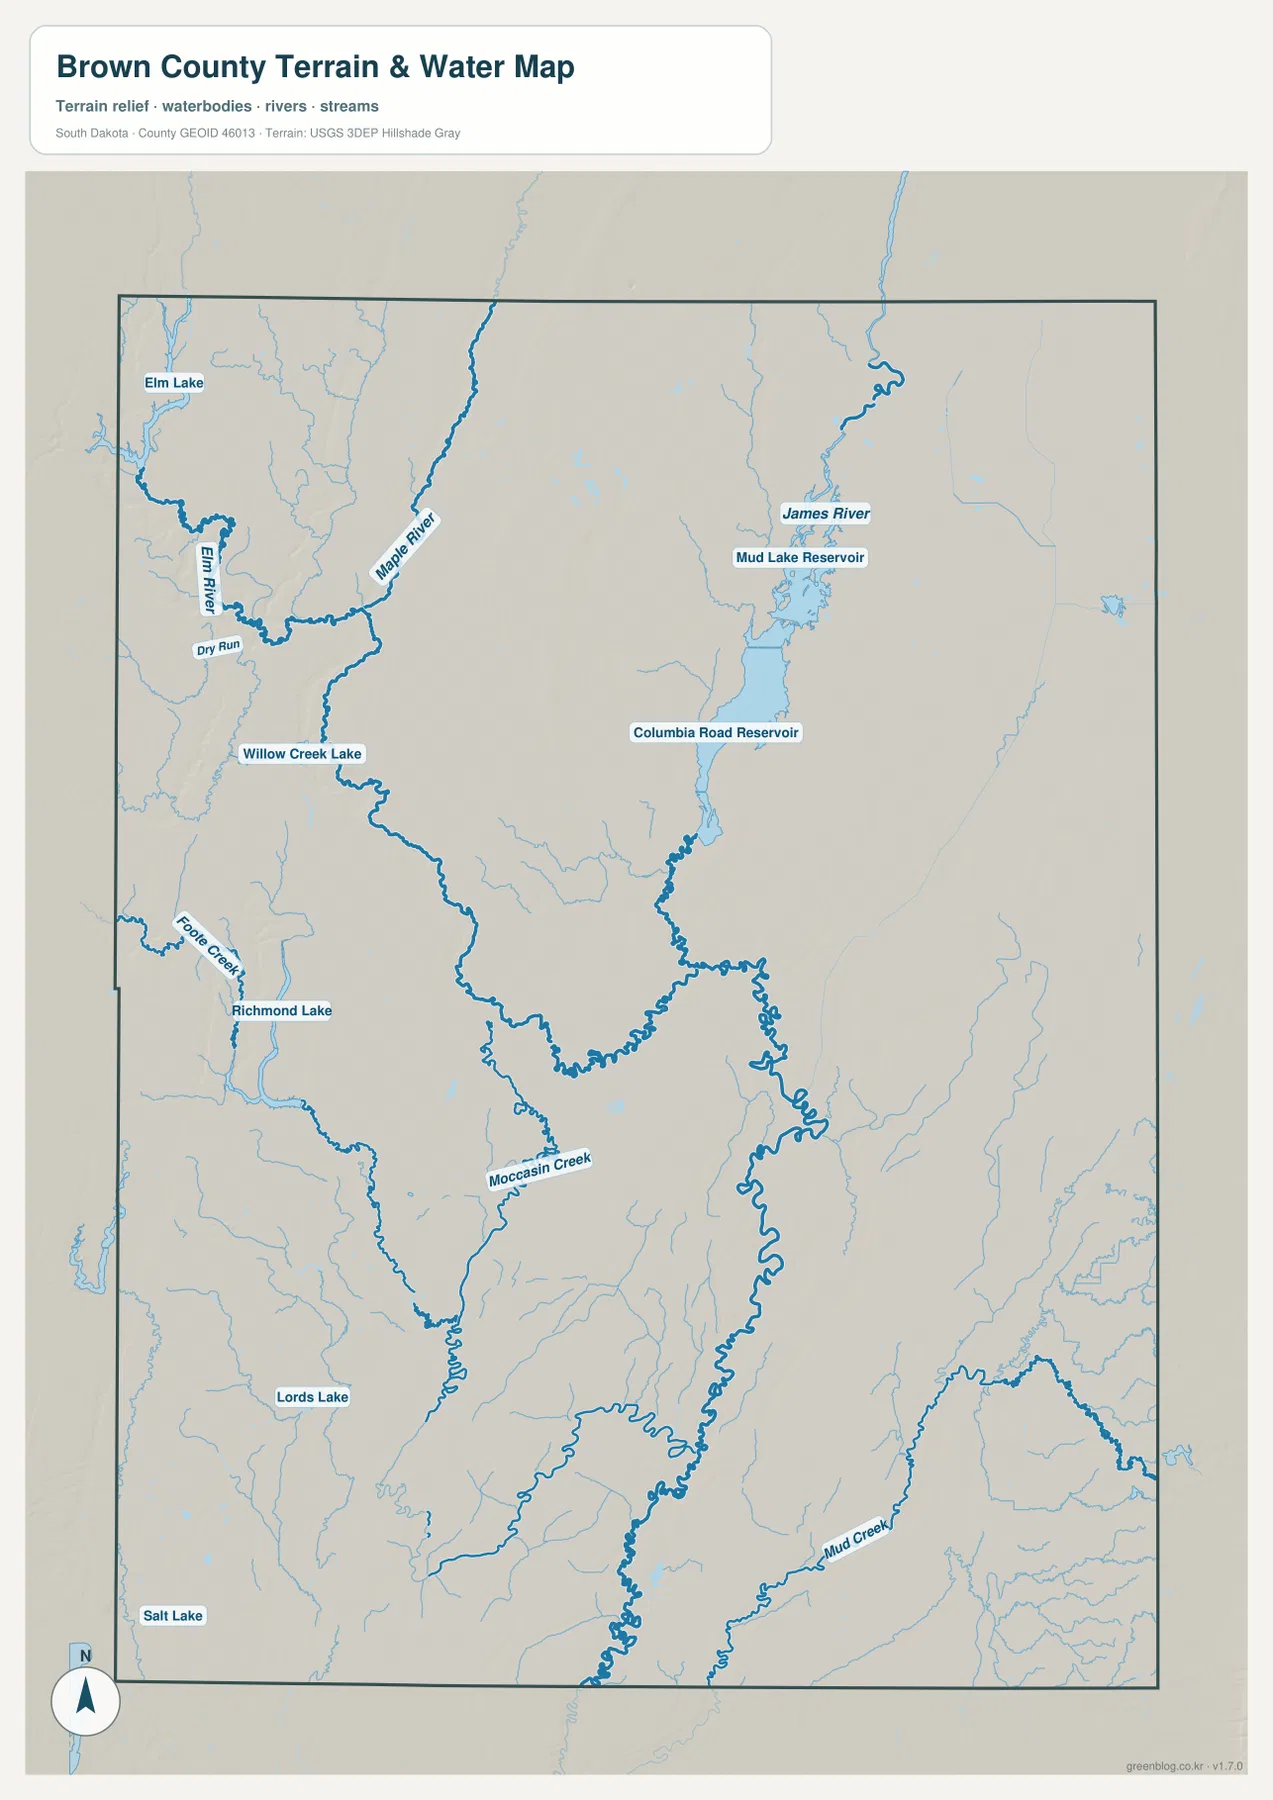
Richmond Lake is especially helpful when comparing the water image with the general county map because it provides a recognizable landmark west of Aberdeen. Columbia Road Reservoir performs a similar role north of the county center, close to the area labeled Columbia on the settlement maps. The water view also shows how many small channels occupy the land between the main towns. A reader who only looks at the highway map might see a broad open county; the hydrography adds the network of low channels that cross that same landscape.
The blue lines should not be interpreted as flood zones, property-access guarantees, current water levels, or navigation routes. Reservoir conditions and stream flow can change, and legal shorelines or flood boundaries require purpose-specific official information. This map is most appropriate for county-scale orientation: where the named rivers, lakes, reservoirs, and creeks lie in relation to the settlements and terrain.
Elevation runs from 386 to 464 m, with higher ground concentrated in the west
The elevation map reports an actual county range of about 386–464 meters and a mean of 407 meters. Browns and oranges dominate much of the western side, then fade through tan and light green toward the lower central and eastern areas. Most of the interior east of the western upland is green, showing that a large part of Brown County lies below the high ground along the west. The total difference is only about 78 meters, so this is not mountain terrain, but the broad slope and river-cut lowlands are still easy to see.
The relationship to the water map is especially useful. The James River system occupies much of the greener low country, while channels associated with the Elm and Maple rivers cut lower paths through higher western terrain. On the shaded-relief image, those valleys appear as elongated lower strips intruding into the brown and tan uplands. The far eastern edge also rises slightly in places, so the terrain is not a simple one-way slope. Instead, a low interior drainage area is bordered by somewhat higher land, most strongly on the west.
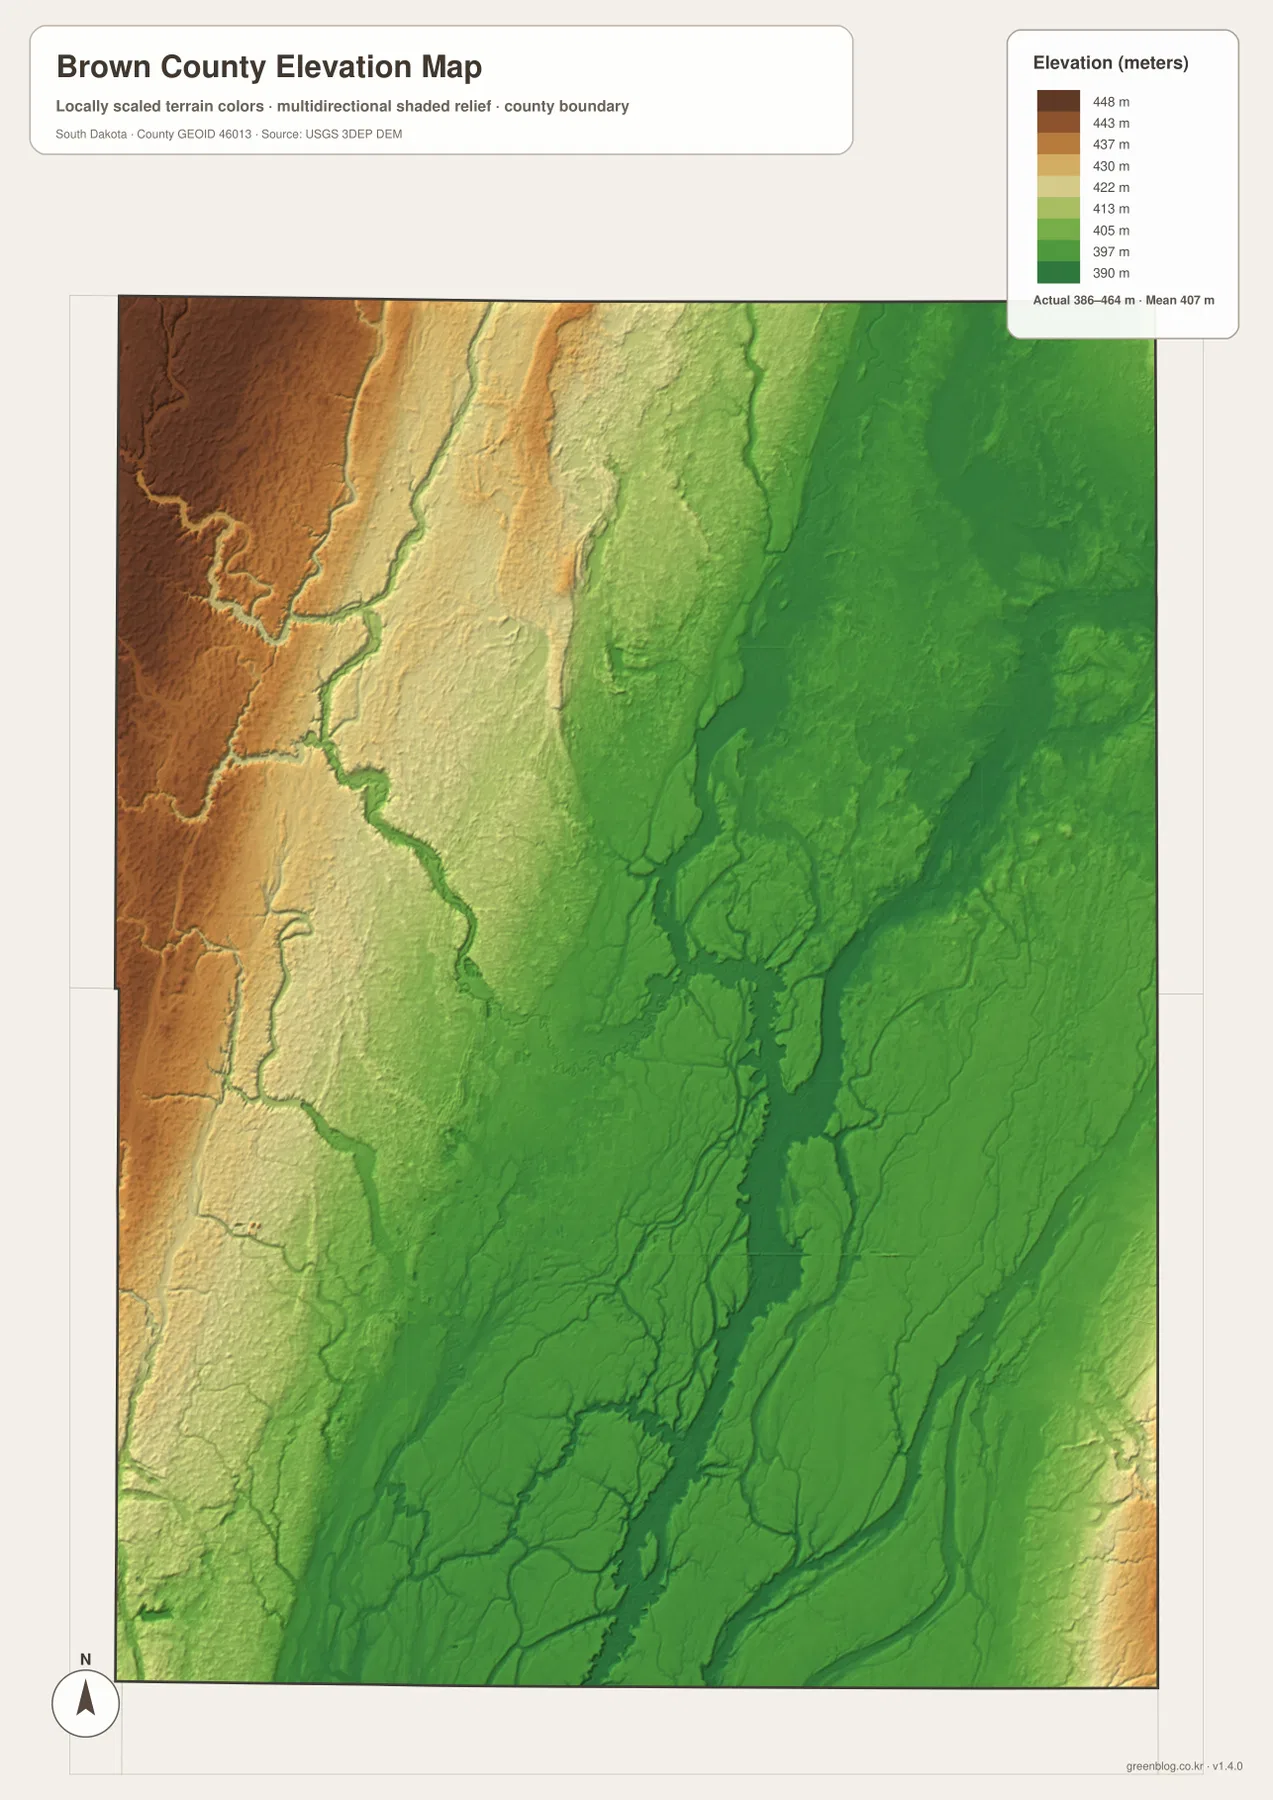
Aberdeen lies closer to the broad lower interior than to the highest western colors. Richmond Lake occupies a transition area where the western upland gives way to lower valleys, while the major river system farther east remains within the greener part of the county. This pattern helps explain why the waterways become such strong features when the terrain and water layers are viewed together. The elevation image is still a county overview, however, not an engineering survey. Exact elevations for a building site, road project, or drainage design should come from USGS source data or a professional field survey.
Connect Aberdeen’s road network with the James River lowlands
Using Aberdeen as a common reference point makes the differences among the images easy to understand. The general map begins with US 12 and US 281, showing how Groton, Warner, and Frederick relate to the county seat. The city-index view strips away most route detail and makes Aberdeen’s dominance among the six highlighted places obvious. The water image then reveals the streams, reservoirs, and larger river channels occupying the same countryside, while the elevation image shows that many of those channels follow the lower green terrain.
Groton provides another useful comparison. On the road map, it is reached by following US 12 east from Aberdeen. In the broader physical context, the eastern side sits near an extensive network of tributaries and the low James River country. Frederick presents the opposite visual relationship: it lies north of Aberdeen along the US 281 corridor and closer to the higher western part of the county. Columbia is easier to understand after the water layer is added because the long Columbia Road Reservoir and nearby drainage features give the central-northern area a distinctive reference point.
Warner, south of Aberdeen, falls near the transition between the higher western colors and the lower central terrain. Hecla is isolated in the northeast, while Columbia and Frederick occupy different parts of the northern half. These positions make Brown County a good example of why one county map cannot answer every geographic question at once. A road-focused view is the fastest way to find towns; the physical maps explain the rivers and relief that lie between them.
Choose the image that matches the question you need to answer
For Aberdeen, Groton, Warner, Hecla, Columbia, Frederick, US 12, US 281, rail lines, and other large routes, the general county map is the best starting point. The city-index image is cleaner when the goal is simply to compare the six highlighted settlements and their distribution. Because its numbers are printed index values rather than a guaranteed current dataset, current demographic research should be paired with Census information rather than relying on the image alone.
For the James, Elm, and Maple rivers, Richmond Lake, Mud Lake Reservoir, Columbia Road Reservoir, and smaller creeks, the terrain-and-water image is much more effective. It reduces the road emphasis and gives water features enough visual weight to follow across the county. The elevation image is the better choice for explaining the 386–464 meter range, the 407-meter mean, the higher western land, and the lower central and eastern drainage areas. These two physical views are especially useful together because the river valleys line up with many of the lower shaded areas.
The WebP images in the article are scaled for quick viewing on the web. The download ZIP provides the original high-resolution JPG files at 3638 × 2572 pixels each, giving more room for zooming and printing. These are county-wide reference maps, not parcel surveys, live traffic products, flood-insurance maps, or engineering elevation plans. For legal, safety, or design decisions, use the current official resource intended for that purpose.
Frequently Asked Questions
Are the Aberdeen 28,189 and Groton 1,691 figures current population estimates?
Not necessarily. This article treats those numbers only as values printed in the CITY INDEX on the supplied image. The index shows Aberdeen 28,189, Groton 1,691, Warner 512, Hecla 182, Columbia 161, and Frederick 160. For a current estimate or a specific statistical year, use the U.S. Census Bureau. The map itself is best for understanding the ranking and geographic separation of the highlighted places.
Which image is best for finding the James River and Richmond Lake?
The terrain-and-water image is the clearest choice because it emphasizes the James River, Elm River, Maple River, Richmond Lake, Mud Lake Reservoir, Columbia Road Reservoir, and smaller named creeks. If you also need Aberdeen, Groton, or highway numbers, compare it with the general county map. The water image is not a flood-hazard or legal shoreline map.
Can the 386–464 m elevation range be used as a survey value for a property?
No. The elevation view summarizes county-wide relief and is intended to show the broad difference between the higher western side and the lower central and eastern drainage areas. It does not provide a surveyed elevation for a specific parcel or structure. Engineering, grading, and drainage work should use current USGS source data or professional survey measurements.
Map File Information
The ZIP contains high-resolution JPG versions of the Brown County general map, city distribution, terrain and water, and elevation views.
- Included Files: Use only the versions confirmed in the article and supplied images
- File Type: Use the confirmed download contents
- Intended Use: Printing, education, presentations, and map-based projects
Related Maps
Sources and references
- Brown County, South Dakota – official website
- U.S. Census Bureau QuickFacts – Brown County
- U.S. Census Bureau TIGER/Line Shapefiles
- USGS National Hydrography
- USGS 3D Elevation Program
Green Map creates custom-edited map images using open geographic data sources such as geoBoundaries, Natural Earth, OpenStreetMap, and government open data.
These maps are edited visual materials, not raw data files, and are provided for education, documents, presentations, and graphic reference.