Permanent cropland occupies a tiny share of total land in many countries, but it accounts for a strikingly large share in several island economies and tropical producers. Among the 200 countries and economies with a 2023 World Bank observation, the median is 1.61%. Tuvalu reaches 60.0%, São Tomé and Príncipe and Kiribati are close to 39.5%, while Botswana, Mongolia, Sweden, and Norway are near 0.01%. A country map and a ranked table reveal that spread much more clearly than a single global average.
The indicator is Permanent cropland (% of land area), World Bank WDI code AG.LND.CROP.ZS. It covers land planted with crops that remain for long periods and do not need to be replanted after every harvest. Examples in the official definition include cocoa, coffee, rubber, fruit and nut trees, vines, and flowering shrubs. Trees grown for wood or timber and permanent meadows or pastures are excluded. The denominator is total land area, not agricultural land alone.
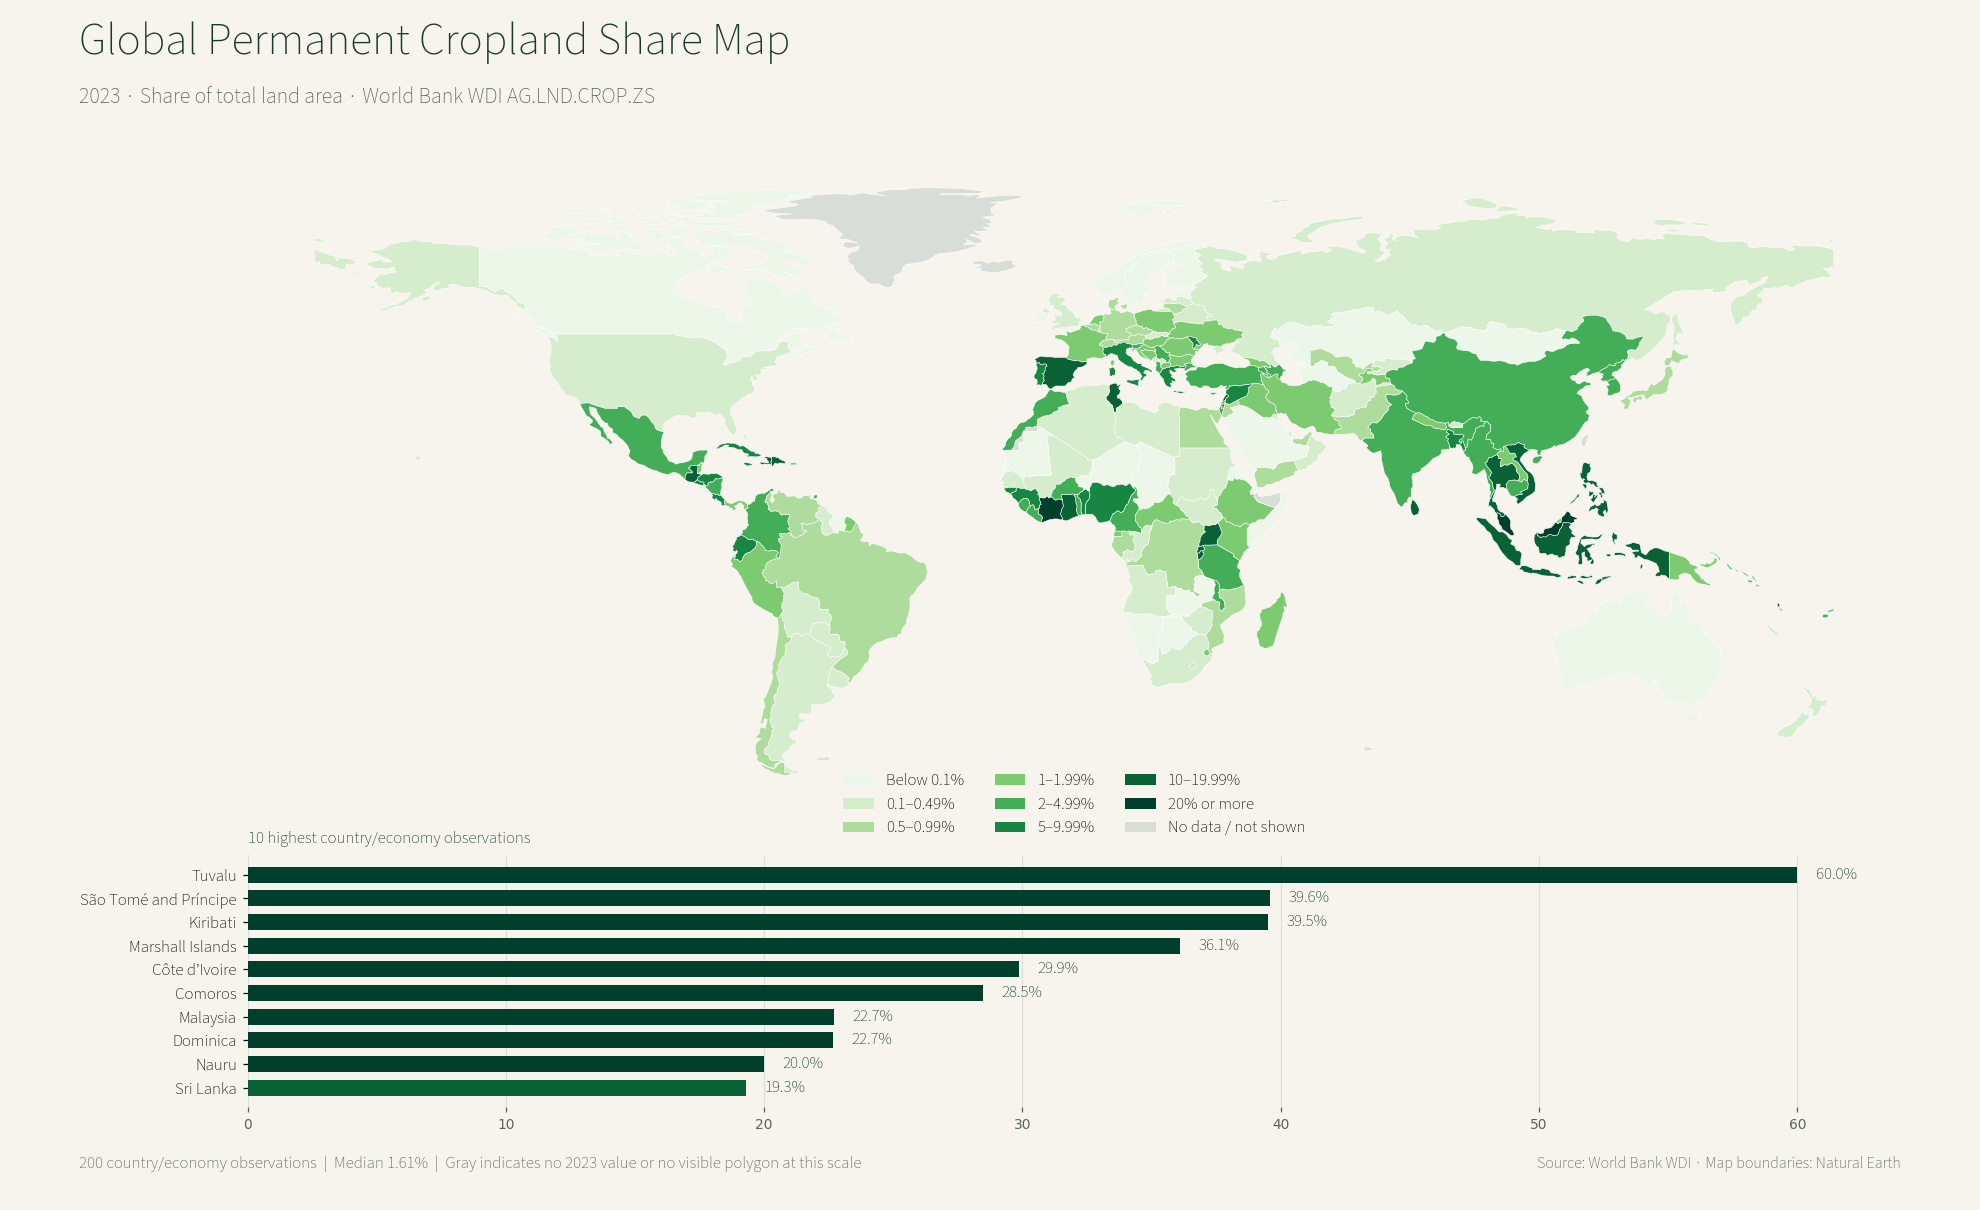
Table of Contents
What stands out in the 2023 distribution
High shares do not belong to one continent. Côte d’Ivoire is at 29.86%, Comoros at 28.48%, Malaysia at 22.71%, Sri Lanka at 19.32%, the Philippines at 18.89%, Viet Nam at 15.70%, and Indonesia at 13.92%. Spain, at 10.23%, is also substantially above most European countries. These values identify where long-lived crop land occupies a large share of national land, but they do not identify the crop mix or measure output.
Small island economies require special care. In Tuvalu, Kiribati, and the Marshall Islands, a limited absolute area of permanent crops can still form a large percentage of a small land base. A 60% share therefore does not mean that Tuvalu has the world’s largest permanent-crop area or agricultural output. An absolute-area comparison would need hectares or square kilometres, and a production comparison would need crop-specific tonnage or value data.
Countries and economies with the highest shares
| Country or economy | Share of total land area |
|---|---|
| Tuvalu | 60.0% |
| São Tomé and Príncipe | 39.6% |
| Kiribati | 39.5% |
| Marshall Islands | 36.1% |
| Côte d’Ivoire | 29.9% |
| Comoros | 28.5% |
| Malaysia | 22.7% |
| Dominica | 22.7% |
| Nauru | 20.0% |
| Sri Lanka | 19.3% |
Six of the top ten observations are island countries or economies: Tuvalu, São Tomé and Príncipe, Kiribati, the Marshall Islands, Comoros, and Nauru. Côte d’Ivoire and Malaysia are much larger land areas yet remain above 20%. The shared high-percentage label should not hide these differences in scale, crop composition, or agricultural systems.
Thirty-one observations are at or above 10%, and 53 are at or above 5%. At the other end, 82 of the 200 observations are below 1%. The simple, unweighted mean is 4.58%, far above the median of 1.61%, because a relatively small group of very high values stretches the distribution upward. The median and threshold counts are therefore more informative than the mean alone when describing a typical country observation.
How selected large countries and economies compare
| Country | 2023 share |
|---|---|
| Indonesia | 13.92% |
| Viet Nam | 15.70% |
| Thailand | 11.24% |
| Spain | 10.23% |
| Nigeria | 8.07% |
| Bangladesh | 7.07% |
| India | 4.86% |
| Mexico | 2.27% |
| South Korea | 2.10% |
| China | 2.04% |
| France | 1.91% |
| Brazil | 0.93% |
| United States | 0.35% |
| Japan | 0.70% |
| Germany | 0.57% |
| Canada | 0.02% |
| Australia | 0.05% |
Southeast and South Asia show a wide range. Viet Nam is at 15.70%, Indonesia 13.92%, and Thailand 11.24%, compared with China at 2.04%, South Korea at 2.10%, and Japan at 0.70%. India records 4.86% and Bangladesh 7.07%. In Europe, Spain is at 10.23% and Italy at 8.11%, while France is at 1.91% and Germany at 0.57%.
Very large countries can have a low percentage even when their absolute permanent-crop area matters. The United States is at 0.35%, Brazil 0.93%, Canada 0.02%, and Australia 0.05%. Because total land area is the denominator, extensive forests, grasslands, deserts, mountains, or tundra can reduce the national share. The percentage should not be read as a direct ranking of agricultural importance.
Permanent cropland is not the same as arable land
Permanent crops are one part of cropland, but they are not interchangeable with arable land. Land used for temporary crops such as wheat or maize, which normally require sowing again after harvest, is generally recorded as arable land. Coffee, rubber, orchards, nut trees, and vines remain productive for multiple years and fall under permanent crops. Permanent meadows and pastures form another category. Agricultural land share, arable land share, and permanent cropland share answer different questions.
A high value is not automatically evidence of higher agricultural income, food security, productivity, or environmental performance. The series does not measure farm employment, exports, yields, household income, forest conversion, biodiversity, or water use. It is most useful as a land-use screening indicator: it shows where long-lived crops occupy an unusually visible portion of the national land base and where a closer crop-specific study may be worthwhile.
Why island economies can disappear from the map
Several of the highest observations belong to very small islands, yet those places may be invisible on a low-resolution world map. A statistical row can be valid even when the boundary layer does not contain a sufficiently large independent polygon. For that reason, the ranking table is not merely a repetition of the map. It preserves information about economies that cannot be represented clearly at this scale.
The World Bank country/economy list also contains separately reported territories and economies, not sovereign states only. The cleaned comparison contains 217 non-aggregate country/economy rows. Two hundred have a 2023 value and 17 remain missing. Older observations are not substituted for those gaps, because mixing years would weaken a same-year cross-country comparison.
What the indicator cannot prove
The map cannot show which permanent crop dominates in each country. Cocoa, coffee, rubber, orchards, vines, and other long-lived crops share the same statistical category, while the supplied observation has no crop-level breakdown. It also cannot establish why one region has a higher share. Climate, terrain, soils, market access, prices, irrigation, and policy may matter, but causal claims would require additional official datasets aligned by geography and time.
It also does not rank production. A small economy can lead the percentage table because the denominator is small, while a large country with a lower percentage may contain a much larger number of hectares. The map answers one precise question: where does permanent cropland account for a large share of total land? Absolute area, output, yield, and export value must be assessed separately.
Data source and map method
Values come from the World Bank World Development Indicators series Permanent cropland (% of land area). The indicator code is AG.LND.CROP.ZS, the unit is percent of total land area, and all retained observations refer to 2023. Regional, income-group, and other aggregate rows are excluded before calculating ranks, counts, the mean, and the median.
The choropleth joins ISO country codes to low-resolution Natural Earth country boundaries. Of the 200 country/economy observations with values, 167 connect directly to visible polygons in this boundary layer. Most unmatched observations are small islands or separately reported economies. They remain in the statistical summaries and rankings even when they cannot be colored on the map. Gray therefore means either no 2023 observation or no visible polygon match at this scale.
Frequently Asked Questions
What is included in permanent cropland?
It includes long-lived crops that do not need replanting after every harvest, such as cocoa, coffee, rubber, fruit and nut trees, vines, and flowering shrubs. Timber trees and permanent pastures are excluded.
Does the highest percentage mean the largest cropped area?
No. The denominator is total land area, so a small island economy can record a high percentage with a limited absolute area. Hectares or square kilometres are needed for an absolute-area ranking.
Are small islands included when they are not visible on the map?
Yes. Economies with a valid 2023 observation remain in the rankings and summary calculations even when the low-resolution boundary layer cannot display them clearly.
Is permanent cropland the same as agricultural land?
No. Agricultural land is a broader category that includes arable land, permanent crops, and permanent meadows or pastures. This map isolates permanent cropland as a share of total land area.
Related Articles
These Green Map articles provide useful same-site comparisons with demographic, economic, and labour-market indicators. They also demonstrate why a country can occupy very different positions across measures that use different denominators and concepts.
- Global Population Growth Map – 2025 Country Comparison
- Global GDP Growth Map – Country Patterns in 2025
- Global Unemployment Rate Map – Country Patterns in 2025
Green Map creates custom-edited map images using open geographic data sources such as geoBoundaries, Natural Earth, OpenStreetMap, and government open data.
These maps are edited visual materials, not raw data files, and are provided for education, documents, presentations, and graphic reference.