The global marine protected area share map compares the portion of territorial waters reported as marine protected areas across countries and economies in 2025. The series is World Bank World Development Indicators ER.MRN.PTMR.ZS, “Marine protected areas (% of territorial waters).” After regional and income-group aggregates are excluded, the master table contains 217 country/economy rows. A numeric 2025 observation is available for 174, while 43 remain missing.
The median reported share is 2.2% and the simple unweighted mean is 10.3%. The first quartile is 0.3% and the third quartile is 12.0%, showing a highly uneven distribution. Those summary statistics give each country or economy equal weight; they are not the percentage of the world ocean that is protected.
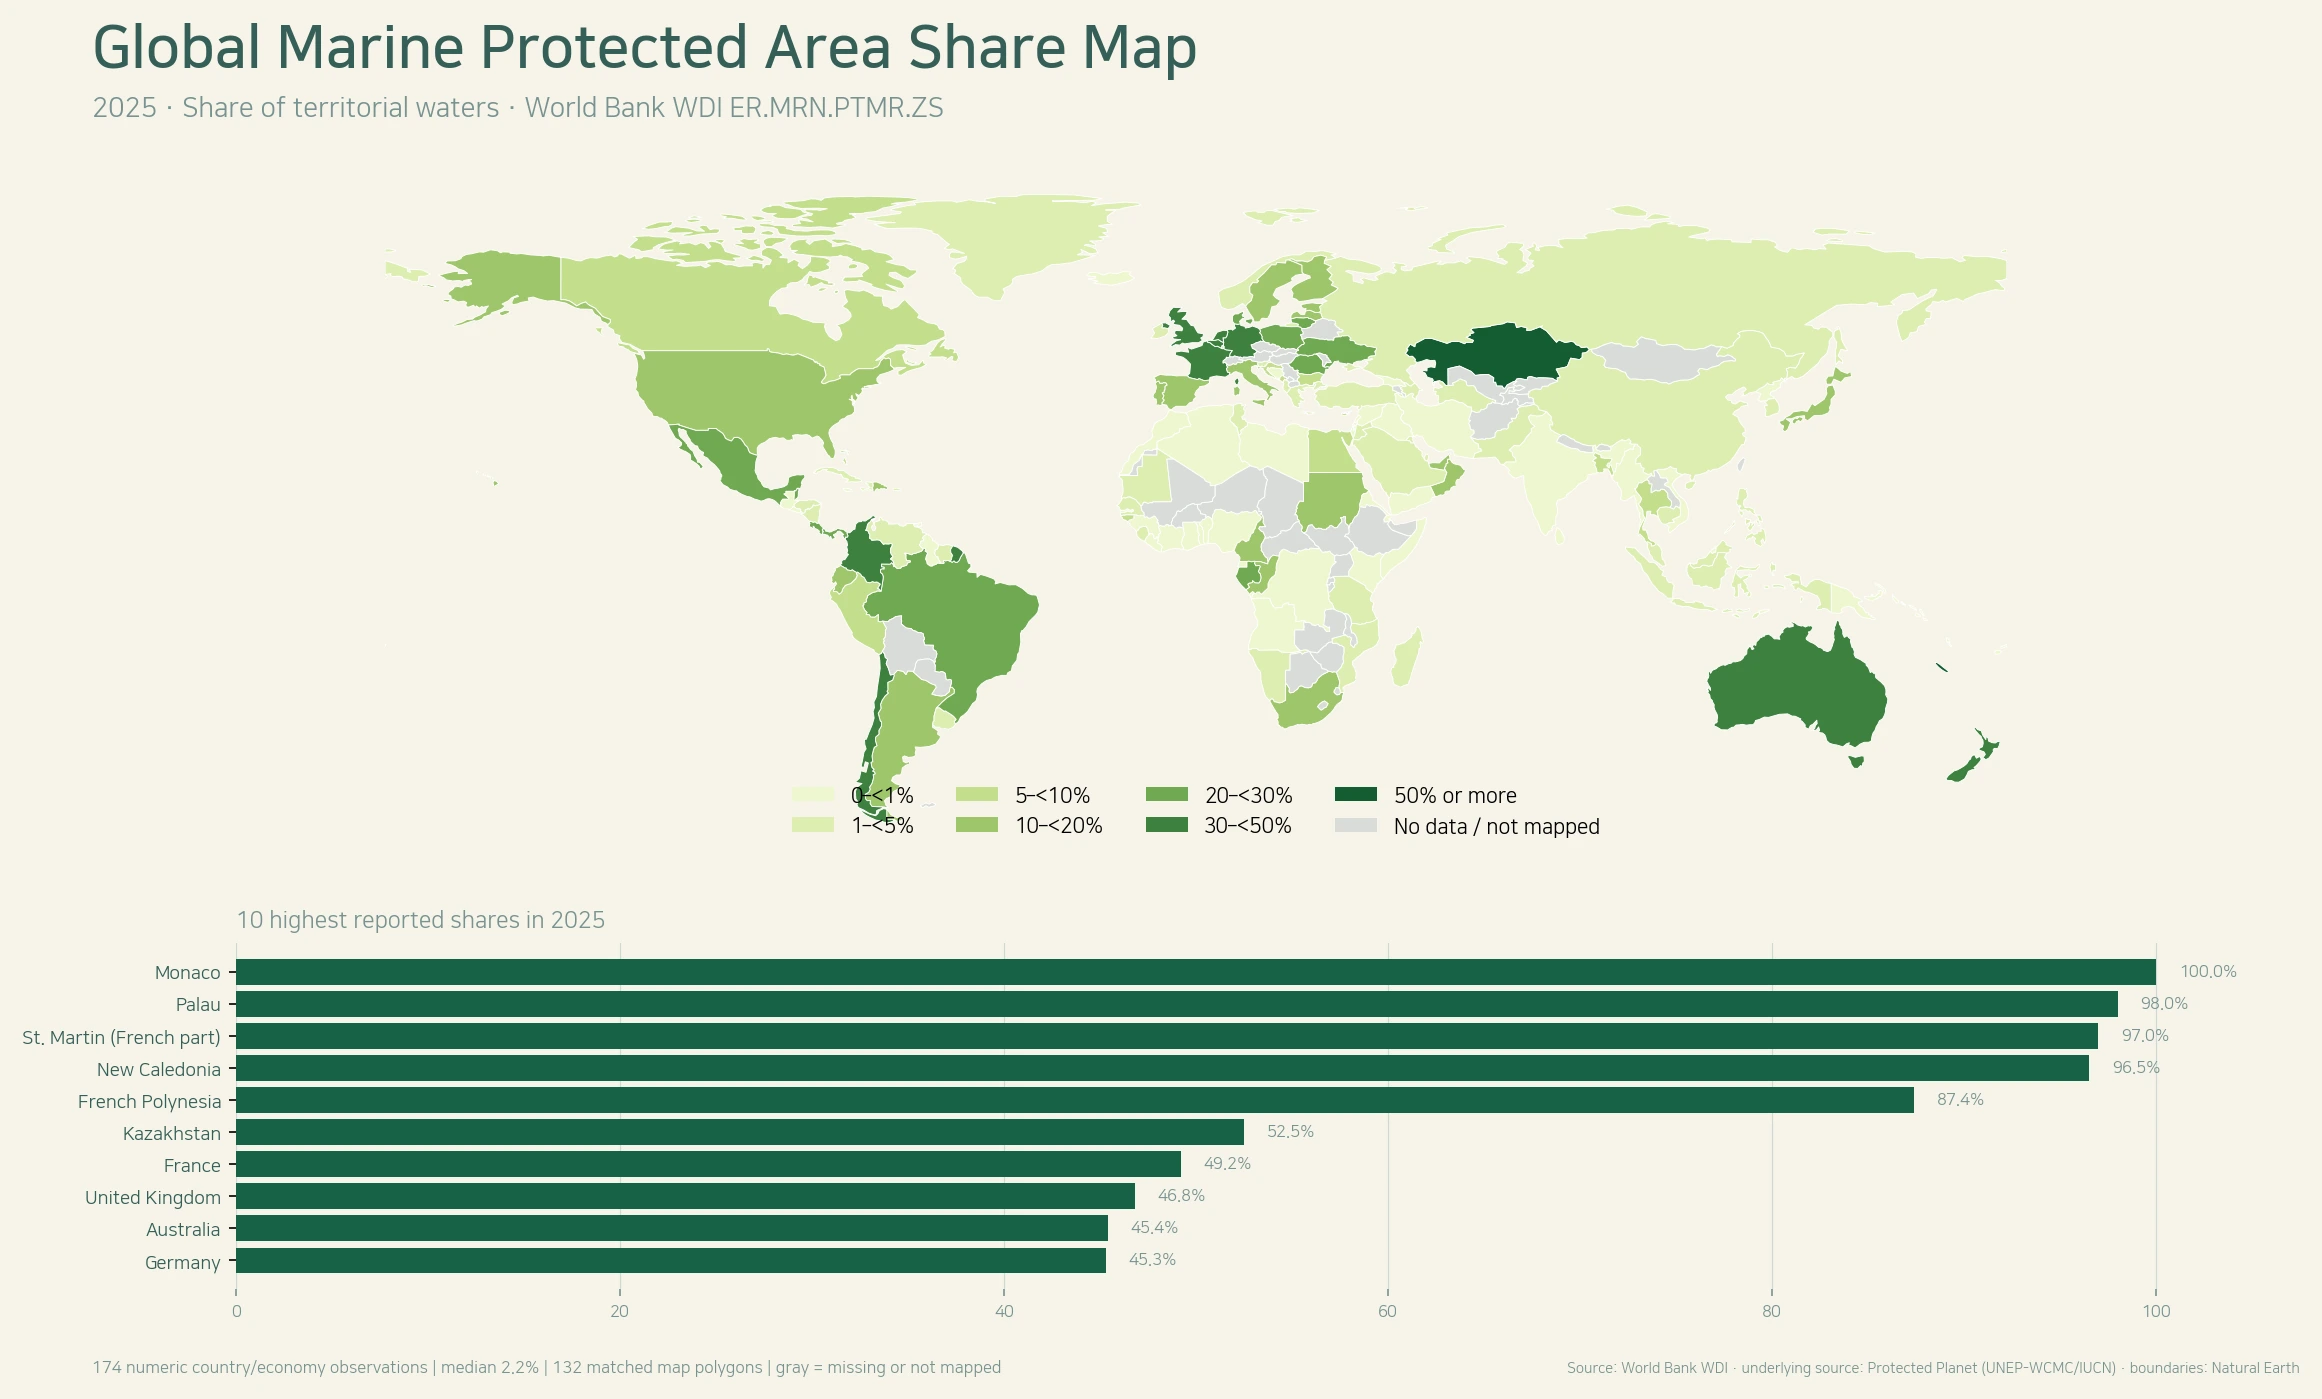
Table of Contents
What this marine protected area indicator measures
The denominator is territorial waters, not land area and not the full exclusive economic zone. World Bank metadata defines marine protected areas as intertidal or subtidal terrain, together with the overlying water and associated natural or cultural features, that has been reserved by law or other effective means to protect some or all of the enclosed environment.
WDI receives the protected-area source data through Protected Planet. The methodology overlays protected-area geography with country and territory boundaries and territorial-water limits to calculate protected coverage. A designation, however, does not automatically demonstrate that protection is effectively enforced or that ecological outcomes are strong.
Most reported values sit near the low end
The shape of the distribution is striking. 72 of the 174 reported observations are below 1%, and another 38 fall between 1% and 5%. Together, 110 observations—63.2% of the numeric set—are below 5%. Only 17 are at 30% or more. That gap between a 2.15% median and a mean above 10% is produced by a small upper tail of very high shares.
| Marine protected area share, 2025 | Countries/economies | Share of 174 reported |
|---|---|---|
| 0–<1% | 72 | 41.4% |
| 1–<5% | 38 | 21.8% |
| 5–<10% | 14 | 8.0% |
| 10–<20% | 21 | 12.1% |
| 20–<30% | 12 | 6.9% |
| 30–<50% | 11 | 6.3% |
| 50%+ | 6 | 3.4% |
Broad bands are more useful than treating tiny differences as meaningful rankings. A country at 0.9% and one at 1.1% can fall into different map colors without representing a sharp change in management quality. The map is best used to locate large differences in designated coverage and then follow up with country-level protected-area and management information.
Six observations are at or above 50%
Monaco is reported at 100.0%, followed by Palau at 98.0%, the French part of St. Martin at 97.0%, New Caledonia at 96.5%, French Polynesia at 87.4%, and Kazakhstan at 52.5%. France is at 49.2%, the United Kingdom at 46.8%, Australia at 45.4%, and Germany at 45.3%, completing the ten highest observations in the supplied 2025 table.
| Country/economy | Marine protected area share |
|---|---|
| Monaco | 100.0% |
| Palau | 98.0% |
| St. Martin (French part) | 97.0% |
| New Caledonia | 96.5% |
| French Polynesia | 87.4% |
| Kazakhstan | 52.5% |
| France | 49.2% |
| United Kingdom | 46.8% |
| Australia | 45.4% |
| Germany | 45.3% |
These percentages are not rankings of absolute protected marine area. A small territory can protect a large fraction of a relatively small territorial-water base, while a country with much larger waters can protect a substantial number of square kilometers and still have a lower percentage. Share and total protected area answer different questions.
Selected large economies span a wide range
Among familiar economies, France, the United Kingdom, Australia and Germany are all above 45% in this indicator. Brazil is at 26.6%, Mexico 22.6%, the United States and Spain 19.0%, Japan 13.8%, Argentina 12.0%, and Italy 11.0%. Canada is at 9.2%, China 4.8%, Indonesia 3.0%, South Korea 2.3%, Norway 1.0%, India 0.3%, and South Africa 15.4%.
| Country | 2025 marine protected area share |
|---|---|
| France | 49.2% |
| United Kingdom | 46.8% |
| Australia | 45.4% |
| Germany | 45.3% |
| Chile | 41.2% |
| Colombia | 41.1% |
| New Zealand | 30.4% |
| Brazil | 26.6% |
| Mexico | 22.6% |
| Spain | 19.0% |
| United States | 19.0% |
| South Africa | 15.4% |
| Japan | 13.8% |
| Argentina | 12.0% |
| Italy | 11.0% |
| Canada | 9.2% |
| China | 4.8% |
| Indonesia | 3.0% |
| Korea, Rep. | 2.3% |
| Norway | 1.0% |
| India | 0.3% |
None of these percentages is a single score for marine policy. Territorial-water size, coastline configuration, designation rules, reporting schedules, mapping precision and the treatment of small protected areas can differ. The indicator also does not directly measure fishing pressure, pollution, habitat condition, enforcement, financing or management effectiveness.
Zero and missing are not interchangeable
The source table contains 25 numeric observations reported as exactly 0.0%, while 43 rows have no 2025 value. Missing entries are preserved as NA in this analysis and are not replaced with an older year or with zero. A gray area on the map therefore must not be interpreted as an absence of marine protection.
Some missing observations can be associated with places for which a territorial-water measure is not applicable, while others may reflect reporting or coverage differences. Even a numeric 0.0% should be treated as the value of this specific statistical series rather than a claim that every form of marine conservation is absent.
Designation does not equal management effectiveness
The World Bank methodology explicitly cautions that designation as a protected area does not show how well the site is managed or whether protection measures are effectively enforced. Staffing, budgets, illegal extraction, ecological connectivity, governance, local rights and biodiversity outcomes require separate evidence. This map measures the spatial share of designated protection in territorial waters.
Cross-country comparability also has limits. Protected Planet data depend on national and territorial submissions and verification, and countries update their information at different frequencies and levels of spatial detail. For a current country-specific assessment, the latest Protected Planet record and national marine-protection sources should be consulted alongside the WDI series.
Data and mapping method
This article uses only the 2025 observations in World Bank WDI series ER.MRN.PTMR.ZS. Of 217 country/economy master rows, 174 numeric values are used for the distribution, rankings and summary statistics and 43 missing values remain NA. Regional and income-group aggregates were excluded upstream. No interpolation, backfilling or estimated values were added.
The official series and methodology can be checked on the World Bank indicator page and the WDI metadata glossary. The underlying protected-area source is available through Protected Planet’s marine protected and conserved areas page. The map in this article joins the verified 2025 values to low-resolution Natural Earth country boundaries, so very small islands and separately reported territories can be present in the statistics without appearing as individual map polygons.
Frequently Asked Questions
Does this indicator cover the entire exclusive economic zone (EEZ)?
No. ER.MRN.PTMR.ZS is expressed as a percentage of territorial waters. It should not be read as the protected share of a country’s full EEZ.
Does 100% mean all activity is prohibited in a country’s territorial waters?
No. A 100% value means the reported protected-area coverage reaches the full territorial-water denominator used by the indicator. Protected areas can have different rules, permitted uses and levels of enforcement.
Do gray areas on the map mean zero marine protection?
No. Gray can indicate a missing 2025 observation or a country/economy that is not represented as a separate polygon at this map resolution. Missing values were not converted to zero.
Does a higher percentage always mean a larger protected marine area in square kilometers?
No. The denominator is each country or economy’s territorial-water area. Absolute protected area can rank very differently because territorial waters vary greatly in size.
Related Articles
For other country-level indicators mapped with a fixed comparison year, see these Green Map articles.
- Global Forest Area Share Map – 2023 Country Comparison
- Global Internet Use Map – 2024 Country Comparison
- Global Population Growth Map – 2025 Country Comparison
Green Map creates custom-edited map images using open geographic data sources such as geoBoundaries, Natural Earth, OpenStreetMap, and government open data. These maps are edited visual materials, not raw data files, and are provided for education, documents, presentations, and graphic reference.