EIA annual operating data for 2024 show a wide spread in utility-scale net electricity generation across the states when the series is fixed to all fuels and Electric Power Sector Non-CHP. The dataset contains 51 observed jurisdictions—the 50 states plus the District of Columbia—with no missing values. Their simple sum is 4,020,014.12 thousand MWh. Texas is the largest observation at 477,417.05 thousand MWh, followed by Florida at 259,942.59, Pennsylvania at 227,950.44, California at 190,261.03, and Illinois at 181,979.70.
The metric identity matters. The EIA field is generation, the fuel facet is ALL, the sector facet is 90, the frequency is annual, and the unit is thousand megawatthours. This is therefore a net-generation comparison, not a capacity table, a fuel-input series, or a retail-sales measure. States can rank differently on those other indicators because installed capacity, utilization, plant efficiency, imports and exports, and the generation mix are not interchangeable.
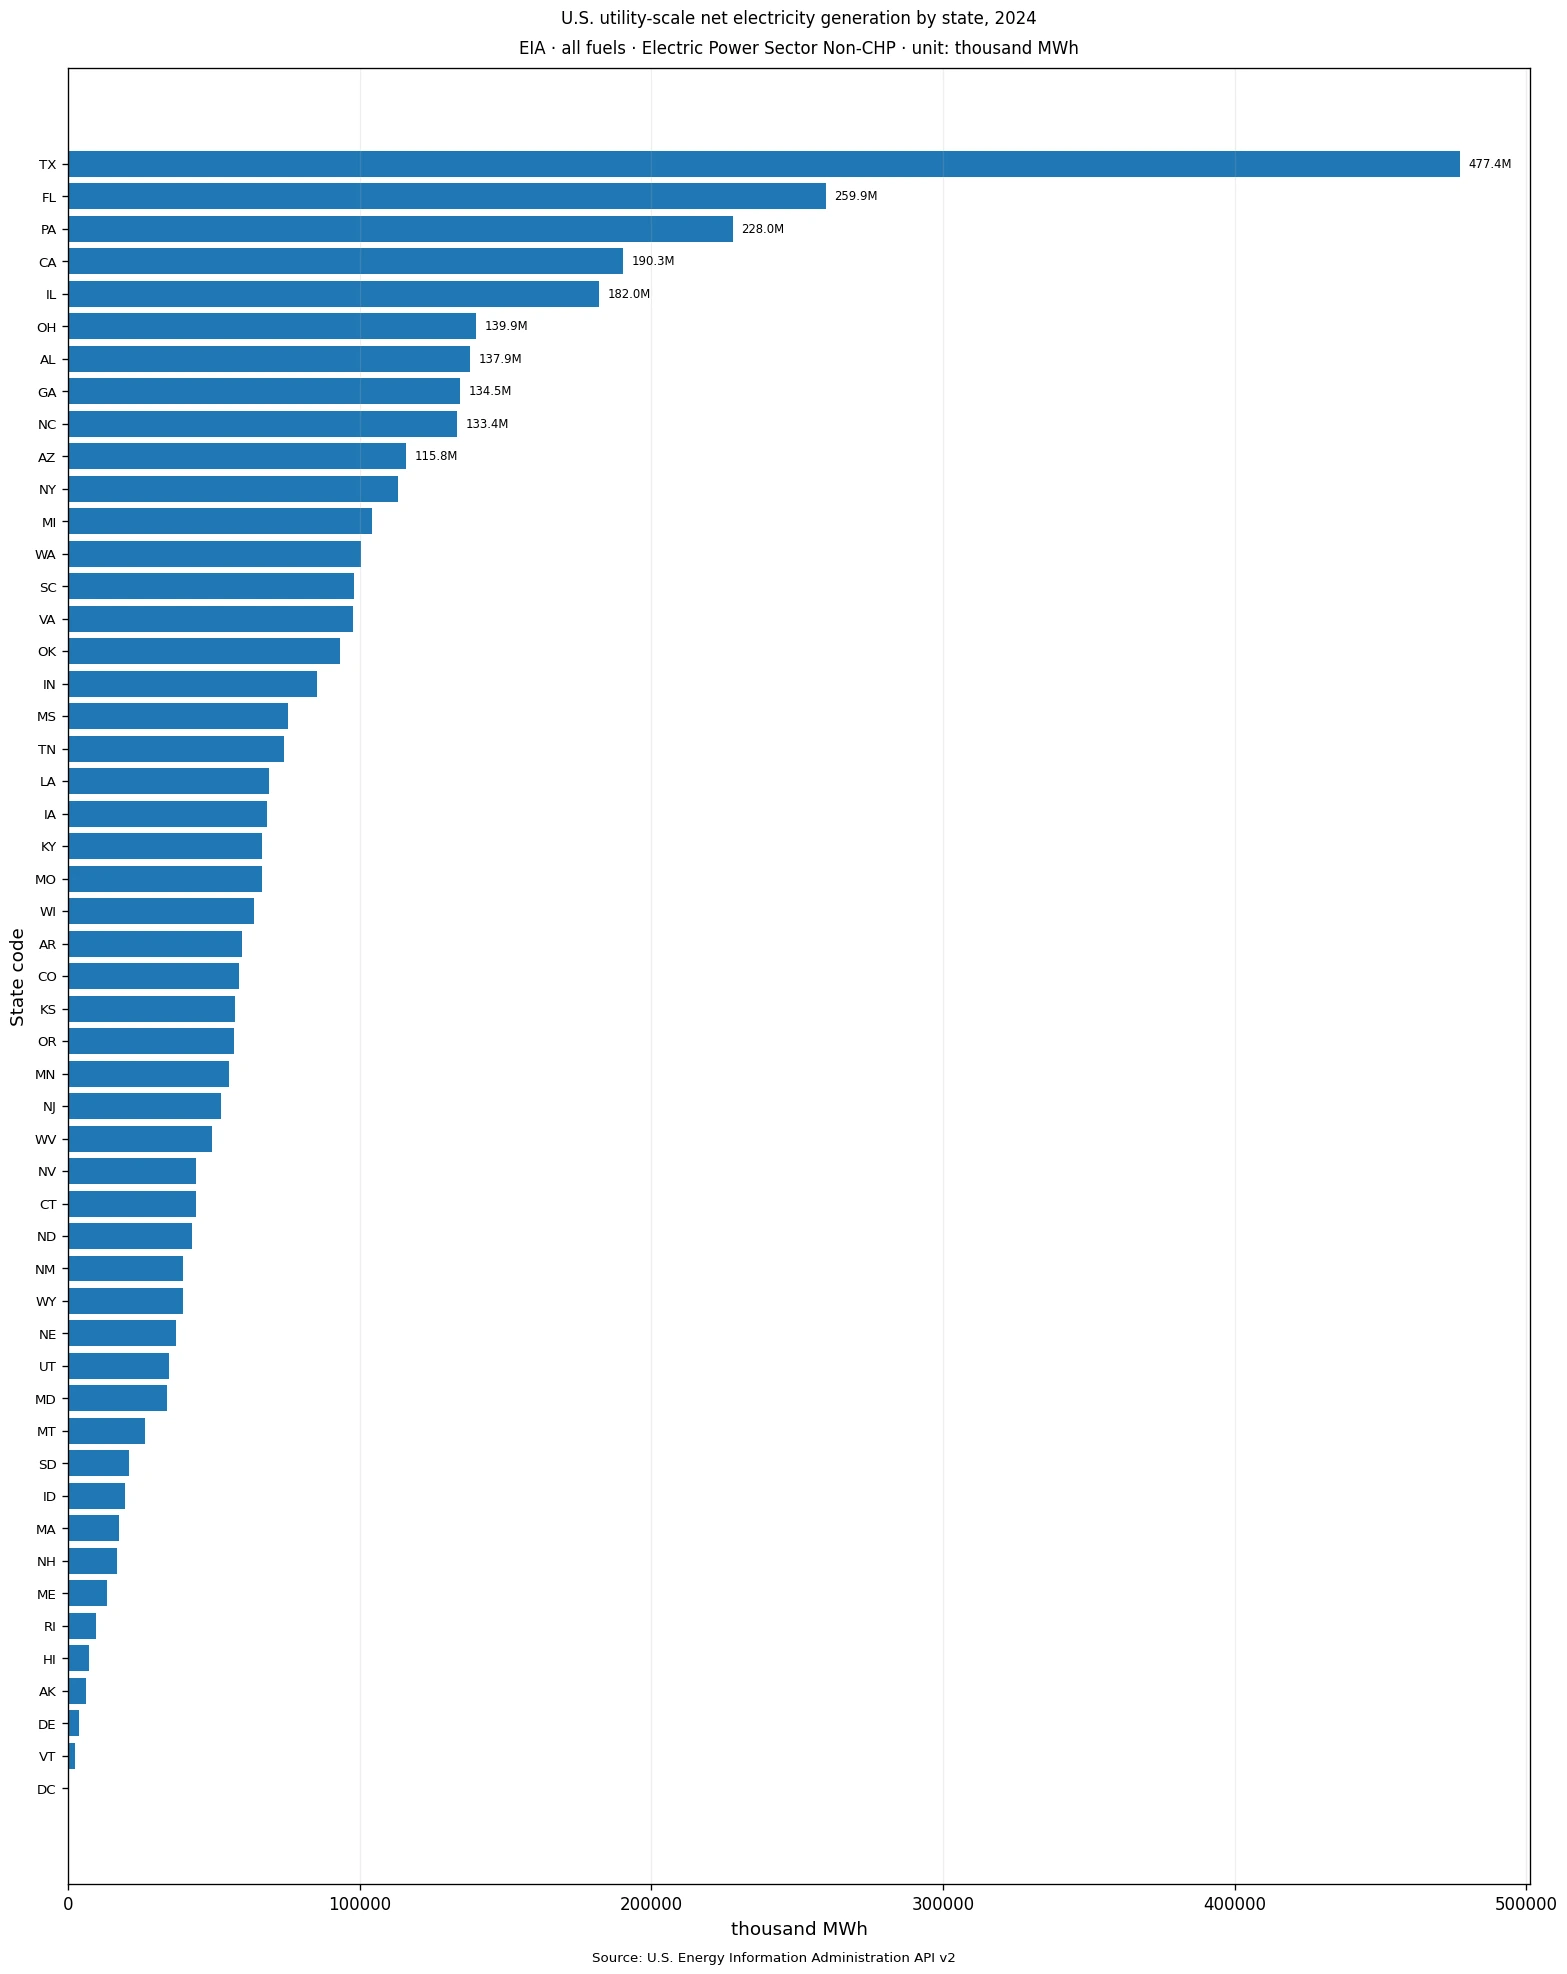
Table of Contents
Texas supplied the largest single state observation, but not a majority of the total
Texas accounts for 11.88% of the simple sum of the 51 observations. Florida contributes 6.47% and Pennsylvania 5.67%. The top three reach 24.01%, the top five 33.27%, and the top ten 49.73%. That pattern shows meaningful concentration at the upper end without reducing the national picture to one state. More than half of the summed value still lies outside the top ten, so the middle of the distribution remains important.
These shares use the sum of this exact 51-row state dataset as the denominator. They are descriptive shares for this slice, not a substitute for every possible EIA national total and not a statement about a state’s generation mix. Texas at 11.88% does not mean 11.88% of Texas electricity came from a particular fuel, because fueltypeid=ALL combines the fuel categories included in the source. The calculation only places each jurisdiction within a consistent state comparison.
Florida and Pennsylvania form a second tier below Texas
Florida is second at 259,942.59 thousand MWh and Pennsylvania is third at 227,950.44. California and Illinois complete the top five. Ohio, Alabama, Georgia, North Carolina, and Arizona fill out the top ten. The leaders span the South, Northeast, Midwest, and West, so the largest values are not confined to one geographic region. Large power systems in several parts of the country contribute to the upper tail.
A high net-generation value should not be attributed to a single cause from this dataset alone. State population can matter through electricity demand, but generation also depends on the size and type of the generating fleet, capacity factors, interstate electricity flows, fuel availability, outages, and market structure. The verified file supplies a comparable generation measure; it does not provide enough variables to isolate causal explanations.
| Rank | State / area | Code | 2024 value (thousand MWh) | Share of 51-value sum |
|---|---|---|---|---|
| 1 | Texas | TX | 477,417.05 | 11.88% |
| 2 | Florida | FL | 259,942.59 | 6.47% |
| 3 | Pennsylvania | PA | 227,950.44 | 5.67% |
| 4 | California | CA | 190,261.03 | 4.73% |
| 5 | Illinois | IL | 181,979.70 | 4.53% |
| 6 | Ohio | OH | 139,858.77 | 3.48% |
| 7 | Alabama | AL | 137,895.89 | 3.43% |
| 8 | Georgia | GA | 134,490.29 | 3.35% |
| 9 | North Carolina | NC | 133,365.67 | 3.32% |
| 10 | Arizona | AZ | 115,805.97 | 2.88% |
The median is 58,469.58 thousand MWh, well below the mean
The median observation is 58,469.58 thousand MWh while the arithmetic mean is 78,823.81. The gap of more than 20,000 thousand MWh reflects the influence of the largest states on the average. The first quartile is 34,138.00 and the third quartile is 99,335.07, placing the middle half of the distribution between roughly 34 and 99 million MWh. Those quartiles provide a better sense of the central range than the mean alone.
Only three jurisdictions exceed 200,000 thousand MWh: Texas, Florida, and Pennsylvania. Thirteen are at or above 100,000, and 30 are at or above 50,000. Six are below 10,000. The distribution therefore has a pronounced upper tail, but it also contains a substantial middle group rather than a simple split between a few huge generators and many near-zero states.
The South contains several of the largest state power systems in this slice
Texas and Florida occupy the first two positions, while Alabama, Georgia, and North Carolina are also in the top ten. South Carolina records 98,124.27 thousand MWh and Virginia 97,571.97, both close to the third quartile. Louisiana and Tennessee sit further inside the middle range. The regional pattern is notable because multiple southern states—not Texas alone—contribute large absolute volumes.
All-fuels generation does not reveal which technologies are responsible for those totals. Natural gas, coal, nuclear, hydro, wind, solar, and other sources can contribute in very different proportions from one state to another. To explain the regional contrast, an analyst would need to hold year, field, sector, and geography constant while splitting the fuel facet or joining generation with capacity and operating data.
Midwestern and Northeastern states show a broad range as well
Illinois reaches 181,979.70 thousand MWh, Ohio 139,858.77, and Michigan 104,315.43. Other Midwestern states occupy the middle of the ranking. In the Northeast, Pennsylvania is exceptionally large, New York records 113,007.58, and several New England states are much smaller in absolute terms. Geographic proximity does not imply similar generation scale because state grids and generating fleets differ sharply.
Absolute output is also not an efficiency score. A state with high generation can operate a large fleet and export electricity, while a state with low in-state generation can consume substantial electricity produced elsewhere. Comparing generation per person, generation per dollar of GDP, emissions per MWh, or capacity utilization would require different denominators and additional datasets. This series should remain an absolute net-generation measure.
California, Washington, and Arizona stand out in the West
California ranks fourth at 190,261.03 thousand MWh. Arizona is tenth at 115,805.97, and Washington reaches 100,545.86. Other western states spread across the middle and lower ranges. The contrast shows why “the West” should not be treated as a single operating pattern: hydro resources, thermal plants, renewable fleets, state demand, and electricity trading differ materially across the region.
The all-fuels total also prevents a direct inference about renewable performance. Washington may be associated with hydropower and California with a diverse renewable fleet, but this particular series combines the fuels represented by the ALL facet. Fuel-specific conclusions require fuel-specific rows. The safe statement here is about total net generation under one EIA sector definition, not the contribution of any individual technology.
Very small observations are real values, not missing-data replacements
The District of Columbia is the minimum at 31.65 thousand MWh. Vermont follows at 2,256.55, Delaware at 3,518.78, Alaska at 6,081.45, Hawaii at 7,197.39, and Rhode Island at 9,589.13. Every one of the 51 rows has an observed value, and none is zero. Treating the lower tail as missing data would distort ranks, totals, shares, and the visual scale.
Low in-state generation does not imply low electricity use or poor system performance. Small jurisdictions can import electricity over the transmission network, and some areas have limited utility-scale generation within their boundaries. Generation describes where electricity is produced and reported; consumption describes where it is used. Interstate flows mean the two concepts should not be substituted for each other.
| Low-rank order | State / area | Code | 2024 value (thousand MWh) | Share of 51-value sum |
|---|---|---|---|---|
| 1 | District of Columbia | DC | 31.65 | 0.00% |
| 2 | Vermont | VT | 2,256.55 | 0.06% |
| 3 | Delaware | DE | 3,518.78 | 0.09% |
| 4 | Alaska | AK | 6,081.45 | 0.15% |
| 5 | Hawaii | HI | 7,197.39 | 0.18% |
| 6 | Rhode Island | RI | 9,589.13 | 0.24% |
| 7 | Maine | ME | 13,102.57 | 0.33% |
| 8 | New Hampshire | NH | 16,859.32 | 0.42% |
| 9 | Massachusetts | MA | 17,429.13 | 0.43% |
| 10 | Idaho | ID | 19,406.15 | 0.48% |
Net generation, capacity, and fuel input answer different questions
Net generation measures electrical energy produced over a period. Generating capacity is a power rating, usually expressed in MW, that describes potential output at a point in time. Fuel input is an energy measure that can be expressed in Btu. A plant fleet with the same capacity can generate very different annual output depending on utilization, and two fleets producing similar electricity can consume different amounts of fuel because technologies and efficiencies differ.
That distinction is important when comparing neighboring EIA topics. A table titled “consumption for electricity generation” can resemble a generation article, but the underlying field and unit are different. The 2024 values here should only be combined or compared directly with series that preserve generation as the field, thousand MWh as the unit, and the same sector and fuel facets.
Sector 90 limits the scope to Electric Power Sector Non-CHP
The source metadata identifies sectorid=90 as Electric Power Sector Non-CHP. The Non-CHP qualifier means this slice is not identical to a broader total that includes combined heat and power operations or other EIA sector categories. Similar-looking state series can therefore produce different totals even when they share the same year and generation field.
For reproducible interpretation, the full identity is more informative than a shortened headline: annual 2024 generation, fueltypeid=ALL, sectorid=90, state geography, unit thousand MWh, route electricity/electric-power-operational-data. Preserving those dimensions helps prevent accidental merging of separate EIA metrics that differ by just one facet.
A single year is a cross-section, not a trend
The verified file contains 2024 only. It can establish the state ranking and distribution for that year, but it cannot show whether Texas increased from 2023, whether California fell, or whether regional concentration is rising over time. Trend statements require multiple annual observations pulled with the same field, fuel, sector, unit, and geography definitions.
Historical EIA observations can also be revised. A robust time-series workflow should preserve the source URL and extraction date, then recalculate summary statistics when the underlying data are updated. The values discussed here belong to the verified 2024 slice and should not be projected into later years without new observations.
The middle of the ranking is essential to understanding concentration
The top ten states account for 49.73% of the 51-value sum and the top fifteen for 62.50%. Those cumulative shares show concentration, but they also show that the distribution is not dominated by a single outlier. Thirty states are at or above 50,000 thousand MWh and thirteen exceed 100,000. A wide band of states therefore makes material contributions to the total represented by the dataset.
Looking only at Texas exaggerates concentration, while looking only at the mean hides the upper tail. A more complete reading uses the maximum, median, quartiles, cumulative top-state shares, and the lower tail together. That combination shows a skewed but broad distribution: several very large systems, a substantial middle group, and a small set of jurisdictions with limited in-state utility-scale generation.
Source and reproducibility
The source is the U.S. Energy Information Administration API v2, electricity/electric-power-operational-data. The slice uses annual frequency, year 2024, data field generation, fueltypeid=ALL, sectorid=90, state geography, and the unit thousand megawatthours. All 51 rows are observed. No missing values were converted to zero, no imputation was used, and no adjacent metric was added to the series.
Under those conditions, the leading values are Texas 477,417.05, Florida 259,942.59, and Pennsylvania 227,950.44 thousand MWh. The simple sum is 4,020,014.12, the median is 58,469.58, and the mean is 78,823.81. The strongest descriptive conclusion is that 2024 utility-scale Non-CHP electric-power generation was broadly distributed across the states while Texas and several other large systems formed a pronounced upper tier.
Frequently Asked Questions
Which state had the largest utility-scale Non-CHP net generation in 2024?
Texas was the largest observation at 477,417.05 thousand MWh, about 11.88% of the simple sum of the 50 states and District of Columbia values.
Is this the same as generating capacity?
No. This EIA series measures net generation in thousand MWh. Generating capacity in MW and fuel input in Btu are different metrics.
Is the District of Columbia value missing or zero-filled?
No. D.C. has an observed value of 31.65 thousand MWh. All 51 rows are observed, with no missing values and no actual zeros.
Related Articles
Green Map creates custom-edited map images using open geographic data sources such as geoBoundaries, Natural Earth, OpenStreetMap, and government open data. These maps are edited visual materials, not raw data files, and are provided for education, documents, presentations, and graphic reference.