Texas recorded the largest amount of fossil-fuel net generation in the U.S. Electric Power sector in 2024 at 319,603.449 thousand MWh. Florida followed with 211,666.364 thousand MWh, Pennsylvania with 153,981.303, and Ohio with 116,412.418. The 50 state observations sum to 2,431,020.251 thousand MWh, with Texas accounting for 13.15% of that total. The series is defined by the U.S. Energy Information Administration with fueltypeid=FOS, sectorid=98, field=generation, annual frequency, and the year 2024. FOS is the aggregate fossil-fuels category. The metric is net electricity generation, so it should not be confused with fuel consumption in Btu, petroleum use in barrels, installed generating capacity in MW, or the percentage of a state power mix supplied by fossil fuels.
Net generation measures electricity output after accounting for the electricity used by generating facilities for their own operations. The unit here is thousand megawatthours, which describes energy produced rather than the amount of fuel burned. A state can generate a large amount of fossil-fuel electricity because its power system is large, because fossil generation occupies a large share of its mix, or both. Those possibilities cannot be separated from this measure alone. The state values are also absolute totals rather than figures normalized by population, electricity demand, or installed capacity. The ranking therefore answers a specific question: which states produced the most net electricity from fossil fuels within the EIA Electric Power sector in 2024?
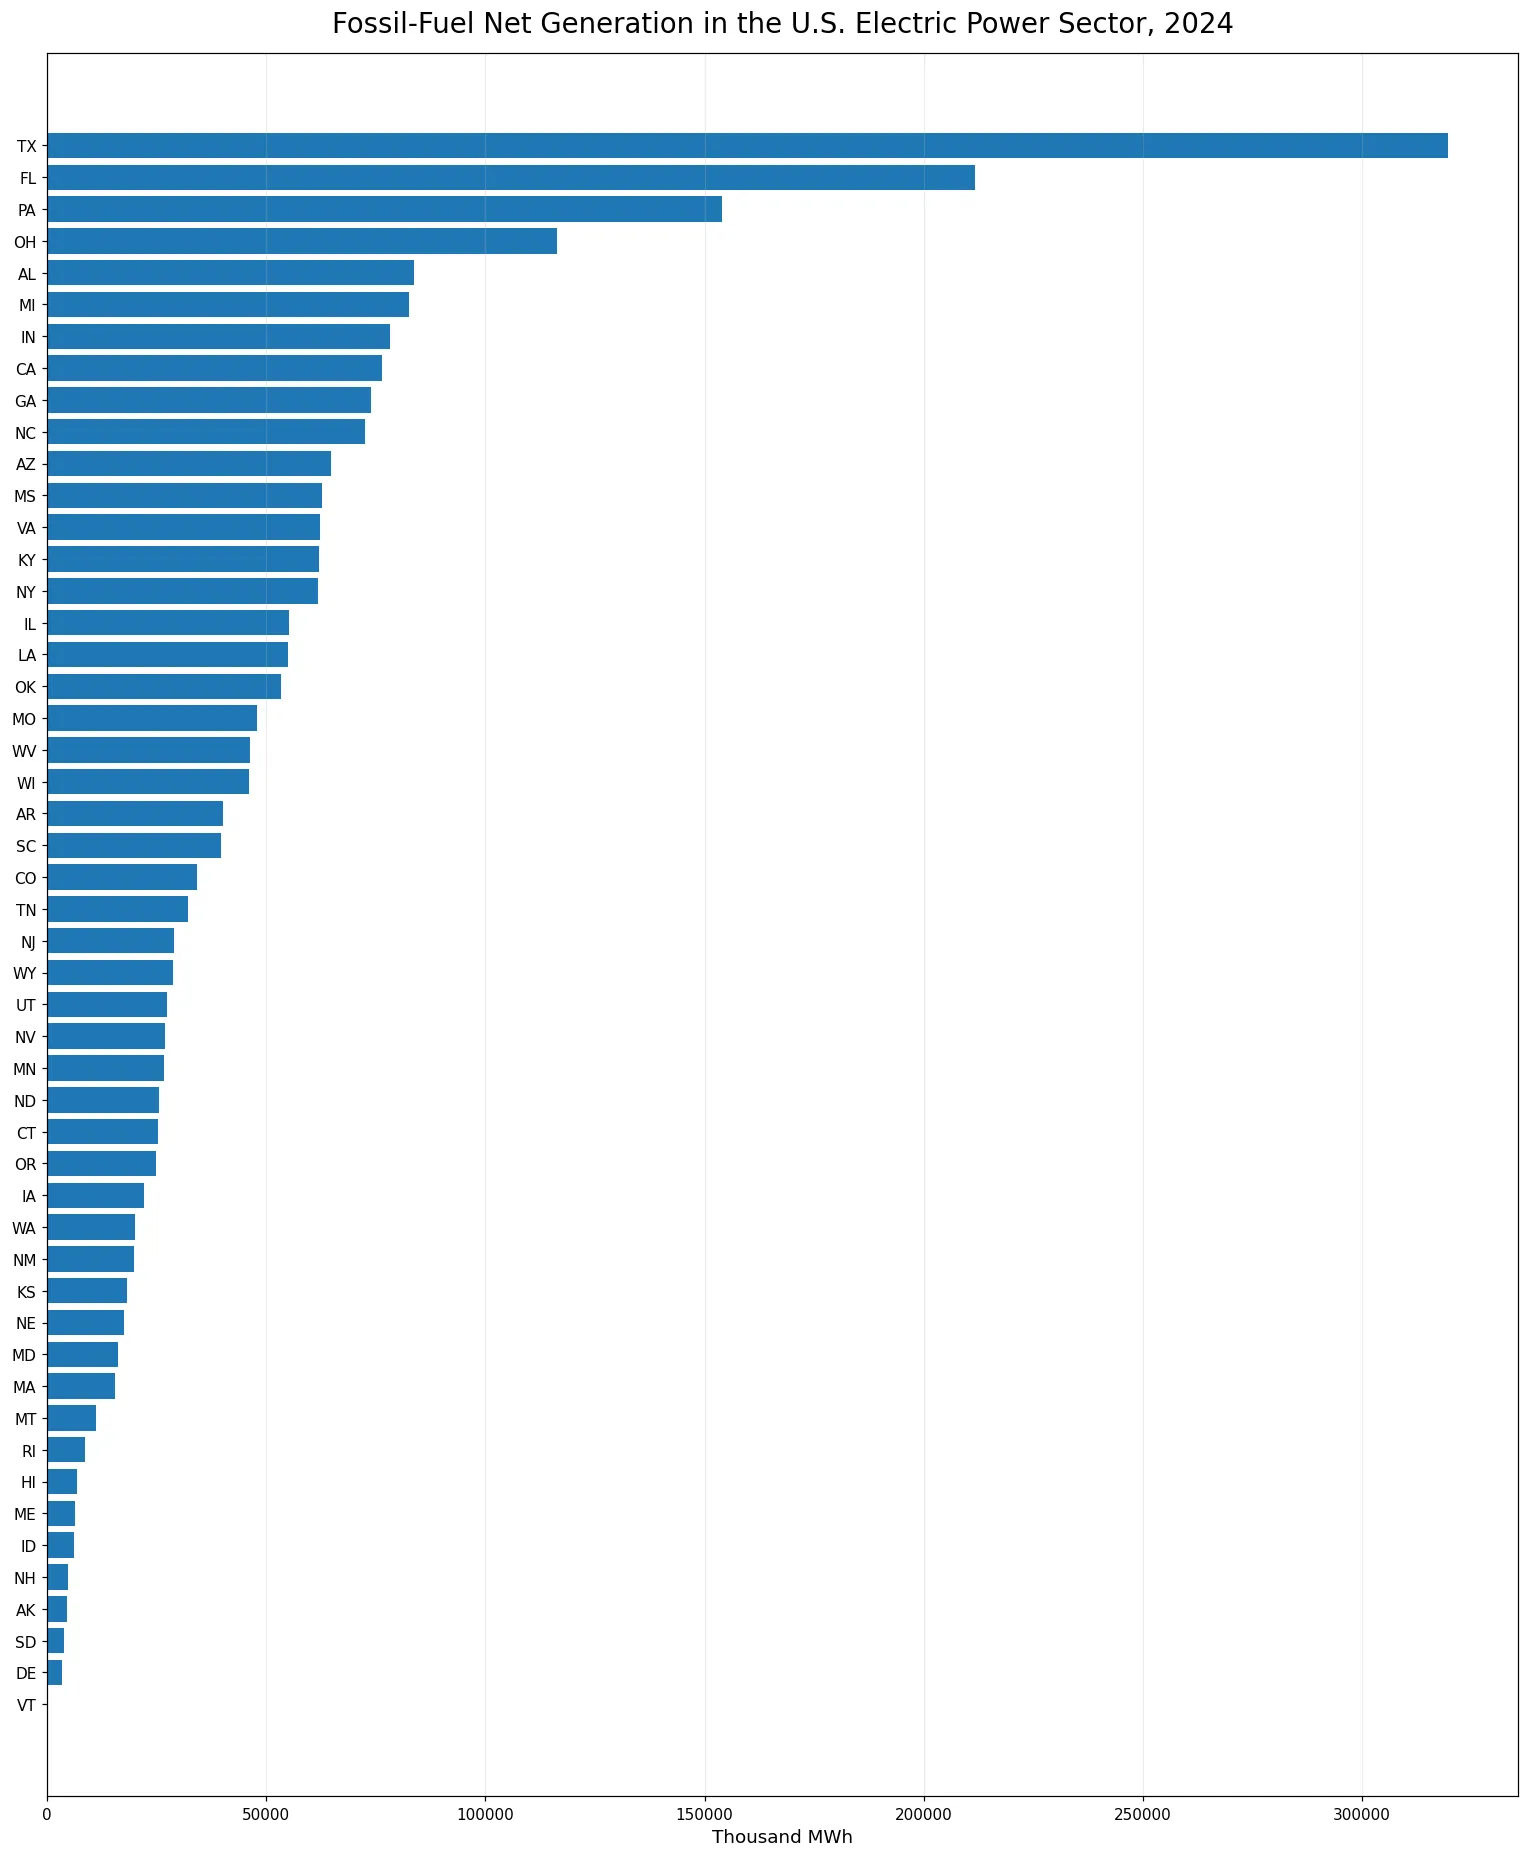
Table of Contents
Texas, Florida, and Pennsylvania form the leading group
Texas represents 13.15% of the 50-state sum, Florida 8.71%, and Pennsylvania 6.33%. Together, the first three states account for 28.19% of the total. The top five account for 36.42% and the top ten for 52.19%. This is a concentrated distribution, but it is not one in which a single state dominates a majority of the total. Texas leads clearly, while Florida and Pennsylvania also contribute large volumes. Ohio, Alabama, Michigan, Indiana, California, Georgia, and North Carolina complete the top ten. The presence of large values in several regions shows that fossil-fuel generation remains geographically broad even though a relatively small group of states produces more than half of the state-level total.
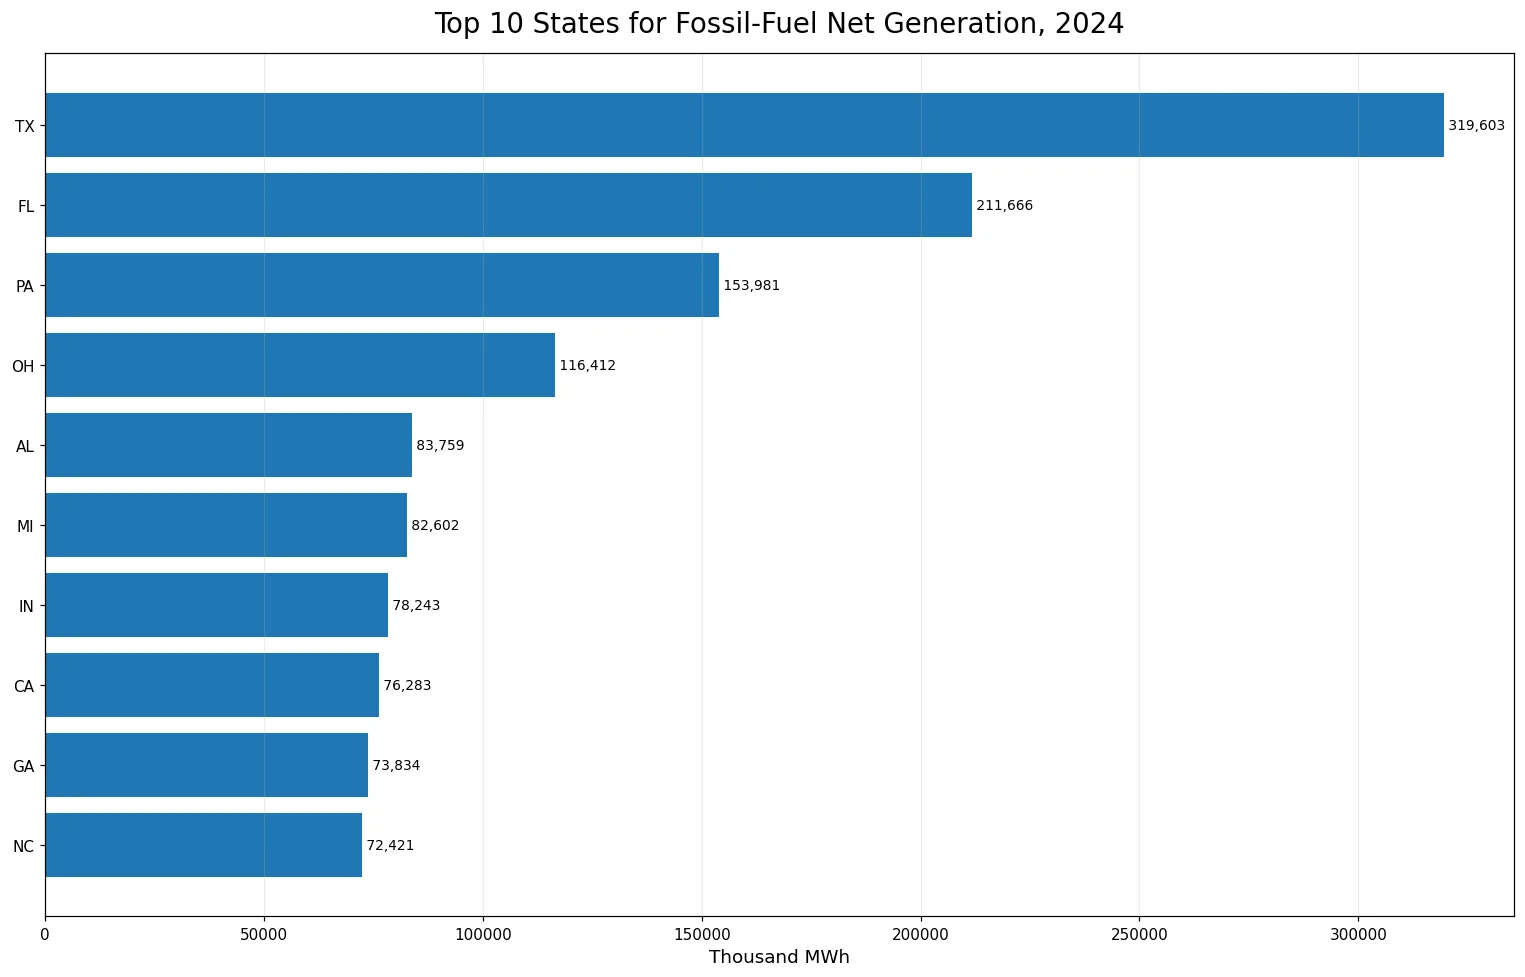
Texas generated about 108 thousand GWh more than Florida
The difference between Texas and Florida is 107,937.085 thousand MWh. Because one thousand MWh equals one GWh, that is also about 107,937 GWh. Texas produced roughly 1.51 times Florida’s fossil-fuel net generation and 2.08 times Pennsylvania’s. Those comparisons describe absolute output, not fossil-fuel dependence. Texas has one of the largest power systems in the country and also produces substantial electricity from non-fossil sources. Florida likewise has a large electricity market. To compare dependence, fossil-fuel generation would need to be divided by total generation from all fuels for each state. Without that denominator, an absolute generation ranking should not be rewritten as a fossil-share ranking.
| State | Fossil-fuel net generation (thousand MWh) | Share of 50-state sum |
|---|---|---|
| Texas | 319,603.449 | 13.15% |
| Florida | 211,666.364 | 8.71% |
| Pennsylvania | 153,981.303 | 6.33% |
| Ohio | 116,412.418 | 4.79% |
| Alabama | 83,759.495 | 3.45% |
| Michigan | 82,601.958 | 3.40% |
| Indiana | 78,242.986 | 3.22% |
| California | 76,282.512 | 3.14% |
| Georgia | 73,834.127 | 3.04% |
| North Carolina | 72,420.956 | 2.98% |
The median state is far below the average
The mean across the 50 states is 48,620.405 thousand MWh, while the median is 30,600.978. The first quartile is 17,619.595 and the third quartile is 62,121.478 thousand MWh. The mean is about 1.59 times the median because high-generation states pull the arithmetic average upward. Half of the states are at or below roughly 30,601 thousand MWh, and the middle half lie between about 17,620 and 62,121 thousand MWh. Texas is roughly 10.4 times the median. Reporting the average without the median would therefore overstate the amount of fossil-fuel generation associated with a middle-ranked state.
All 50 states have positive reported values
The 2024 series contains 0 missing observations and 0 exact zeros. Every state has a positive value. Vermont is the minimum at 3.594 thousand MWh, followed by Delaware at 3,449.026, South Dakota at 3,794.496, Alaska at 4,562.573, and New Hampshire at 4,645.383 thousand MWh. Vermont is an extreme low observation, but it is still an actual published value and should not be treated as zero or no data. Complete 50-state coverage is useful because the ranking does not require filling gaps or mixing observed values with estimates created outside the source series.
| Lowest-value state | Fossil-fuel net generation (thousand MWh) |
|---|---|
| Vermont | 3.594 |
| Delaware | 3,449.026 |
| South Dakota | 3,794.496 |
| Alaska | 4,562.573 |
| New Hampshire | 4,645.382 |
| Idaho | 6,082.153 |
| Maine | 6,298.352 |
| Hawaii | 6,889.171 |
| Rhode Island | 8,617.513 |
| Montana | 11,175.446 |
Fossil-fuel generation is not the same as fossil-fuel share
Absolute net generation is strongly influenced by the size of a state power system. A state can produce a large quantity of fossil-fuel electricity while obtaining a smaller percentage of its total generation from fossil fuels than a smaller state. The reverse can also occur. A fossil-fuel share comparison requires total generation from all fuels as the denominator. The FOS series alone does not provide that ratio. This distinction matters when interpreting rankings: Texas is first in absolute FOS generation in 2024, but that fact by itself does not identify the state with the highest fossil-fuel percentage. The present comparison intentionally stays with the directly reported generation totals.
FOS combines multiple fossil-fuel types
FOS is an aggregate fossil-fuels category rather than a single fuel. It should not be interpreted as natural-gas generation, coal generation, or petroleum generation alone. States can reach similar FOS totals with very different internal fuel mixes. One state may rely heavily on natural gas, another may have a larger coal component, and a third may use several fossil sources. The aggregate series is useful when the question is the total scale of fossil-fuel electricity production, but it hides differences among individual fuels. A fuel-specific analysis would need narrower EIA fuel facets and should not infer those components from the FOS total.
Generation does not directly measure fuel input or efficiency
A large amount of net generation does not reveal how much fuel was consumed to produce it. Different generating technologies convert fuel into electricity at different efficiencies, and operating conditions can change heat rates. Fuel consumption is measured in other EIA series, often in Btu-based units or fuel-specific physical units. Efficiency analysis requires electricity output and fuel input together. Installed capacity is another separate quantity: two states with similar capacity can generate different amounts depending on utilization. For these reasons, the 2024 FOS generation values should not be used alone to rank fuel efficiency, cost, emissions, or capacity utilization.
The top ten states produce just over half of the total
The top ten states account for 52.19% of the 50-state sum, leaving 47.81% spread across the other 40 states. Texas is the largest single contributor at 13.15%, but it is not a majority position. Florida, Pennsylvania, Ohio, and several other large states make substantial contributions, while many middle-ranked states fall between about 20,000 and 60,000 thousand MWh. This pattern is more dispersed than a distribution dominated by one extreme observation. It suggests that U.S. fossil-fuel generation in 2024 was concentrated in a group of large-producing states while still remaining present at meaningful scale across much of the country.
What the 2024 cross-section can and cannot establish
This comparison is a one-year cross-section. It establishes the state ordering and distribution for 2024, but it does not show whether fossil-fuel generation is rising or falling over time, whether coal is being replaced by natural gas, or how renewable additions changed fossil output. Trend analysis requires multiple years with the same FOS fuel facet, sector 98, generation field, and unit. Explanations of change would also require other evidence such as total demand, installed capacity, retirements, fuel prices, and generation by individual fuel. Keeping the metric definition fixed is essential because changing the fuel facet or sector would create a different series rather than a true year-over-year comparison.
Source and calculation method
The source is the U.S. Energy Information Administration electricity/electric-power-operational-data annual series. The comparison uses 2024 observations for fueltypeid=FOS (fossil fuels), sectorid=98 (Electric Power), field=generation, measured in thousand megawatthours. The total of 2,431,020.251, mean of 48,620.405, median of 30,600.978 thousand MWh, quartiles, rankings, and shares were calculated directly from the 50 published state observations. No missing value was imputed, no observation was converted to zero, and no other year was combined with 2024. If EIA later revises the annual values, the same series definition can be used to refresh the comparison.
Frequently Asked Questions
Which state had the most fossil-fuel net generation in 2024?
Texas ranked first at 319,603.449 thousand MWh, equal to 13.15% of the 50-state sum.
Does more fossil-fuel generation mean a higher fossil-fuel share?
No. These are absolute generation totals. A fossil-fuel share requires total generation from all fuels as the denominator.
What does FOS mean in the EIA series?
FOS is the aggregate fossil-fuels category. It should not be treated as a single-fuel series for natural gas, coal, or petroleum.
Are any state observations zero or missing?
No. All 50 states have positive 2024 observations in this series.
Related Articles
Green Map creates custom-edited map images using open geographic data sources such as geoBoundaries, Natural Earth, OpenStreetMap, and government open data. These maps are edited visual materials, not raw data files, and are provided for education, documents, presentations, and graphic reference.