A country can have a modest coal share and still run most of its power system on fossil fuels if natural gas or oil fills the gap. That is why this article uses World Bank WDI series EG.ELC.FOSL.ZS, which combines electricity generated from oil, natural gas and coal into one share of total electricity production. The map is therefore a measure of system-wide fossil-fuel dependence in electricity generation, not a ranking of coal use, petroleum output, gas reserves or total energy consumption.
The verified common-year file contains 217 World Bank country/economy master rows. A numeric 2021 observation is available for 207, while 10 remain missing. Across the 207 numeric observations, the unweighted mean is 60.5% and the median is 67.3%. That median places the middle reported economy at roughly two-thirds fossil generation. Fossil generation is therefore not confined to a small upper tail: most reported systems still obtain at least half of their electricity from the three fossil-fuel groups combined.
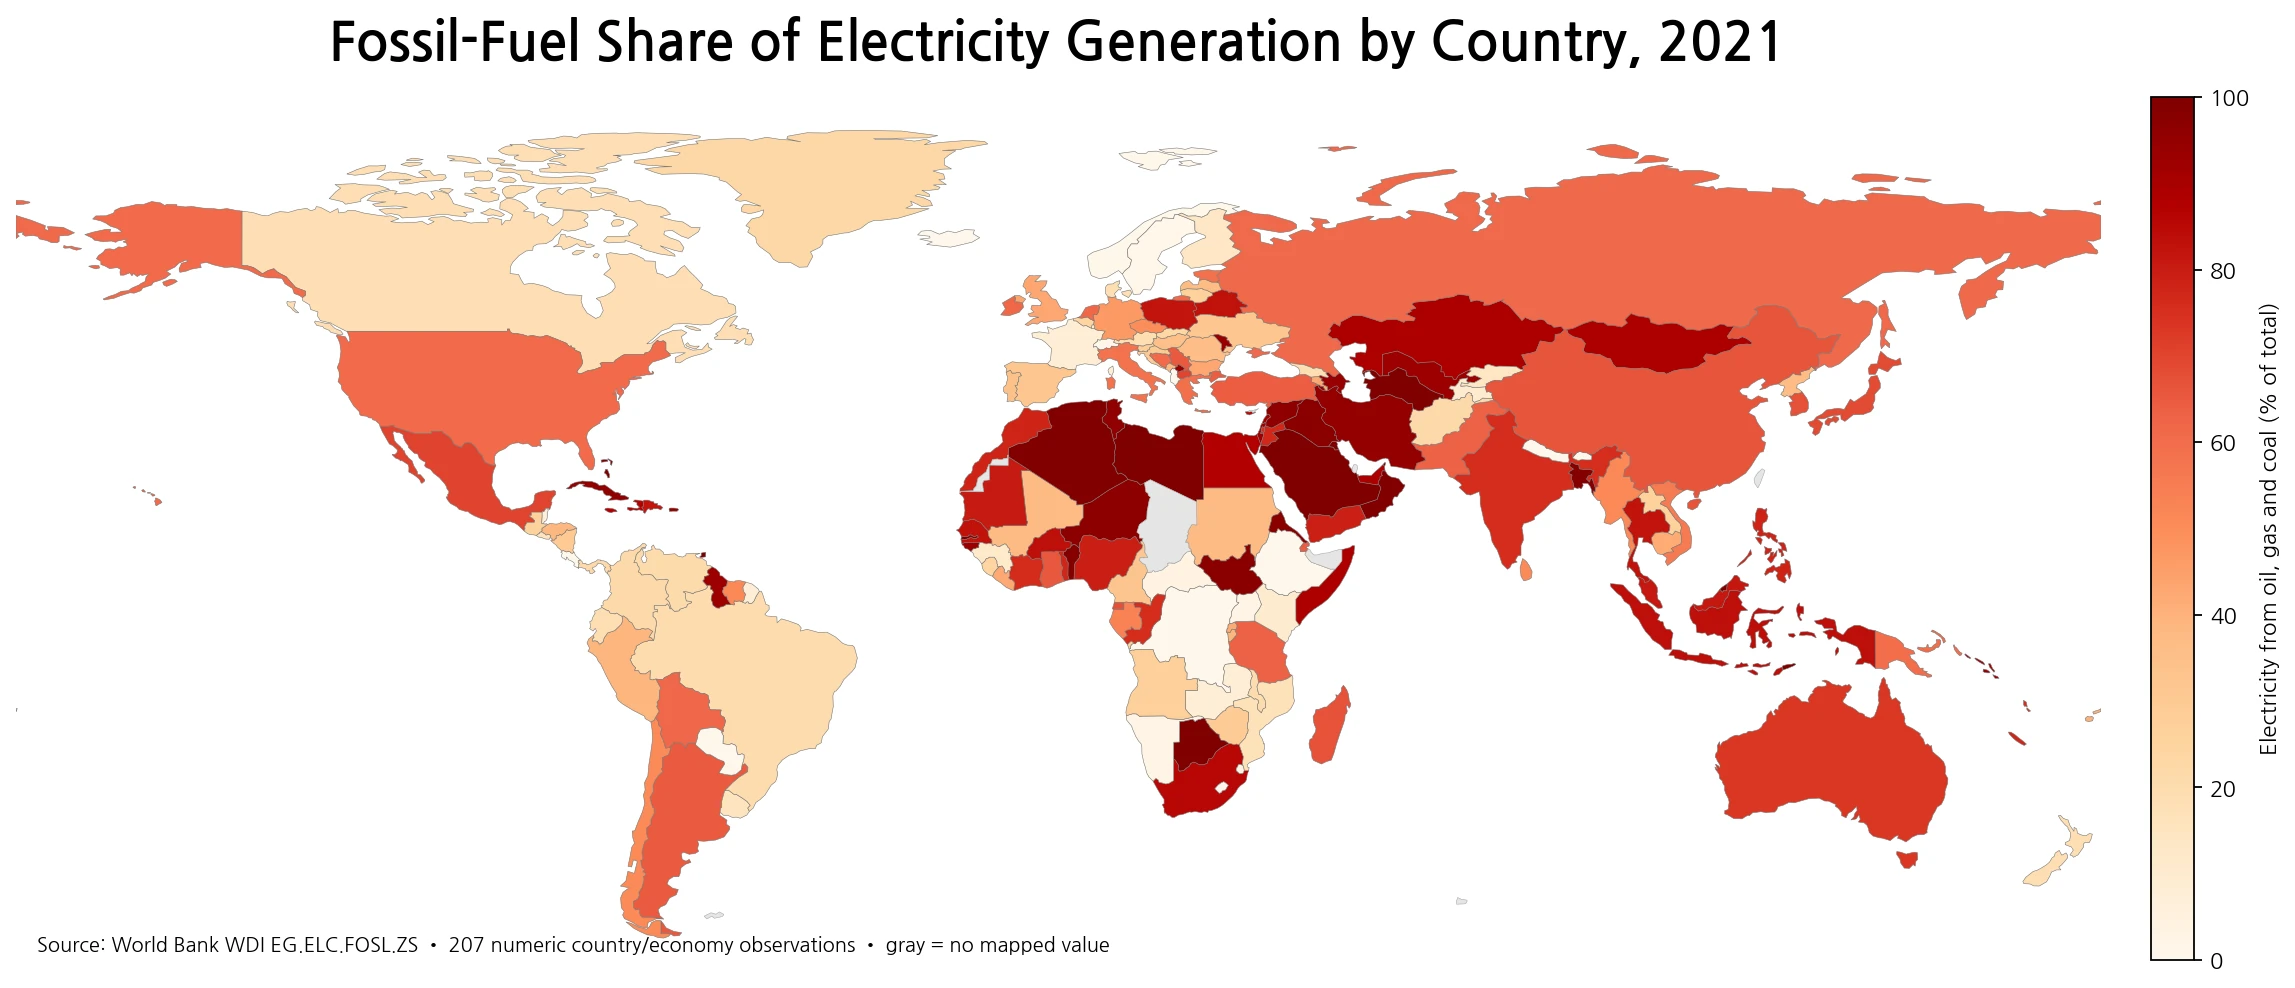
Table of Contents
Nearly two-thirds of reported systems are above 50% fossil generation
Of the 207 numeric observations, 131 are at or above 50%. That is 63.3% of the country/economy set. 96 are at or above 75%, 82 reach at least 80%, and 57 are at 90% or higher. Only 21 fall below 10%. The center of the distribution is therefore not a low-fossil zone: the median itself is 67.3%.
| 2021 fossil-fuel share | Countries/economies | Share of 207 |
|---|---|---|
| 0–<20% | 36 | 17.4% |
| 20–<40% | 32 | 15.5% |
| 40–<60% | 18 | 8.7% |
| 60–<80% | 39 | 18.8% |
| 80–100% | 82 | 39.6% |
The 80–100% band alone contains 82 observations, and another 39 sit between 60% and 80%. Together those two bands account for 58.5% of the numeric set. The first quartile is 30.5% and the third quartile is 92.9%, so there is still a wide spread across countries. But the distribution is better described as one with many highly fossil-dependent electricity systems than as one centered near zero.
Selected major economies span both sides of the median
Selected economies span both sides of the median. Japan is 68.6% and Mexico 70.0%, while Australia is 73.3% and India 75.6%. China is 66.2%, Russia 61.2% and the United States 60.8%. Germany is 46.6% and the United Kingdom 43.1%, while Canada is 18.2%, Brazil 20.0% and France 8.3%. Korea, Rep. is 67.3%, exactly matching the 207-observation median. Similar percentages should not be read as evidence that countries use the same fossil-fuel mix.
| Economy | Oil + gas + coal share in 2021 |
|---|---|
| Saudi Arabia | 99.8% |
| South Africa | 85.6% |
| Indonesia | 83.7% |
| Poland | 82.2% |
| India | 75.6% |
| Australia | 73.3% |
| Mexico | 70.0% |
| Japan | 68.6% |
| Korea, Rep. | 67.3% |
| China | 66.2% |
| Russian Federation | 61.2% |
| United States | 60.8% |
| Germany | 46.6% |
| United Kingdom | 43.1% |
| Brazil | 20.0% |
| New Zealand | 18.5% |
| Canada | 18.2% |
| France | 8.3% |
| Sweden | 0.8% |
| Norway | 0.6% |
| Iceland | 0.0% |
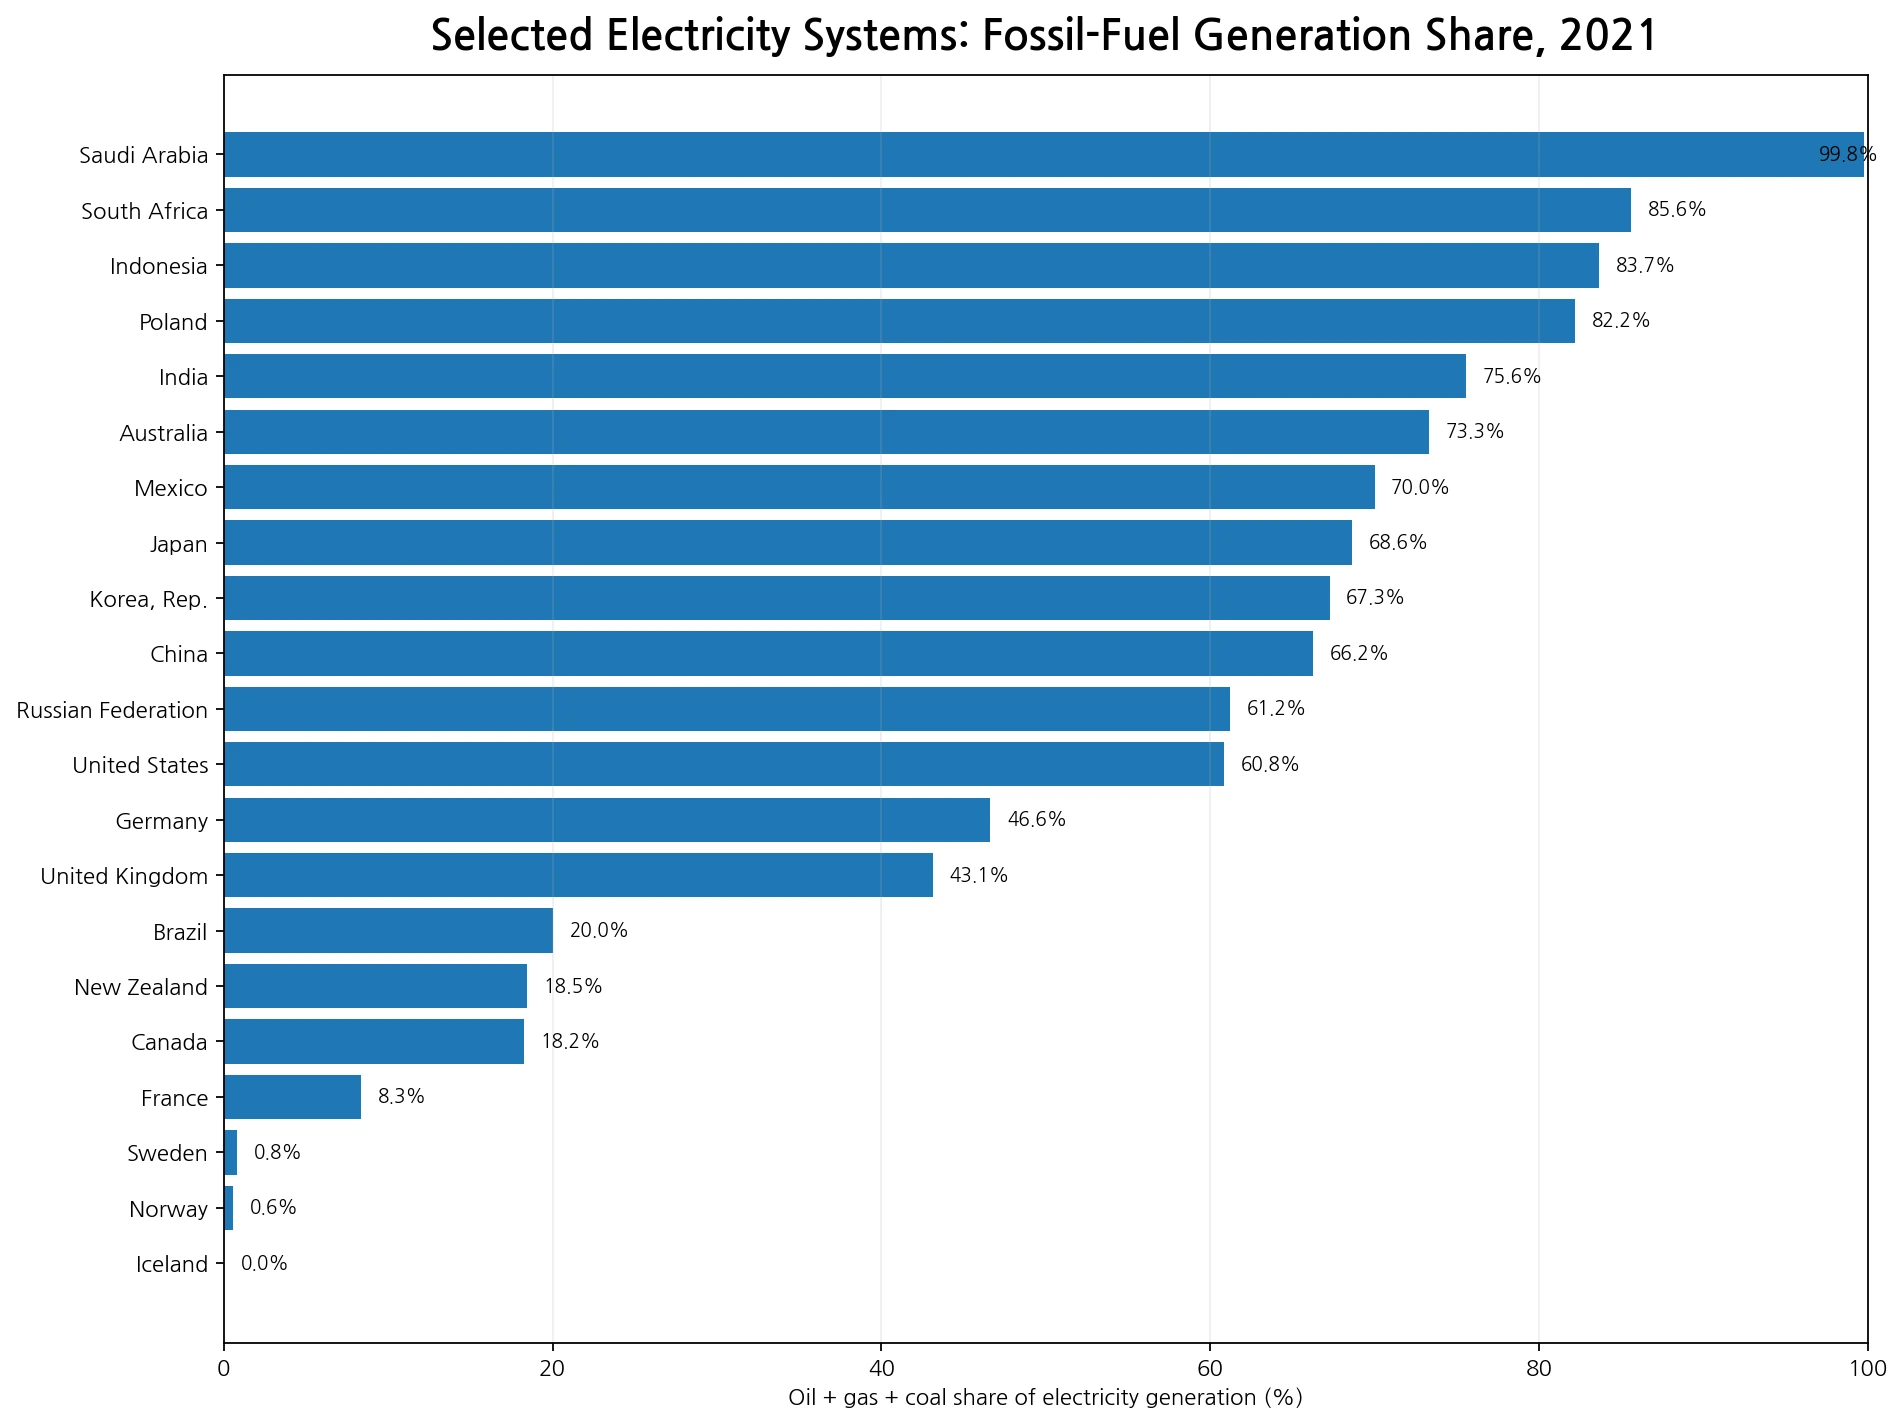
The median position should not be interpreted as a statement about global electricity volume. Each economy counts once in this distribution, so China, the United States and India receive the same statistical weight as a small island economy. The 104th observation out of 207 marks the middle of the equal-weight country/economy distribution. It does not mean that half of world electricity is generated in systems above or below the 67.3% level.
A 99–100% fossil share does not reveal whether oil, gas or coal dominates
At the upper edge, Comoros, Gibraltar and Sint Maarten report 100.0%. Turkmenistan, Libya, Bahrain, Trinidad and Tobago, Brunei Darussalam, Kuwait and Saudi Arabia all exceed 99%, and Botswana is also near that level. Those numbers show that fossil fuels as a group dominate electricity production in those observations. They do not identify the dominant fossil fuel.
| Country or economy | 2021 fossil-fuel share |
|---|---|
| Comoros | 100.0% |
| Gibraltar | 100.0% |
| Sint Maarten (Dutch part) | 100.0% |
| Turkmenistan | 100.0% |
| Libya | 100.0% |
| Bahrain | 99.9% |
| Trinidad and Tobago | 99.9% |
| Brunei Darussalam | 99.9% |
| Kuwait | 99.8% |
| Saudi Arabia | 99.8% |
| Botswana | 99.8% |
| Timor-Leste | 99.6% |
This is the main conceptual difference between this indicator and the separate oil- or coal-generation indicators. EG.ELC.FOSL.ZS is an official combined World Bank series; it is not a sum reconstructed for this article from three unrelated tables. That makes it useful for asking how much of an electricity system remains tied to fossil inputs overall. It is less useful for explaining which fuel is replacing which, because two economies with the same 80% combined share can arrive there through very different mixes of gas, oil and coal.
Low fossil shares do not automatically mean 100% renewable electricity
At the lower end, Iceland is close to zero, Norway is about 0.6%, Sweden 0.8% and France 8.3%. It would be incorrect to label the remainder of those power systems “renewable” using this file alone. Non-fossil electricity can include hydropower, nuclear power, wind, solar, geothermal energy and other sources. The current dataset contains only the combined fossil share, so it does not allocate the non-fossil remainder among those technologies.
| Low-share country or economy | 2021 fossil-fuel share |
|---|---|
| Albania | 0.0% |
| Bhutan | 0.0% |
| Nepal | 0.0% |
| Paraguay | 0.0% |
| Iceland | 0.0% |
| Ethiopia | 0.0% |
| Congo, Dem. Rep. | 0.0% |
| Costa Rica | 0.0% |
| Lesotho | 0.2% |
| Norway | 0.6% |
| Sweden | 0.8% |
| Switzerland | 0.8% |
The same rule applies to every observation. If an economy is at 67%, the other 33% is simply outside the oil-gas-coal numerator. It is not automatically a renewable-energy percentage. A separate renewable-generation indicator and separate nuclear or hydro series are needed to describe the remainder accurately.
Fossil-generation share is not the same thing as electricity carbon intensity
The map is relevant to decarbonization, but it is not an emissions-intensity map. Coal, natural gas and oil do not have identical emissions profiles per unit of electricity, and plant efficiency also matters. Combined heat and power, fuel quality and technology can further change the relationship between fuel share and emissions. Two systems with identical fossil shares can therefore have different grams of carbon dioxide per kilowatt-hour.
The share is also independent of scale. A small system at 95% fossil generation can produce far fewer fossil-fuel gigawatt-hours than a very large system at 60%. Absolute generation requires total electricity production or fuel-specific GWh data. Power-sector emissions require generation volumes and emissions factors or directly reported emissions. This map should answer a composition question, not substitute for those volume and emissions datasets.
The 60.5% unweighted mean is not the fossil share of world electricity
The simple mean across the 207 numeric country/economy observations is 60.5%. It gives every observation one equal weight. It therefore cannot be written as “60.5% of world electricity came from fossil fuels.” A world total requires weighting each economy by its electricity generation. The World Bank metadata can use total electricity production as a weight for aggregate calculations; the simple mean used here has a different purpose, which is to summarize the cross-country distribution.
The median of 67.3% avoids the influence of country size and extreme values, but it has the same limitation with respect to world electricity volume. It tells us what the middle reported country/economy observation looks like. It does not tell us the generation-weighted global mix.
Why the comparison holds the year constant at 2021
Power mixes can move quickly enough that mixing the latest available year from each country would blur geographic differences with time differences. The bundled collection rule selected 2021 as a common year with broad coverage: 207 numeric values out of a 217-row World Bank country/economy master. The ten missing rows remain missing rather than being backfilled from an earlier year. That keeps every displayed comparison on the same time reference.
The map joins ISO-3 identifiers to a low-resolution Natural Earth boundary layer. 168 polygons receive a numeric value in that boundary file, fewer than the 207 statistical observations. Small islands and separately reported territories may have valid data without a visible polygon at this scale. All rankings, medians and distribution counts use the full 207-observation statistical file, not only the polygons that can be colored.
Data definition and source
The statistical source is World Bank World Development Indicators series EG.ELC.FOSL.ZS. The World Bank defines it as the share of total electricity production generated from oil, gas and coal sources and identifies the IEA Energy Statistics Data Browser as the underlying source. Oil includes crude oil and petroleum products; gas refers to natural gas while excluding natural gas liquids; and the coal category includes coal, brown coal and specified derived fuels.
The article uses the shorter phrase “fossil-fuel share of electricity generation” for readability, but every calculation follows the official indicator scope. Values are percentages of total electricity production, not percentages of installed capacity, final energy consumption, fuel production, fuel exports or national emissions.
Frequently Asked Questions
What does the fossil-fuel electricity share include?
World Bank EG.ELC.FOSL.ZS combines electricity generated from oil and petroleum products, natural gas, and coal-category fuels, then divides that amount by total electricity production.
What does the 67.3% median mean in this comparison?
A median of 67.3% means half of the 207 numeric country/economy observations are at or below that value and half are at or above it. It is an equal-weight cross-country statistic, not a global electricity share.
Does a low fossil share mean the rest is all renewable electricity?
No. The non-fossil remainder can include nuclear, hydro, wind, solar, geothermal and other sources. This combined indicator does not split that remainder by technology.
Is the 60.5% simple mean the fossil share of world electricity?
No. It is an unweighted mean across 207 countries and economies. A global electricity share requires weighting countries by their total electricity generation.
Related Articles
These Green Map articles separate the combined fossil-fuel question from individual fuels, final-energy renewables and electricity access.
- Global Oil-Fired Electricity Share Map – 2021 Country Comparison
- Global Renewable Energy Share Map – 2021 Final Energy Consumption
- Global Electricity Access Map – 2024 Country Comparison
Green Map creates custom-edited map images using open geographic data sources such as geoBoundaries, Natural Earth, OpenStreetMap, and government open data. These maps are edited visual materials, not raw data files, and are provided for education, documents, presentations, and graphic reference.