The 2025 state data show a wide spread in the amount of fuel energy consumed for electricity generation by the U.S. Electric Power Sector Non-CHP category. With EIA filters fixed at all fuels (ALL), sector 90, and consumption-for-eg-btu, the 50 states plus the District of Columbia sum to 32,293.98 million MMBtu. This is an energy-input measure. It is not electricity generation, retail sales, generating capacity, or a direct measure of plant efficiency.
Texas recorded 3,524.27 million MMBtu, or 10.9% of the 51-jurisdiction total. Pennsylvania and Florida were next at 1,992.78 and 1,985.30 million MMBtu, and Illinois followed at 1,686.49. The top ten jurisdictions together accounted for 49.2% of the total. That pattern indicates concentration in large power-producing states, but not domination by a single state: nearly half of the measured input remained outside the top ten.
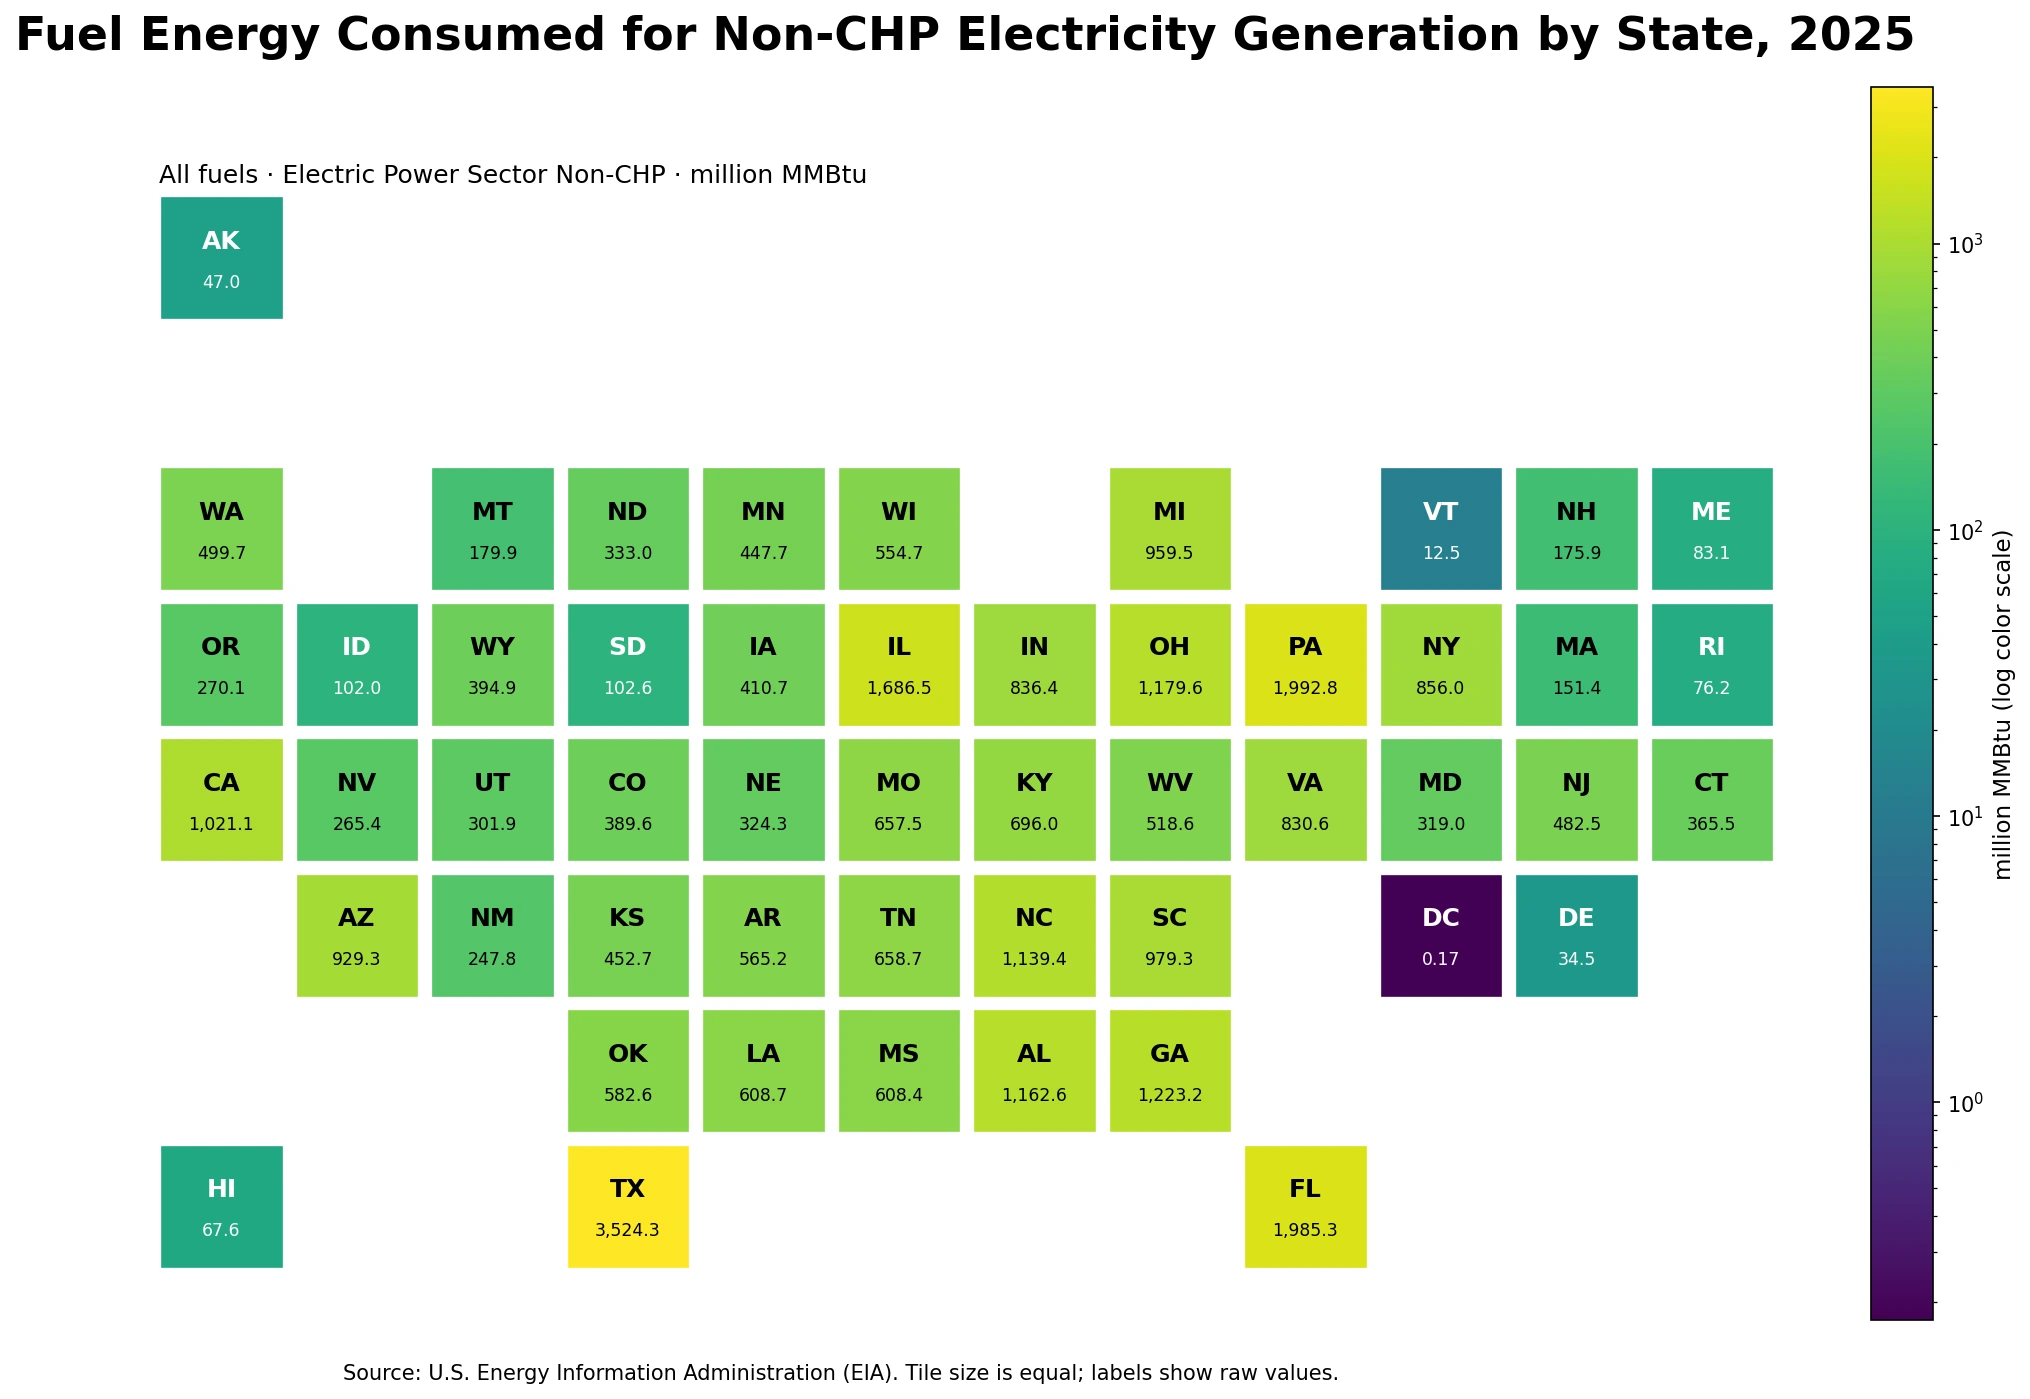
Table of Contents
Texas led the 2025 total, while several large states formed a broad upper tier
Texas was about 1.77 times Pennsylvania, the second-highest jurisdiction. Pennsylvania and Florida were nearly tied, while Illinois remained well above the next group. Georgia, Ohio, Alabama, and North Carolina each exceeded 1,100 million MMBtu. California also crossed 1,000 million MMBtu and ranked inside the top ten. The high-input group therefore spans the South, Midwest, Northeast, and West rather than forming a single contiguous regional block.
| Jurisdiction | 2025 fuel input (million MMBtu) | Share of 51 total |
|---|---|---|
| Texas | 3,524.27 | 10.9% |
| Pennsylvania | 1,992.78 | 6.2% |
| Florida | 1,985.30 | 6.1% |
| Illinois | 1,686.49 | 5.2% |
| Georgia | 1,223.17 | 3.8% |
| Ohio | 1,179.56 | 3.7% |
| Alabama | 1,162.55 | 3.6% |
| North Carolina | 1,139.45 | 3.5% |
| California | 1,021.10 | 3.2% |
| South Carolina | 979.31 | 3.0% |
The top five jurisdictions represented 32.2% of the total, the top ten 49.2%, and the top fifteen 62.9%. These concentration measures describe absolute energy input within this specific EIA slice. They should not be read as market share in electricity sales, as a fuel-mix percentage, or as a performance ranking. A large state can post a high input simply because it operates a large amount of non-CHP generation and serves a large electricity system.
The gap between the mean and median shows a right-skewed distribution
The mean across 51 jurisdictions was 633.22 million MMBtu, while the median was 482.45. The mean was therefore about 31.2% above the median, which is consistent with a long upper tail created by states such as Texas, Pennsylvania, Florida, and Illinois. The first quartile was 256.56 and the third quartile was 846.19, placing the middle half of jurisdictions in a band of roughly 257 to 846 million MMBtu.
That distribution is one reason absolute totals need context. A high number does not automatically indicate waste, an inefficient fleet, or heavy dependence on one particular fuel. The indicator combines fuel energy consumed for generation across the EIA ALL fuel category within the Non-CHP electric power sector. Interpreting efficiency requires a denominator such as electricity output. Interpreting dependence requires a denominator such as total generation or total energy input, split by fuel.
Very small values are reported observations, not missing data
The District of Columbia was the minimum at 0.17 million MMBtu. Vermont reported 12.49, Delaware 34.51, Alaska 47.03, and Hawaii 67.60. None of these values is a missing-data placeholder: all 51 jurisdictions have a 2025 observation. In particular, the D.C. value is 0.17339 rather than zero, so the visualization preserves it as a real reported amount instead of grouping it with missing records.
Small absolute inputs can reflect a small local generating fleet, a small electricity market, a different generation mix, or other structural factors, but this single table does not identify the cause. The safe conclusion is narrower: within the EIA Non-CHP electric power slice for 2025, those jurisdictions used less measured fuel energy for electricity generation than the states at the top of the distribution.
All fuels, Non-CHP, and electricity generation define a specific data slice
Three filters are essential. First, fueltypeid=ALL means the table aggregates the fuel categories represented by EIA in this operational-data series rather than isolating petroleum, natural gas, coal, or another single fuel. Second, sectorid=90 identifies Electric Power Sector Non-CHP, so this is not the same as a CHP useful-thermal-output series. Third, consumption-for-eg-btu restricts the metric to fuel energy consumed for electricity generation. Changing any one of those dimensions creates a different statistical series.
This distinction matters because several EIA topics can sound nearly identical in a headline. A petroleum-liquids article may measure thousand barrels. A broader petroleum series may include petroleum coke conversions. A useful-thermal-output article measures fuel energy associated with producing useful heat in CHP operations. The present series instead uses a common Btu-based unit for all-fuel energy input used to generate electricity in the Non-CHP electric power sector.
Fuel energy input is not electricity output
Power plants convert energy inputs into electricity with losses, and conversion efficiency differs by technology and operating conditions. Consequently, 1,000 million MMBtu of fuel input does not imply the same number of megawatt-hours in every state. To compare output, an EIA generation series is more appropriate. To compare conversion efficiency, a heat-rate measure—Btu of input per kilowatt-hour of output—is the relevant concept. The present indicator answers a different question: how large was the energy input devoted to non-CHP electricity generation in each jurisdiction?
The difference also prevents a common ranking error. Texas being first in fuel energy input does not establish that Texas was first in efficiency, in per-capita consumption, or in the carbon intensity of electricity. Each of those questions requires additional variables. The map is best treated as a scale map of energy inputs within one consistent EIA definition.
How to read the million MMBtu unit
One MMBtu equals one million Btu. Because EIA reports this series in million MMBtu, a table value of 1 represents one million MMBtu, which is one trillion Btu. On that basis, the Texas value of 3,524.27 million MMBtu is about 3.524 quadrillion Btu. Keeping the source unit is usually the least confusing approach because it avoids stacking unit conversions while comparing states.
The Btu framework is useful because physical fuel units differ. Coal may be measured by mass, natural gas by volume, and petroleum by barrels, but their energy content can be expressed on a common Btu basis. That common unit makes an ALL-fuels aggregate possible. The tradeoff is that an aggregate no longer reveals which fuel drove the total; a fuel-specific analysis requires separate EIA facet values.
The tile map uses logarithmic color but keeps raw labels
The observed range is unusually wide: from 0.17339 million MMBtu in the District of Columbia to 3,524.27 in Texas. A linear color ramp would compress most states into a narrow visual band. The tile map therefore uses a logarithmic color normalization while printing each jurisdiction’s raw value directly on the tile. The transformation changes only the color display; rankings, shares, and summary statistics use the original observations.
- Each tile has equal area, so geographic size does not give Texas or Alaska extra visual weight.
- The label is the untransformed 2025 value in million MMBtu.
- All 51 jurisdictions have data for the same year, so no cross-year values are mixed.
- Tile position approximates geography but does not show transmission links, physical distance, or balancing areas.
Three checks keep the 2025 comparison in scope
First, distinguish totals from rates. Texas accounts for 10.9% of this 51-jurisdiction total, but that is not the percentage of Texas electricity generated from any particular fuel. Second, retain the Non-CHP boundary; CHP-related fuel use belongs to other EIA sector slices. Third, treat the chart as a one-year cross-section. Establishing whether a state is rising or falling requires the same series over multiple years, not a single 2025 observation.
With those limits, the data provide a useful spatial baseline. High values appear in several large states across different regions, while the smallest jurisdictions cluster far below the national state-level distribution. A next analytical step could separate ALL into individual fuel types or divide energy input by electricity generation to compare heat-rate-like intensity, but those would be new calculations and should not be folded into this absolute-input ranking without clearly changing the question.
Source and calculation method
U.S. Energy Information Administration Electric Power Operational Data is the primary source. The slice uses annual 2025 data, fueltypeid=ALL, sectorid=90, and the consumption-for-eg-btu field. The source contains 51 rows covering the 50 states and the District of Columbia, with no missing values in the supplied state observations.
From those 51 published values, the calculated total is 32,293.98, the mean 633.22, and the median 482.45 million MMBtu. The top ten account for 49.2% of the total. Nine jurisdictions exceed 1,000 million MMBtu and together represent 46.2% of the measured total. No imputation, estimated state values, or cross-year substitutions were added to these calculations.
Frequently Asked Questions
Which state used the most fuel energy for non-CHP electricity generation in 2025?
Texas ranked first at 3,524.27 million MMBtu, about 10.9% of the total across the 50 states and the District of Columbia.
Does this metric measure electricity generation?
No. consumption-for-eg-btu measures fuel-energy input used for electricity generation. Electricity output and conversion efficiency require separate generation or heat-rate measures.
How is the ALL-fuels series different from petroleum fuel consumption?
This series uses fueltypeid=ALL and aggregates the fuel categories represented in the EIA table on a Btu basis. Petroleum-liquids and broader petroleum series use narrower fuel definitions and may use different physical units.
What does Non-CHP mean in this EIA slice?
It identifies the Electric Power Sector Non-CHP category, separating these electricity-generation inputs from combined heat and power (CHP) sector slices and useful-thermal-output fuel use.
Related Articles
Green Map creates custom-edited map images using open geographic data sources such as geoBoundaries, Natural Earth, OpenStreetMap, and government open data. These maps are edited visual materials, not raw data files, and are provided for education, documents, presentations, and graphic reference.