Electricity generated by businesses in the U.S. industrial and commercial sectors was highly concentrated in a small group of states in 2024. The U.S. Energy Information Administration (EIA) State Electricity Profiles report 152.01 TWh when the 50 states and Washington, D.C. are added together. Texas alone recorded 42.72 TWh, Louisiana 27.74 TWh, and California 14.16 TWh. Those three jurisdictions accounted for 55.7% of the 51-jurisdiction total. The comparison therefore reveals much more than a simple ranking: it shows how unevenly this specific kind of business-operated generation was distributed across the country.
The scope of the metric matters. EIA labels the series Net Generation from Industrial and Commercial Sectors and reports it in megawatthours. Net generation is gross electricity output minus electricity used at the generating station for station service or auxiliaries. EIA describes commercial and industrial generation in its national electricity overview as generation from plants operated by businesses in those sectors, primarily for onsite use. This is not total electricity generation in a state, not the amount of electricity industrial and commercial customers consumed, not electricity purchased from the grid, and not installed generating capacity. Each of those questions has a different EIA measure.
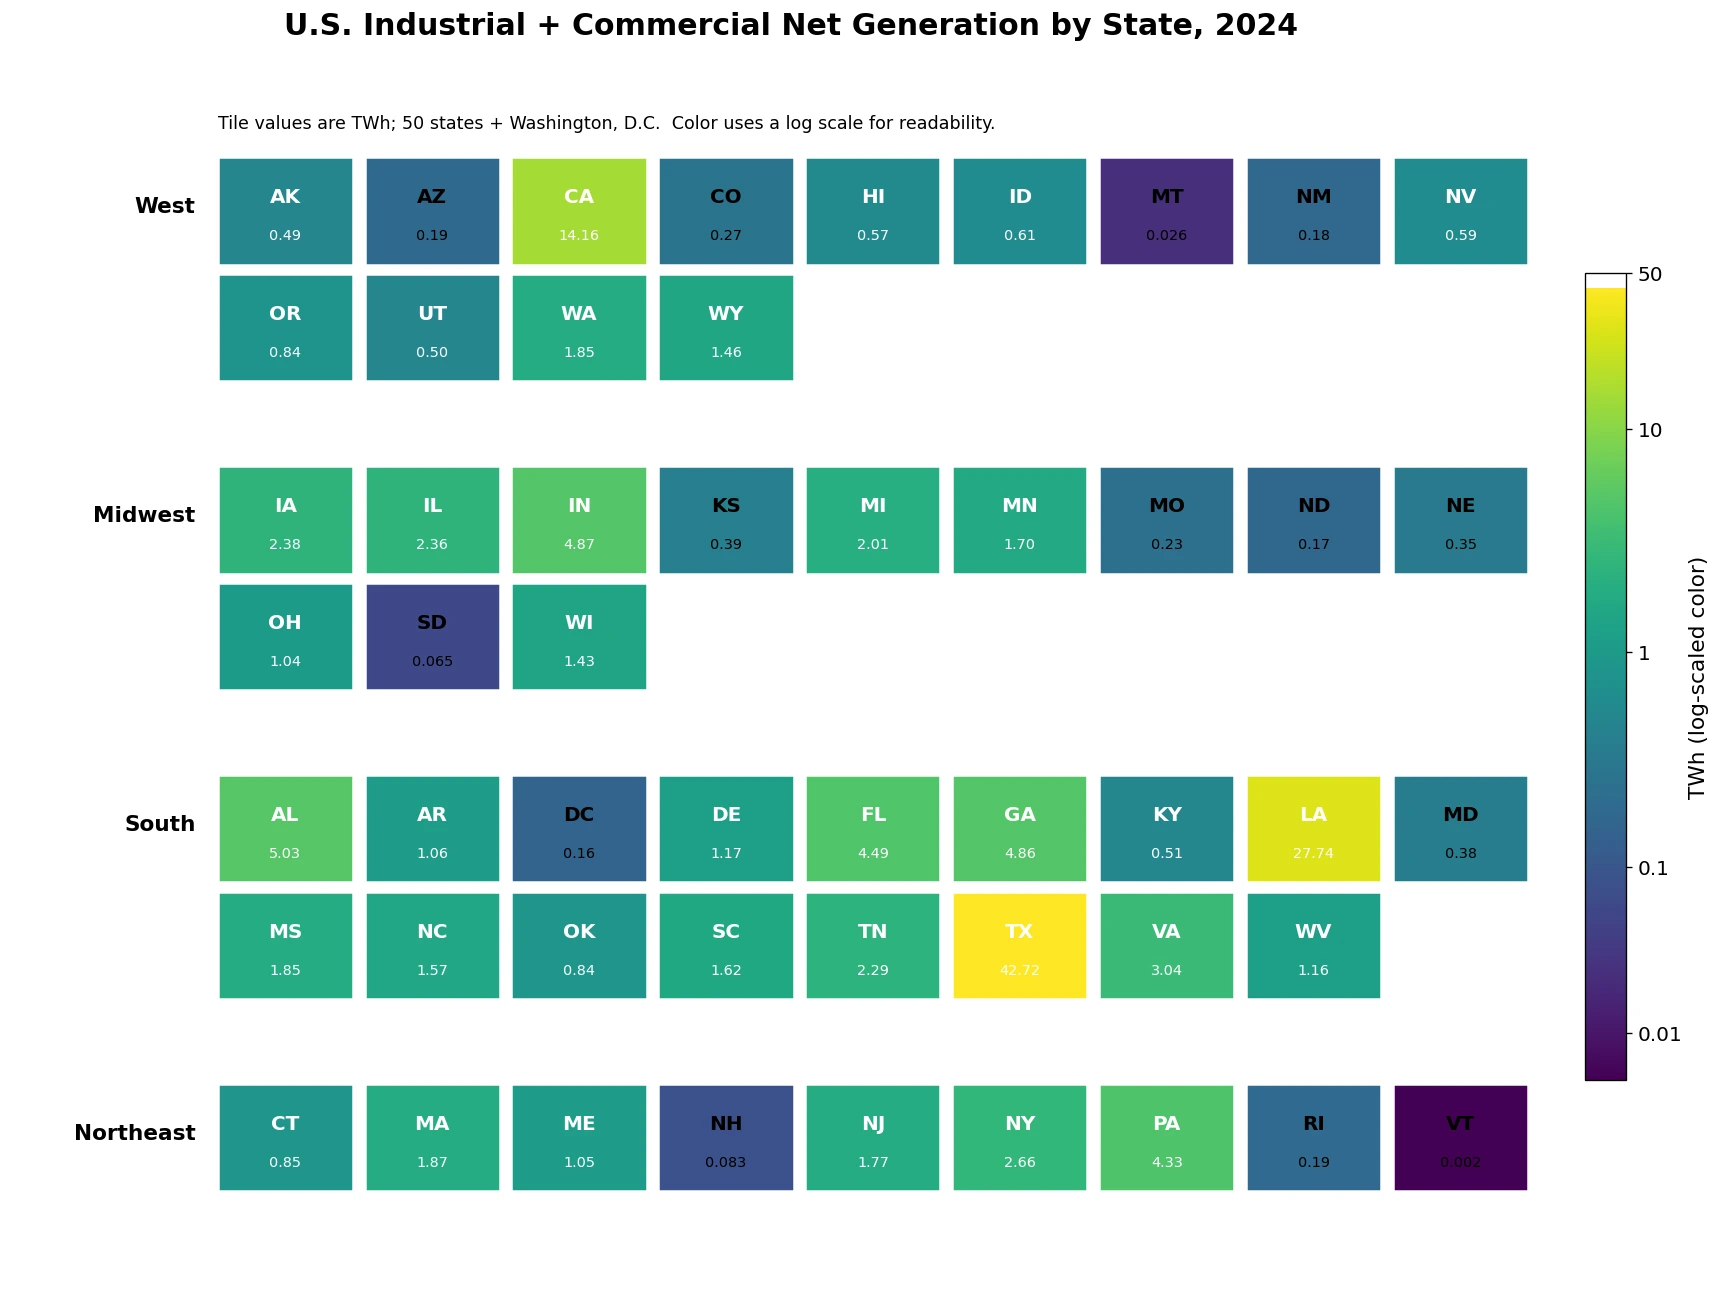
Table of Contents
Texas and Louisiana alone represented 46.4% of the state-level total
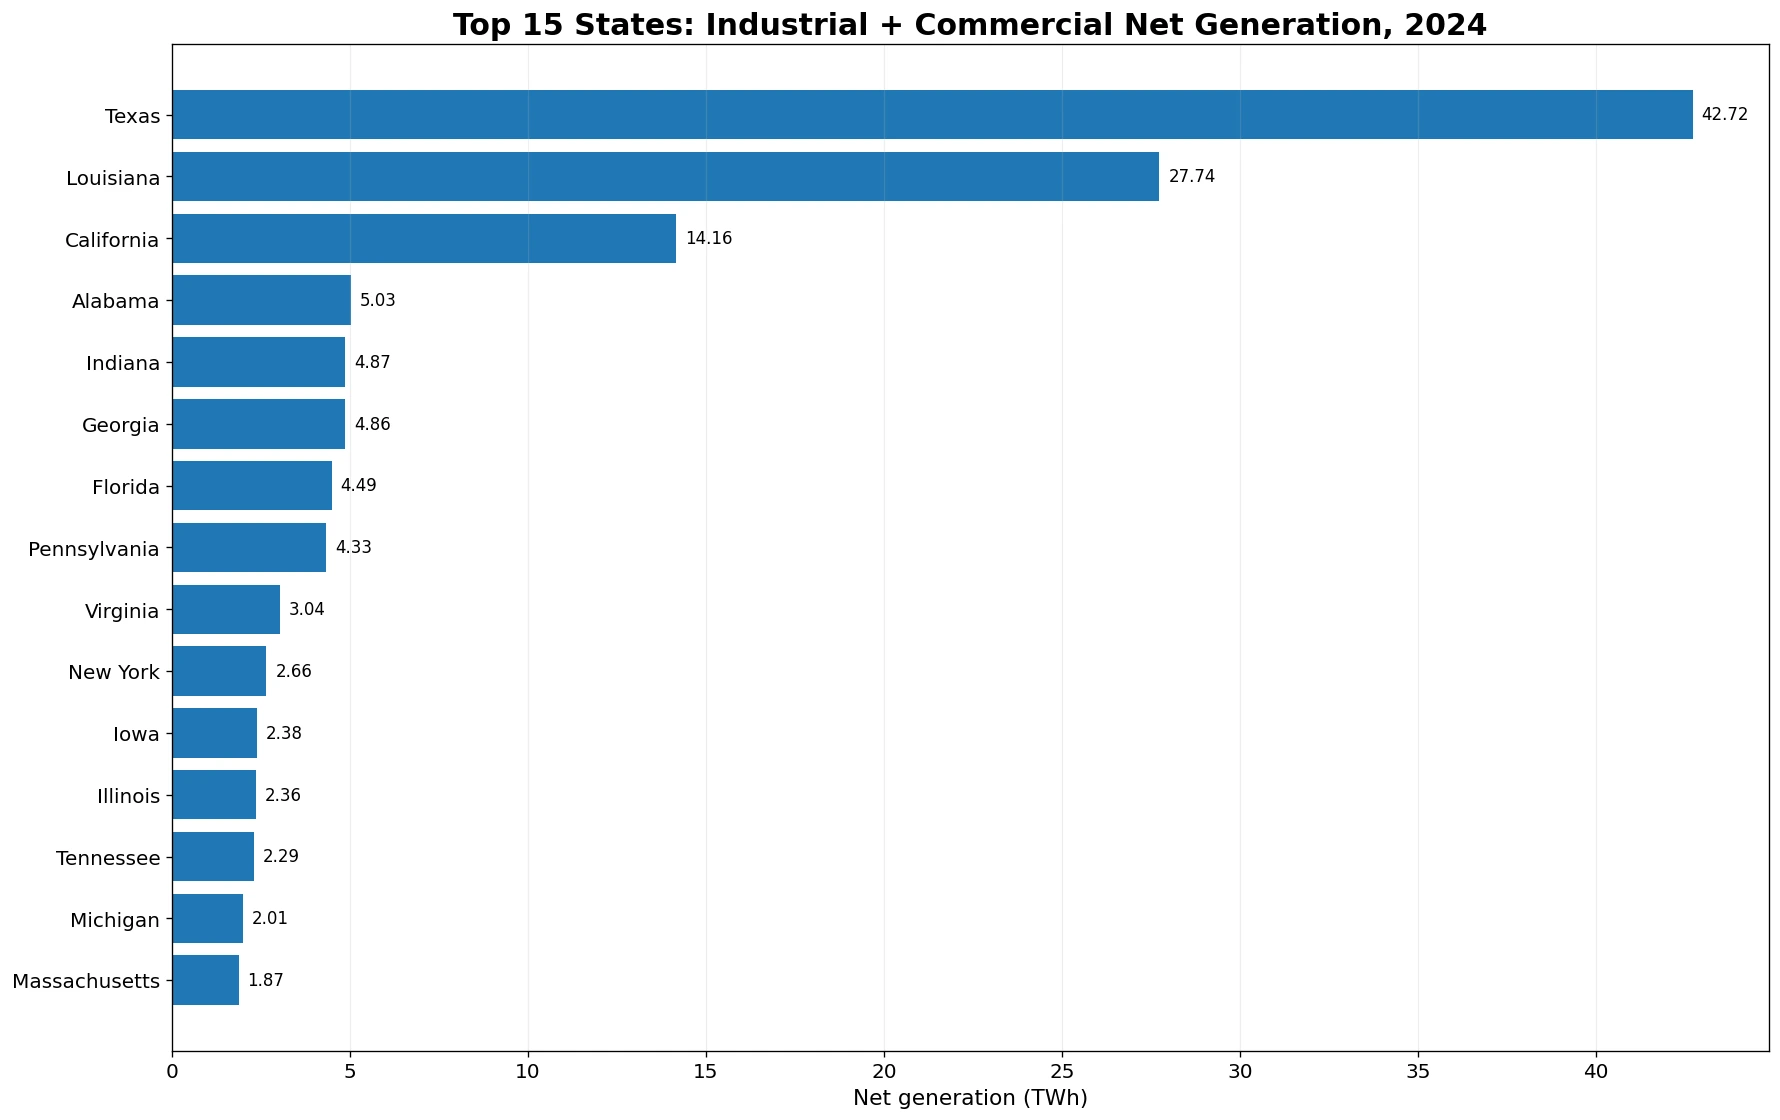
Texas was not only the highest observation; it was exceptionally large relative to most of the distribution. Its 42.72 TWh represented about 28.1% of the 51-jurisdiction sum. Louisiana contributed another 27.74 TWh, or about 18.2%. Together they produced 70.47 TWh, equal to 46.4% of the total. Adding California at 14.16 TWh lifts the cumulative share to 55.7%. In other words, three jurisdictions accounted for more generation in this sector classification than the other 48 combined. That is why a national average by itself would hide the shape of the data.
The next group was much smaller. Alabama recorded 5.03 TWh, Indiana 4.87 TWh, Georgia 4.86 TWh, Florida 4.49 TWh, and Pennsylvania 4.33 TWh. Virginia was at 3.04 TWh and New York at 2.66 TWh. Only four states exceeded 5 TWh, and only Texas, Louisiana, and California exceeded 10 TWh. These gaps are descriptive, not causal. The state file does not contain industry mix, fuel mix, operating hours, CHP configuration, power prices, or site-specific demand, so the ranking should not be converted into a single explanation for why one state is higher than another.
| Rank | State | 2024 net generation (TWh) |
|---|---|---|
| 1 | Texas | 42.72 |
| 2 | Louisiana | 27.74 |
| 3 | California | 14.16 |
| 4 | Alabama | 5.03 |
| 5 | Indiana | 4.87 |
| 6 | Georgia | 4.86 |
| 7 | Florida | 4.49 |
| 8 | Pennsylvania | 4.33 |
| 9 | Virginia | 3.04 |
| 10 | New York | 2.66 |
| 11 | Iowa | 2.38 |
| 12 | Illinois | 2.36 |
| 13 | Tennessee | 2.29 |
| 14 | Michigan | 2.01 |
| 15 | Massachusetts | 1.87 |
The top ten jurisdictions accounted for 74.9% of the total
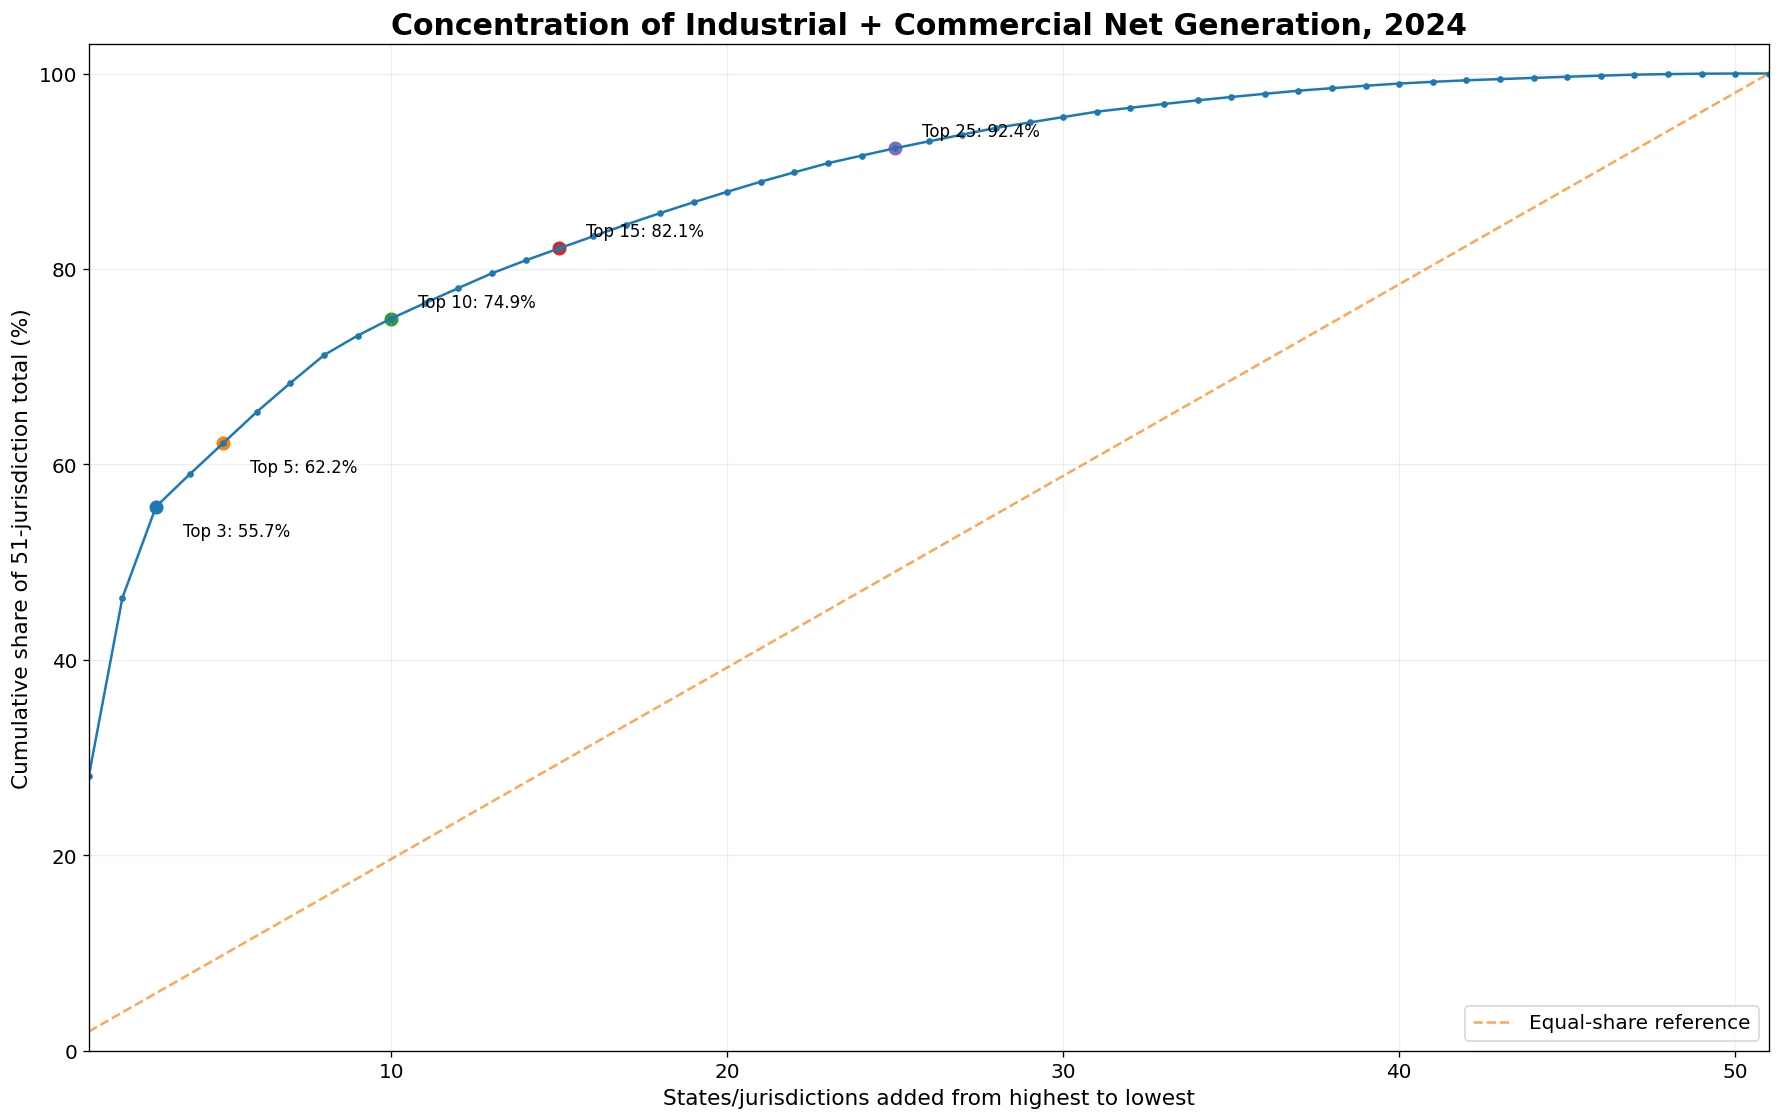
Concentration remains strong beyond the top three. The three largest jurisdictions accounted for 55.7% of the sum, the top five for 62.2%, the top ten for 74.9%, and the top fifteen for 82.1%. The top ten represent fewer than one-fifth of the 51 observations but nearly three-quarters of the generation. These shares use absolute MWh, not population-adjusted or output-adjusted values. A state with a large industrial economy can therefore rank highly because of scale even if its generation per worker, per resident, or per dollar of industrial output is unremarkable. Those normalized comparisons would require additional denominators.
The cumulative curve makes this imbalance easy to see. Under a hypothetical equal distribution, ten of 51 jurisdictions would contribute about 19.6% of the total. The observed top-ten share is 74.9%. Equal distribution is not a benchmark that the real economy should be expected to meet—states differ enormously in population, industry, geography, and facility structure—but the distance from that reference line quantifies how much this particular measure is concentrated. The chart is therefore useful as a description of scale, not as a judgment about whether the distribution is efficient or desirable.
The median was 1.06 TWh, far below the 2.98 TWh mean
The simple mean across all 51 jurisdictions was 2.98 TWh, while the median was only 1.06 TWh. The mean is about 2.8 times the median because a few very large observations pull it upward. The first quartile was about 0.38 TWh and the third quartile about 2.15 TWh, which places the middle half of the observations inside a relatively compact range compared with the top three. Describing the “average state” as roughly 3 TWh would therefore give a misleading impression of what a typical observation looks like. Median and quartiles are more informative for the center of this skewed distribution.
The band counts tell the same story in another way. Four jurisdictions were below 0.1 TWh, 12 were between 0.1 and 0.5 TWh, and seven were between 0.5 and 1 TWh. That makes 23 jurisdictions below 1 TWh. Another 14 were between 1 and 2 TWh and ten between 2 and 5 TWh. Only one jurisdiction fell in the 5–10 TWh range, one in the 10–20 TWh range, and two in the 20–50 TWh range. A very small upper tail therefore contributes an outsized portion of the total.
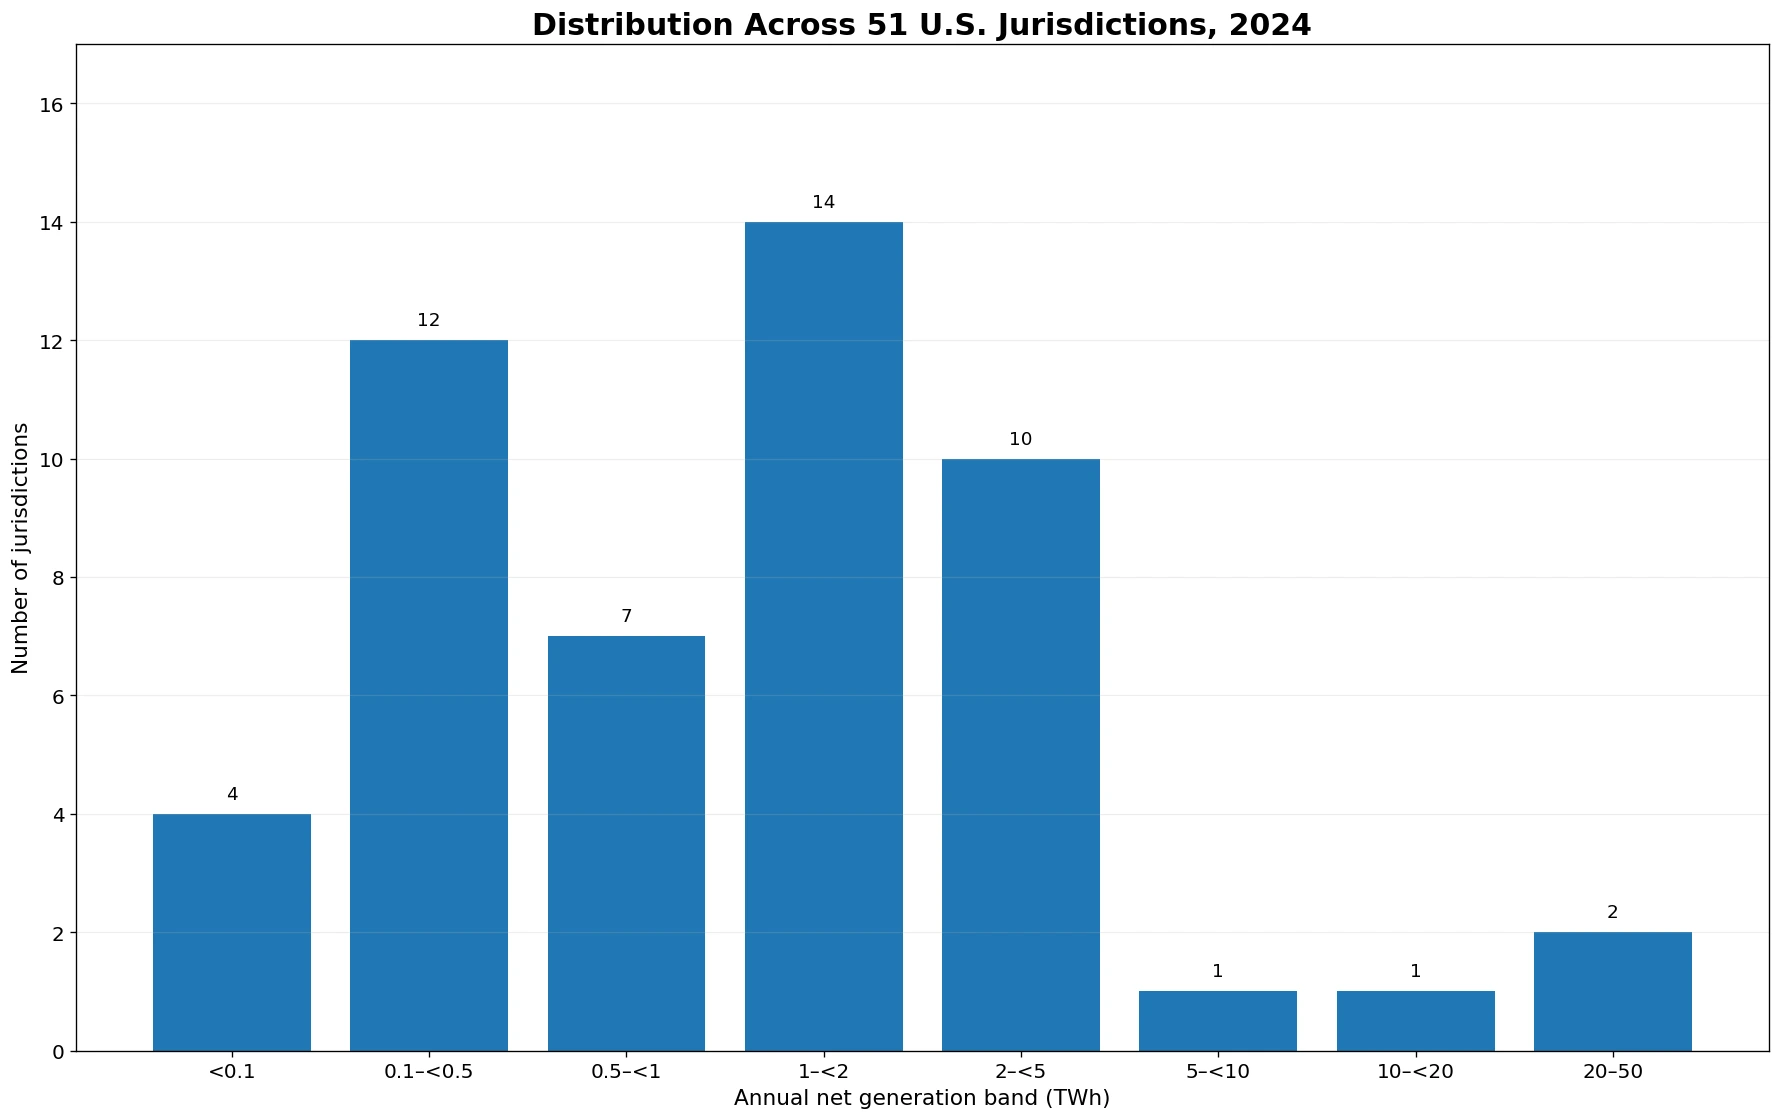
Small positive values are not zeros or missing observations
All 51 rows contain numeric 2024 observations, and none is exactly zero. Vermont is the smallest at 2,337 MWh, or about 0.0023 TWh. Montana is about 0.026 TWh, South Dakota 0.065 TWh, and New Hampshire 0.083 TWh. Washington, D.C. is also positive at roughly 0.156 TWh. Replacing these small values with zero would change their meaning from “a small amount was reported” to “no generation was reported.” The visualizations preserve the positive values and use a logarithmic color scale in the tile grid so that the lower end does not disappear next to Texas and Louisiana.
This distinction is a basic data-integrity issue. Missing means no retained numeric observation, zero means a reported numeric zero, and a small positive number is a measured amount above zero. Mixing the three can distort maps, averages, and threshold counts. The 2024 state file is particularly useful because every jurisdiction is present with the same year, so no earlier observation needs to be carried forward and no missing value needs to be imputed. The comparison can remain a clean cross-section.
This is not total state electricity generation or electricity consumption
Texas being first at 42.72 TWh does not mean this series ranks total electricity generation by state. The metric isolates generation assigned to the industrial and commercial sectors. Generation by electric utilities and independent power producers in the electric power sector is reported separately. Electricity consumption by factories, offices, stores, and other customers is also a different concept. A facility can buy far more electricity from the grid than it produces onsite, or it can generate power and transfer or sell some of it. The present measure records production under EIA’s sector classification, not the full electricity balance of each business or state.
Generation is also different from capacity. Capacity, usually expressed in MW or GW, describes the maximum output equipment can supply under specified conditions. Generation, expressed in MWh or TWh, measures energy produced over a period of time. A large generator used only occasionally can have high capacity and modest annual generation; a smaller generator operating for many hours can produce more energy over a year. The 2024 ranking is therefore an annual energy-output ranking. It should not be described as a ranking of installed industrial or commercial generating capacity.
Net generation is different from direct use
The same EIA Source and Disposition dataset includes a separate measure called Direct Use of Generation by Commercial and Industrial Facilities. That distinction is important. Net generation asks how much electricity was produced after station use, while direct use addresses how much of generated electricity was used directly by commercial and industrial facilities. Generation can be sold, transferred, or otherwise dispositioned, so the two measures do not have to match. The current series should therefore not be interpreted as the exact amount of grid purchases avoided by onsite generation. A direct-use analysis would need the direct-use field and potentially other disposition variables.
The sector label also covers a wide variety of facilities and technologies. Industrial and commercial businesses can operate combined-heat-and-power plants, electricity-only plants, and generators using different fuels. The state file used here does not break the subtotal into fuel or technology categories. As a result, it would be unsupported to say that Texas is high because of natural gas, that Louisiana is high because of one industry, or that California’s value reflects a particular renewable technology without adding separate evidence. The reliable statement is the measured level and geographic concentration of the combined industrial-and-commercial net-generation subtotal.
Southern states are prominent, but the regional total is driven by a few very large observations
Several of the highest values are in the South, including Texas, Louisiana, Alabama, Georgia, Florida, and Virginia. Using a standard four-region grouping for descriptive purposes, the 17 southern jurisdictions sum to about 100.50 TWh, or 66.1% of the 51-jurisdiction total. Yet Texas and Louisiana alone contribute roughly 70.47 TWh. That means more than two-thirds of the southern subtotal comes from those two states. The regional pattern is therefore not a uniform wall of high values; it is a region containing a few very large observations alongside many modest ones.
Explaining the pattern requires more than this cross-section. Relevant follow-up variables could include industrial composition, the number and capacity of CHP facilities, fuel type, operating hours, electricity prices, reliability requirements, and the location of large energy-intensive sites. A single-year state ranking can show where output was high, but it cannot establish why. The same caution applies to policy or climate explanations: neither appears in the 2024 generation file, so causal claims would need a separate research design.
The 152.01 TWh state sum is a sector subtotal, not U.S. total power generation
The 51 state and D.C. observations sum to 152.01 TWh. As a broad cross-check, EIA’s 2024 national electricity industry overview reports industrial-sector generation rounded to about 137 billion kWh and commercial-sector generation rounded to about 16 billion kWh, or roughly 153 TWh combined. The close agreement helps confirm the scale and unit of the state series. The figures should not be forced into exact identity because the national table is rounded and EIA products can have different release and revision timing. The state-level values remain the basis for every ranking and statistic in this article.
The conversion itself is straightforward: one million MWh equals one TWh. Texas’s 42,724,335 MWh is therefore displayed as 42.72 TWh. Converting the display unit does not change the underlying ranking or add an estimate. Sums, means, medians, quartiles, thresholds, and cumulative shares were calculated from the supplied MWh values and then presented in TWh for readability. This matters at the bottom of the distribution, where rounding too aggressively could make a small positive observation appear to be zero.
What the dataset can and cannot answer
The data can answer which states reported the most industrial-and-commercial net generation in 2024, how concentrated the subtotal was, what a typical state observation looked like, and how many jurisdictions fell into different generation bands. It cannot directly answer what fuels produced the electricity, how much the generation cost, how much was consumed onsite, how much grid electricity was displaced, what the associated CO₂ emissions were, or how much generating capacity was installed. High generation does not automatically imply high emissions because the emissions outcome depends on fuel mix, efficiency, technology, and whether thermal output is also produced in CHP systems.
The file is also a one-year cross-section, so it cannot show whether a state is rising or falling over time. A multi-year series would be needed to determine whether Texas’s level is stable, whether Louisiana has moved up or down, or whether California’s subtotal is changing structurally. A time-series extension could measure growth rates, rank changes, volatility, and turning points while keeping the sector definition consistent. This article deliberately keeps the question narrower: how the 2024 state distribution looked when every jurisdiction is compared on the same year and unit.
Data source and calculation method
The statistical source is the U.S. Energy Information Administration’s State Electricity Profiles – Source and Disposition dataset. The selected field is “Net Generation from Industrial and Commercial Sectors,” the year is 2024, and the published unit is MWh. The file contains all 50 states plus Washington, D.C., with 51 numeric observations and no missing values. Rankings and distribution statistics were calculated directly from those observations. The mean and median give every jurisdiction equal statistical weight; they are not generation-weighted national averages.
The representative tile grid uses the supplied state codes and verifies that all 51 jurisdictions are matched once. Its color scale is logarithmic only to improve visual separation across a range from 0.0023 TWh to 42.72 TWh; the labels retain the actual TWh values. The ranking chart uses the top 15 observations, the distribution chart counts jurisdictions inside fixed TWh bands, and the concentration curve accumulates values from highest to lowest. No missing value was converted to zero, no state was estimated, and no third-party ranking was substituted for the EIA observations.
Frequently Asked Questions
Which state had the most industrial and commercial sector net generation in 2024?
Texas ranked first at 42.72 TWh, followed by Louisiana at 27.74 TWh and California at 14.16 TWh.
Does this measure total electricity generation in each state?
No. It isolates net generation assigned by EIA to the industrial and commercial sectors. Total state generation includes other sectors and is a separate measure.
Is net generation the same as direct use?
No. Net generation measures electricity produced after station use, while EIA separately reports direct use of generation by commercial and industrial facilities.
Are any 2024 state values missing or exactly zero?
No. All 50 states and Washington, D.C. have numeric observations, and none is exactly zero. Vermont is the smallest positive value at about 0.0023 TWh.
Related Articles
- Natural gas share of electricity generation by country in 2021
- Coal dependence in electricity by country in 2021
- Fossil-fuel electricity share by country in 2021
Green Map creates custom-edited map images using open geographic data sources such as geoBoundaries, Natural Earth, OpenStreetMap, and government open data.
These maps are edited visual materials, not raw data files, and are provided for education, documents, presentations, and graphic reference.