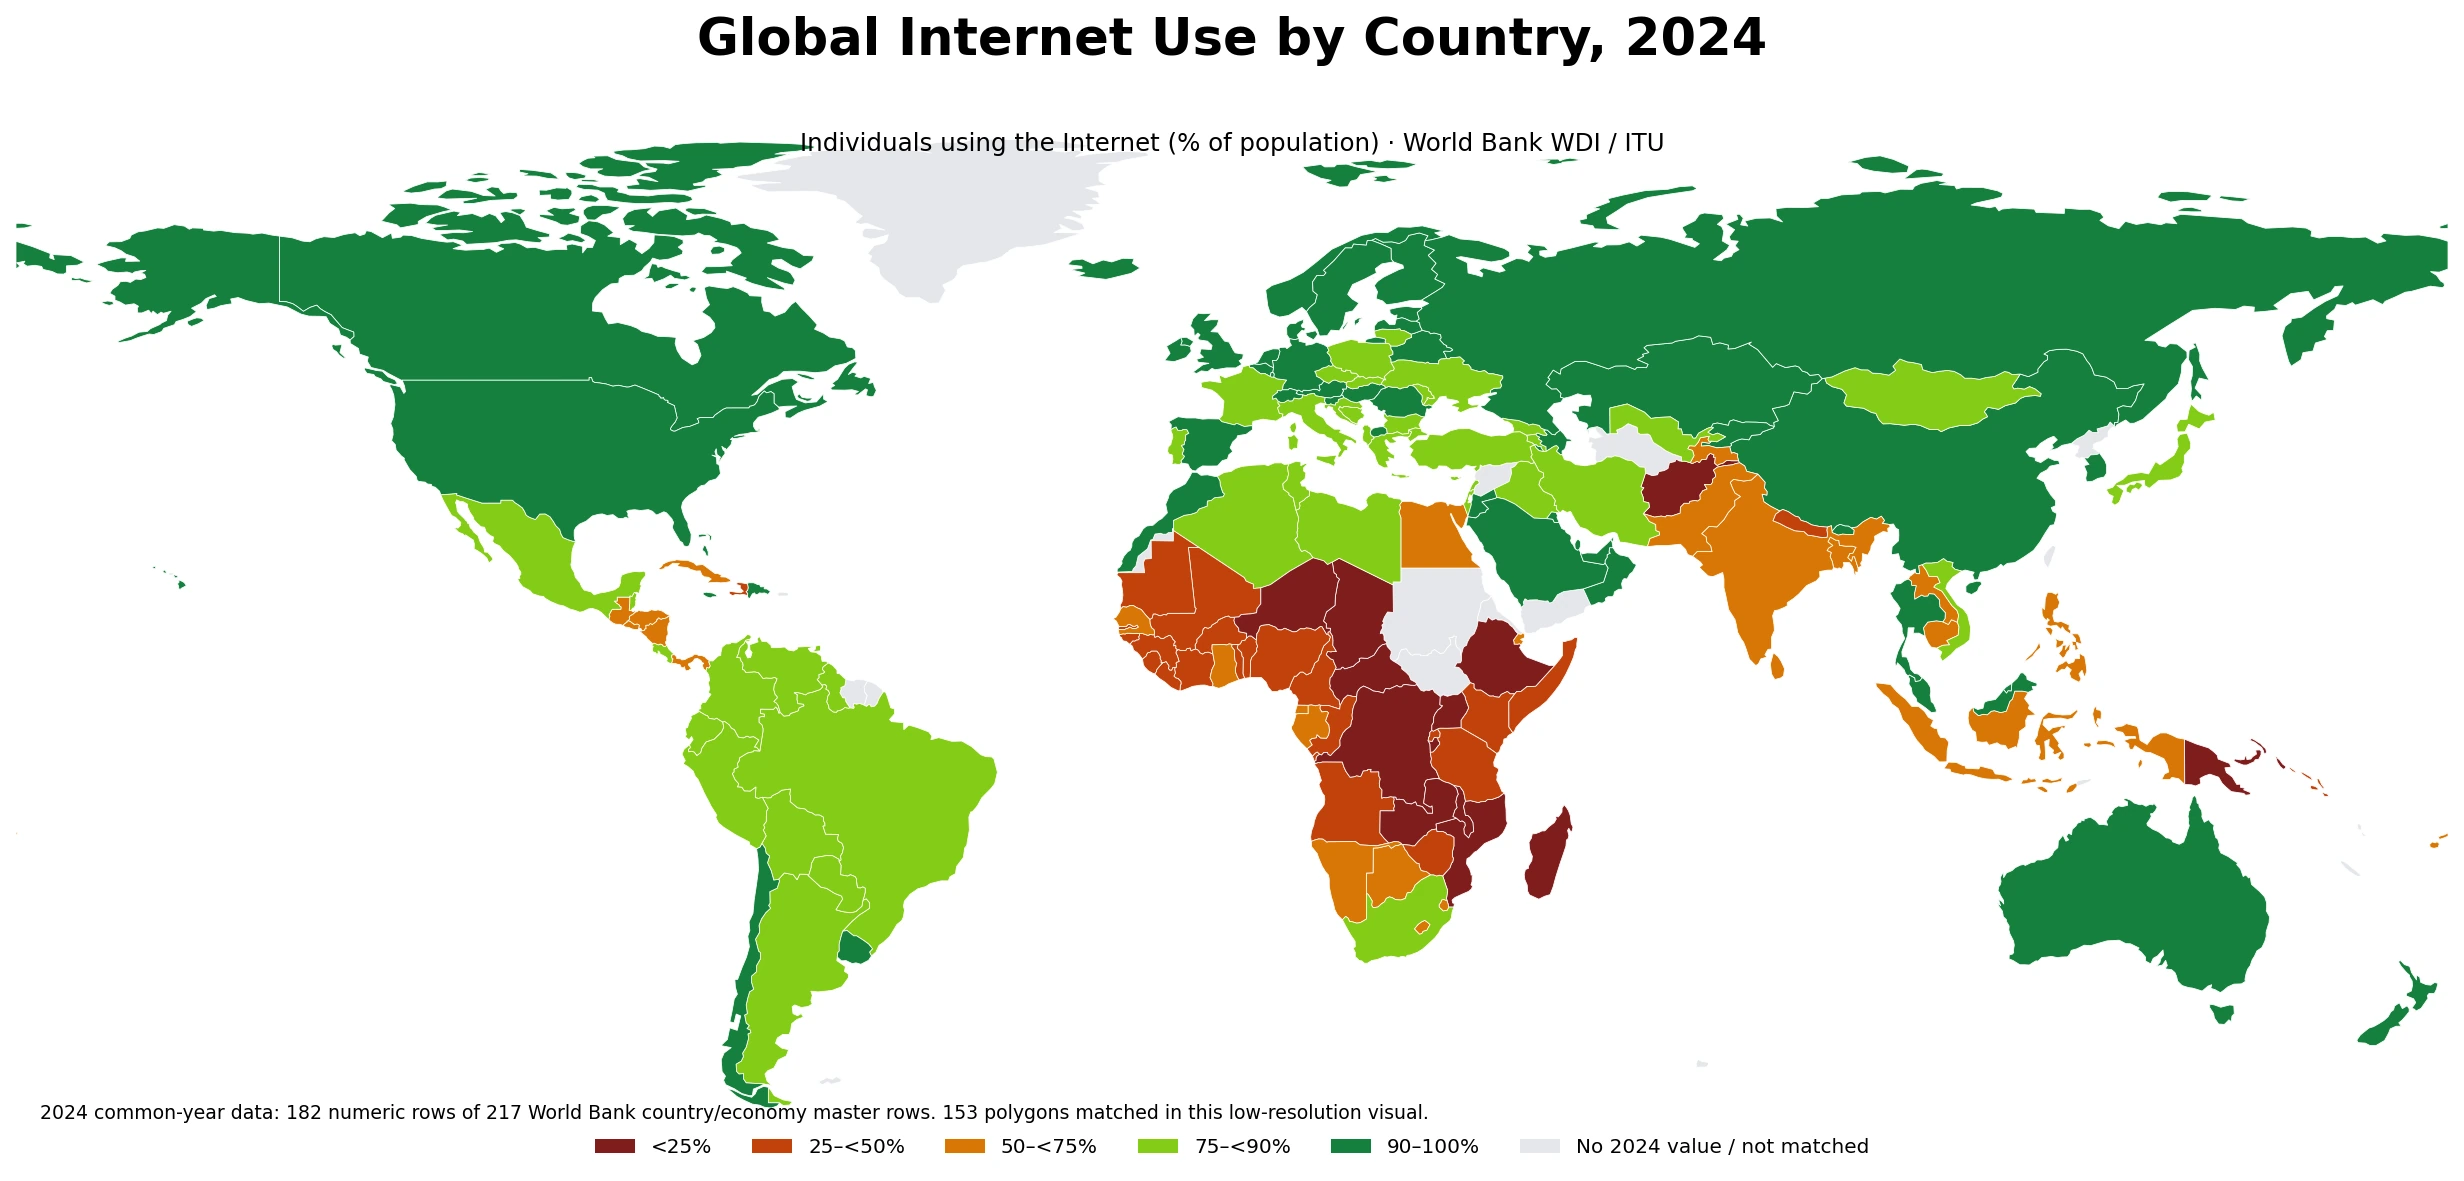
The global Internet use map compares the share of people who actually use the Internet across countries and economies. This article uses World Bank World Development Indicators series IT.NET.USER.ZS and keeps the comparison year fixed at 2024. The indicator is not a count of broadband subscriptions or smartphones. It measures individuals who used the Internet from any location during the previous three months as a percentage of the population.
The filtered World Bank table contains 217 country/economy rows after regional and income-group aggregates have been excluded. A 2024 value is present for 182 rows and missing for 35. Missing observations are preserved as NA rather than filled with an older year or an invented estimate. The 217-row scope includes separately reported territories and economies, so it should not be described as a count of sovereign states.
Map Download
Download the 2024 Internet use world map shown above as a WebP image.
Download 2024 Internet Use MapTable of Contents
What the Internet-use indicator actually measures
The World Bank metadata defines Internet users as individuals who have used the Internet from any location in the last three months. Use can occur at home, work, school, or another place, and it can involve a computer, mobile phone, or other connected device. The underlying source is the International Telecommunication Union’s World Telecommunication/ICT Indicators Database.
That definition is important because several familiar digital indicators answer different questions. Fixed-broadband subscriptions measure accounts rather than people. Mobile subscriptions can exceed population because one person can hold more than one SIM. Network coverage describes whether a service is available, while download speed describes performance. Internet use sits closer to actual adoption, but it still does not explain affordability, device ownership, digital skills, reliability, or quality of service by itself.
Why the comparison uses 2024 instead of mixing in 2025
The current WDI metadata reference period now extends through 2025, but country reporting for 2025 is not yet complete. In the latest DataBank display, India already has a 2025 observation while Afghanistan, Albania, Bangladesh, Indonesia, and many other country rows remain blank for that year. A “latest available” map would therefore combine different reference years.
This article uses 2024 as a high-coverage common year: 182 of 217 master rows have a numeric value, or 83.9%. Using one common year allows every color, ranking, and distribution statistic in this article to refer to the same period. Early 2025 values are useful for country updates, but they are not mixed into this cross-country snapshot.
The 2024 distribution shows a wide digital-use gap
Across the 182 numeric country/economy rows, the simple unweighted mean is 72.5% and the median is 82.1%. The first quartile is 59.4% and the third quartile is 92.0%, showing that the middle half of observations spans more than thirty percentage points. Thirteen observations are below 25%, 38 are below 50%, 73 are below 75%, and 127 are below 90%. Only the United Arab Emirates, Bahrain, and Saudi Arabia are reported at exactly 100.0% in this 2024 file.
| 2024 Internet-use band | Countries/economies | Share of 182 |
|---|---|---|
| 0–<25% | 13 | 7.1% |
| 25–<50% | 25 | 13.7% |
| 50–<75% | 35 | 19.2% |
| 75–<90% | 54 | 29.7% |
| 90–<100% | 52 | 28.6% |
| 100% | 3 | 1.6% |
World Bank DataBank reports a World aggregate of 71.2% for 2024. The metadata identifies weighted average as the aggregation method, so that figure should not be confused with the 72.5% simple mean across 182 observations. The World aggregate is the more appropriate number when discussing the share of the global population using the Internet. The unweighted mean and median are more useful for describing how country observations are distributed.
The lowest reported rates cluster strongly in Africa
The lowest 2024 values are Burundi 8.6%, Uganda 8.9%, Chad 12.6%, Central African Republic 13.8%, and Niger 15.6%. Afghanistan follows at 16.1%, Zambia at 17.1%, Madagascar at 18.7%, Papua New Guinea at 18.8%, Malawi at 19.0%, the Democratic Republic of the Congo at 19.7%, Mozambique at 20.5%, and Ethiopia at 21.9%. Most of the lowest observations are in Sub-Saharan Africa, but Papua New Guinea and Afghanistan show that low adoption is not confined to one region.
| Economy | 2024 Internet use |
|---|---|
| Burundi | 8.6% |
| Uganda | 8.9% |
| Chad | 12.6% |
| Central African Republic | 13.8% |
| Niger | 15.6% |
| Afghanistan | 16.1% |
| Zambia | 17.1% |
| Madagascar | 18.7% |
| Papua New Guinea | 18.8% |
| Malawi | 19.0% |
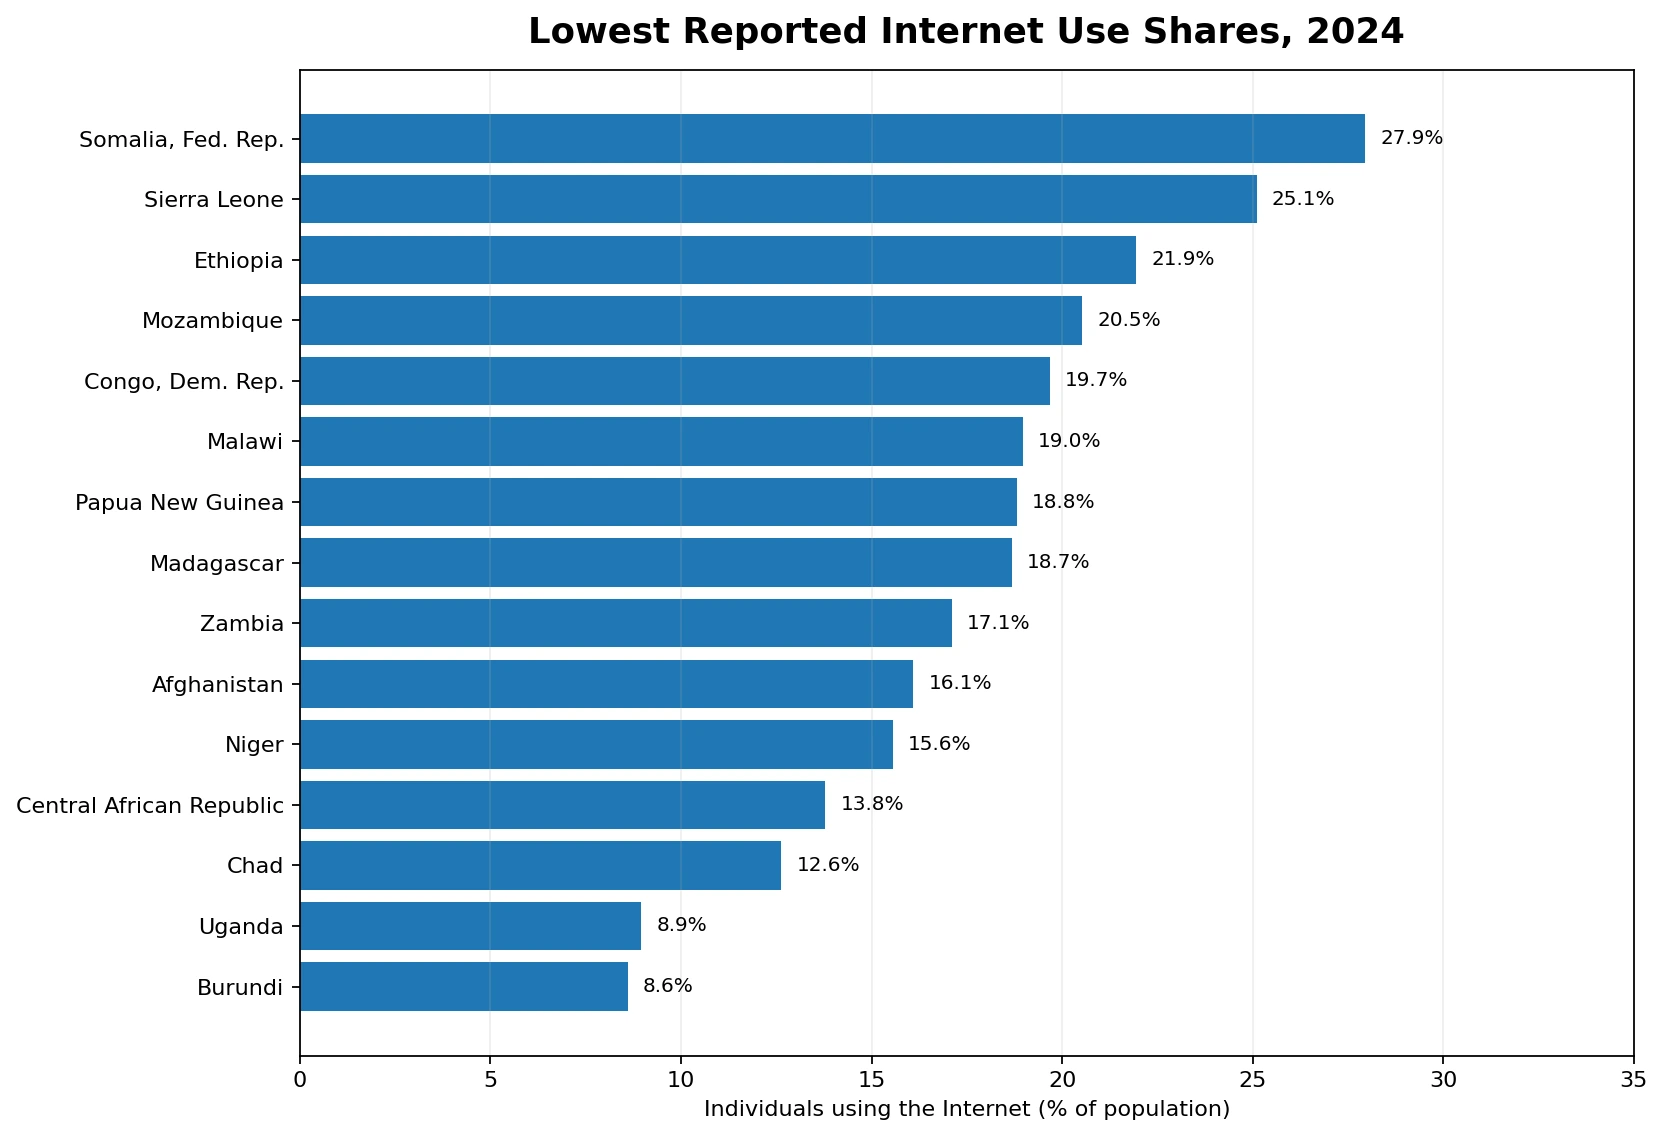
The geographic cluster does not establish a single cause. Internet adoption can be influenced by network investment, electricity access, service prices, household income, settlement patterns, education, device affordability, regulation, conflict, and many other factors. None of those explanatory variables is bundled in this dataset. The map can identify where measured use is low; explaining why requires separate country-specific evidence.
Large economies do not converge on one adoption level
Among selected large economies, Ethiopia is at 21.9%, Nigeria 41.2%, Bangladesh 53.4%, Pakistan 57.3%, India 64.9%, and Indonesia 72.8%. South Africa is 78.4%, Mexico 83.1%, Brazil 84.5%, Japan 85.5%, and France 88.7%. China is 92.0%, Germany 93.5%, Canada and the Russian Federation about 94.4%, the United States 94.7%, the United Kingdom 95.5%, Australia 96.1%, and South Korea 97.9%.
Those percentages should not be turned into a ranking of economic size, broadband speed, or digital-service quality. National survey systems and estimation methods can differ, and a few tenths of one percentage point rarely justify a strong claim that one mature digital market is meaningfully ahead of another. Broad bands—such as 90% and above, 75–90%, or below 50%—are more robust for a world map than an exact league table.
Thirty-five missing rows are not zero-use countries
The 35 rows without a 2024 value include Aruba, American Samoa, Bermuda, Eritrea, Greenland, Guam, Myanmar, North Korea, West Bank and Gaza, Puerto Rico, Sudan, South Sudan, Syria, Turkmenistan, Timor-Leste, Vanuatu, Samoa, Kosovo, and Yemen, among others. A gray area or an economy missing from the rendered geometry must not be interpreted as 0% Internet use.
Filling those rows with each economy’s most recent older observation would increase map coverage but weaken the meaning of a 2024 snapshot. This article deliberately leaves them missing. A country profile can use its latest non-null observation, but that is a different analytical task and should visibly label the year instead of silently placing an older number beside 2024 values.
Why the map and the statistical sample are not identical
The visualization joins ISO-3 codes to a low-resolution country-boundary layer. Of the 182 numeric statistical rows, 153 polygons can be directly filled in that geometry. Small economies such as Andorra, Bahrain, Singapore, Hong Kong SAR, Macao SAR, and several Caribbean and Pacific islands can have valid values without appearing as a separate polygon at this map scale.
All means, medians, threshold counts, and low-end rankings in this article use the full set of 182 numeric rows rather than only the polygons visible in the map. That separation prevents cartographic simplification from changing the statistical sample. The map is designed for spatial pattern recognition; the tables preserve the broader country/economy comparison.
Data source and interpretation rules
The statistical values come from World Bank World Development Indicators series IT.NET.USER.ZS. The WDI metadata glossary identifies the unit as percent of population, periodicity as annual, and the underlying source as the International Telecommunication Union. The metadata reference period currently extends through 2025, but this article uses only the common-year 2024 observations.
No numeric 2024 observation was altered during validation. The 35 source-missing rows remain NA, aggregate regions remain excluded, and the simple country mean is presented only as a descriptive statistic rather than a substitute for the population-weighted World aggregate. Geographic clustering is reported as a pattern in the data, not as proof of a cause or policy effect.
Frequently Asked Questions
Does this map show broadband availability or subscription rates?
No. IT.NET.USER.ZS measures individuals who used the Internet during the previous three months as a percentage of the population. Coverage, subscriptions, and speed are separate indicators.
Why does the comparison use 2024 when some 2025 values exist?
Country reporting for 2025 is still incomplete. The 2024 common-year dataset has 182 numeric observations out of 217 master rows, or 83.9%, providing broad coverage without mixing older observations into the comparison.
Is the 72.5% simple mean the global population Internet-use rate?
No. It gives each of the 182 country/economy observations equal weight. World Bank DataBank reports a 2024 World aggregate of 71.2%, and the metadata identifies weighted average as the aggregation method.
Does gray or missing map geometry mean Internet use is zero?
No. A country/economy may lack a 2024 observation or may not have a separate polygon in the low-resolution map geometry. Missing values are not converted to zero.
Related Articles
These Green Map articles provide useful context for comparing digital adoption with economic and labor indicators and for locating one of the low-use countries in the 2024 dataset.
- Global GDP Growth Map – Country Patterns in 2025
- Global Unemployment Rate Map – Country Patterns in 2025
- Ethiopia Map with Legacy Regional Boundaries
Green Map creates custom-edited map images using open geographic data sources such as geoBoundaries, Natural Earth, OpenStreetMap, and government open data. These maps are edited visual materials, not raw data files, and are provided for education, documents, presentations, and graphic reference.