Where do internationally mobile students from Nigeria study? UNESCO Institute for Statistics (UIS) indicator 26458 provides a destination-country view of that question. Each row reports the number of internationally mobile students from Nigeria recorded by a destination in 2023. The word inbound is from the destination’s perspective: it is not a count of foreign students entering Nigeria. Reading the direction correctly is essential because reversing it would turn the indicator into a completely different migration flow.
The 77 reported destinations sum to about 137,909 students. That sum should be described as the total across these 77 observations, not as a definitive worldwide total for all Nigerian students abroad. The United Kingdom is by far the largest reported destination at 71,756 students, or 52.0% of the 77-destination sum. The United States reports 16,631.7 and Canada 12,072; together, the top three account for 72.8%.
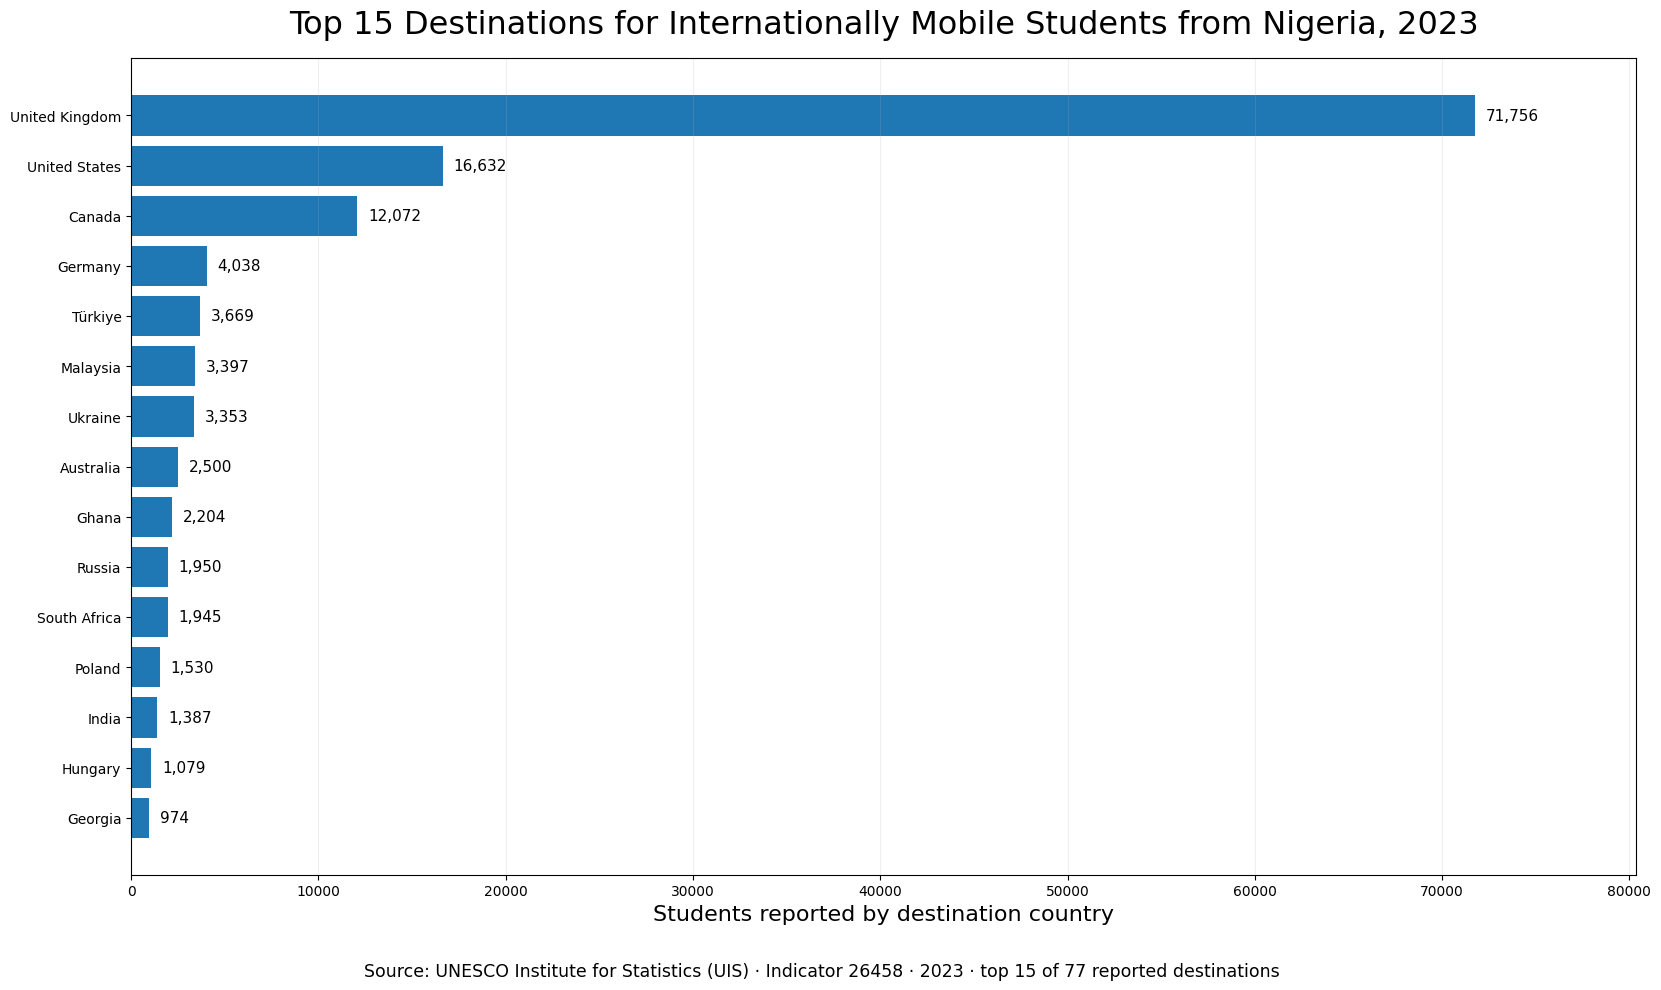
Table of Contents
“Inbound” is measured from the destination-country perspective
International education statistics can describe the same movement from an origin or destination perspective. In this series, the destination reports students whose origin is Nigeria. The United Kingdom value therefore means internationally mobile students from Nigeria recorded in the United Kingdom. It does not mean British students studying in Nigeria, and it does not measure foreign students entering Nigerian institutions.
The measure is also not identical to student-visa issuances, the stock of Nigerian-born migrants, all Nigerians living overseas, scholarship recipients, or every person who studies temporarily outside Nigeria. UIS applies its own statistical definition of internationally mobile students. Other administrative systems can legitimately produce different numbers because their populations, timing, and reporting rules are different.
The United Kingdom alone accounts for more than half of the reported total
The United Kingdom reports 71,756 students in 2023, equal to 52.03% of the sum across the 77 destinations. The other 76 observations combined total about 66,153, which is less than the UK value by itself. This is not a distribution in which each destination receives a similar number of Nigerian students; one destination clearly dominates the reported count.
The concentration should not be converted into a one-factor explanation. Language, tuition, visa policy, colonial history, university capacity, labor-market expectations and social networks could all be relevant research questions, but none of those explanatory variables is contained in this dataset. The defensible conclusion here is descriptive: the UK reports far more Nigerian internationally mobile students than any other destination in the 2023 observations.
The United States and Canada lift the top-three share to 72.8%
The United States reports 16,631.7 students, or 12.06% of the 77-destination sum. Canada reports 12,072, or 8.75%. Adding those two to the United Kingdom produces 100,459.7 students and a combined share of 72.85%.
If Australia is added, the four English-speaking destinations total about 102,960 students, or 74.66% of the reported sum. That pattern is notable, but it still does not prove that language is the reason students choose those destinations. Germany, Türkiye, Malaysia, Ukraine and several other non-English-speaking destinations also appear high in the table, reinforcing the need to separate a visible distribution pattern from a causal claim.
The top 10 destinations account for 88.2%
The top five destinations account for 78.43% of the 77-destination sum. Expanding to the top 10 raises the share to 88.15%, and the top 15 reach 93.17%. The remaining destinations therefore form a long tail of much smaller counts. A list of 77 country rows may look geographically broad, but most of the reported students are concentrated in a comparatively small group.
The skew also appears in the summary statistics. The simple mean is about 1,791.0 students per destination, while the median is only 120. The first quartile is 18 and the third quartile 541. A few very large destinations pull the mean upward, so the median and concentration shares describe a typical destination more clearly than the average alone.
Fourteen destinations report at least 1,000 students
Among the 77 observations, 14 destinations report at least 1,000 students, 20 report at least 500, and 43 report at least 100. At the other end, 13 destinations report fewer than 10. The spread is so wide that a single linear-color world map could make most of the middle and lower values difficult to distinguish, which is why the main visualization uses a ranked bar chart.
A small destination count should not be treated as evidence that the destination is unimportant. A small flow may matter greatly to a specific institution, field of study or student network. This dataset simply does not contain those institutional details. It is more appropriate to preserve the small counts as observed facts than to invent an explanation for why they are small.
Selected destination observations for 2023
| Destination | Students | Share of 77-destination sum |
|---|---|---|
| United Kingdom | 71,756 | 52.03% |
| United States | 16,631.7 | 12.06% |
| Canada | 12,072 | 8.75% |
| Germany | 4,038 | 2.93% |
| Türkiye | 3,669 | 2.66% |
| Malaysia | 3,397 | 2.46% |
| Ukraine | 3,353 | 2.43% |
| Australia | 2,500 | 1.81% |
| Ghana | 2,204 | 1.60% |
| Russia | 1,950 | 1.41% |
| South Africa | 1,945 | 1.41% |
| Poland | 1,530 | 1.11% |
| India | 1,387 | 1.01% |
| Hungary | 1,079 | 0.78% |
| Georgia | 974 | 0.71% |
| Finland | 890 | 0.65% |
| France | 785.1 | 0.57% |
| Republic of Korea | 303 | 0.22% |
The percentage column is calculated using the sum of the 77 reported destination values as the denominator. It is not a separate official UIS market-share indicator and it should not be read as a complete global share if destinations are missing from this extract. Some source values contain decimals; those values are retained for calculations and rounded only for readable display.
The Republic of Korea reports 303 students in 2023, about 0.22% of the 77-destination sum. It is one observation within the broader destination distribution rather than a separate organizing focus of the comparison.
The reported total of about 137,909 is not necessarily a worldwide total
Adding the 77 available rows gives 137,908.6. That number is useful for calculating concentration within the supplied dataset, but calling it “the total number of Nigerian students abroad worldwide” would overstate the evidence. The extract contains 77 destination observations; other destinations may be absent, unreported, outside the source coverage, or unavailable for the reference year.
For the same reason, a destination not listed here is not assigned zero. A reported zero and a missing observation are different statistical statements. No missing destinations are inserted into the ranking, and no missing values are used to enlarge the low end of the distribution. All counts and shares in this article refer to the non-missing destination rows that are actually present.
Counts measure destination volume, not a pure preference rate
This indicator is a number of students, not a percentage of all Nigerian students and not a rate standardized for the size of the destination’s higher-education system. Large host systems can record more students partly because they have more institutions or more international capacity. A country with twice as many students is not automatically twice as attractive to every prospective student.
A more standardized comparison would need an appropriate denominator: for example, Nigerian students as a share of all international students in the destination, or destination counts relative to the size of the education system. Those are different indicators. The strength of this UIS series is that it directly shows the absolute volume reported at each destination.
A 2023 cross-section cannot establish a trend
Every row in the supplied dataset is dated 2023. The common reference year improves comparability across destinations, but it does not show whether flows rose or fell over time. The fact that the United Kingdom is the largest destination in 2023 does not by itself show that the UK count increased from 2022, nor can the table identify a recent acceleration or decline.
Trend analysis would require the same UIS indicator for multiple years, preferably with stable destination coverage and comparable reporting. Without that time series, words such as “surge,” “drop,” “growth,” or “decline” would introduce information that is not contained in the data. The safest interpretation is a same-year snapshot of where the reported students were recorded.
The broad concentration pattern matters more than tiny rank differences
The strongest features of the dataset are large: 52.0% in the United Kingdom, 72.8% in the top three destinations, and 88.2% in the top 10. Small rank differences farther down the list are much less informative. Some source observations contain decimal values, and neighboring destinations can be separated by modest counts, so an exact ordinal ranking should not be confused with a measure of destination quality.
A ranking here means only “more reported students than the next destination.” It says nothing directly about university quality, employment opportunities, visa convenience, affordability, student satisfaction or academic outcomes. Each of those questions requires its own data. Keeping the interpretation narrow prevents a useful mobility count from being stretched into claims it was never designed to support.
Data source and calculations
The destination values come from UNESCO Institute for Statistics public API indicator 26458 for 2023. The official metric is “Inbound internationally mobile students from Africa: Students from Nigeria, both sexes (number).” The values are direct counts published in the source. The total, median, quartiles, destination shares and concentration measures in this article are calculated from the 77 non-missing rows.
No population weights or rate transformations are applied. A few source values are fractional; calculations retain the source values rather than forcing them to integers, while visual labels are rounded for readability. Missing destinations are not filled with zero. Because the dataset contains destination counts but no explanatory variables, the article reports geographic concentration without assigning causes to it.
Frequently Asked Questions
Does “inbound” mean international students entering Nigeria?
No. It is measured from each destination’s perspective and counts internationally mobile students from Nigeria recorded in that destination.
Which destination reports the largest number in 2023?
The United Kingdom is largest at 71,756 students, about 52.0% of the sum across the 77 reported destinations.
Is the sum across 77 destinations the worldwide total for Nigerian students abroad?
No. It is the sum of the 77 available destination observations. Destinations without an observation are not treated as zero.
Can these counts explain why students choose the United Kingdom or other destinations?
No. The indicator reports destination counts but does not contain explanatory variables such as visa policy, tuition, language, institutional capacity or student preferences.
Related Articles
- Post-Secondary Attainment for Adults 25+
- Bachelor’s-or-Higher Educational Attainment by Country
- Government Education Spending as a Share of GDP
Green Map creates custom-edited map images using open geographic data sources such as geoBoundaries, Natural Earth, OpenStreetMap, and government open data.
These maps are edited visual materials, not raw data files, and are provided for education, documents, presentations, and graphic reference.