The gender mix of internationally mobile students from Germany is not the same in every destination. UNESCO Institute for Statistics (UIS) data for 2022 report an adjusted gender parity index, or GPIA, for 70 countries and areas receiving mobile students whose origin is Germany. The index does not measure the total number of German students abroad. Instead, it summarizes the relative female and male values on a symmetric scale centered on 1. Values near 1 indicate gender parity, values above 1 mean the female value is higher, and values below 1 mean the male value is higher. The useful question, therefore, is not “Which destination has the most German students?” but “How different is the gender balance among German mobile students across reported destinations?”
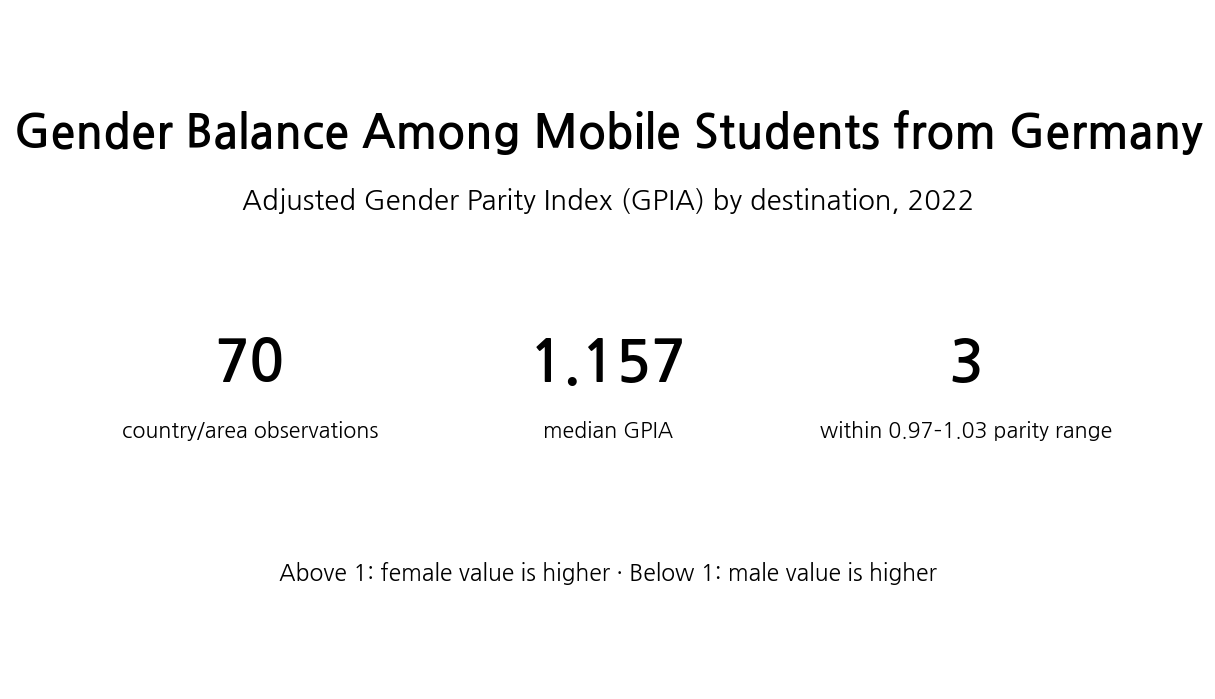
Table of Contents
What this indicator measures
The official UIS indicator is E.5T8.FOREIGN.ORG276.GPIA, titled “Inbound internationally mobile students from Europe: Students from Germany, adjusted gender parity index (GPIA).” The word “inbound” is from the perspective of each destination. It does not mean students entering Germany. Each observation refers to the gender parity measure among internationally mobile students from Germany recorded in a destination country or area. The metric is therefore an origin-to-destination education mobility indicator with a gender dimension.
A conventional gender parity index divides the female value of an indicator by the male value. That simple ratio is not symmetric around 1. If the female value is half the male value, the ratio is 0.5; if the positions are reversed, the ratio becomes 2. The adjusted GPI used by UIS corrects that asymmetry. When the female-to-male ratio is at or below 1, the adjusted value is the same as the ordinary ratio. When the ratio is above 1, UIS applies an inverse transformation so that the scale is bounded between 0 and 2 and becomes symmetric around parity. UIS commonly interprets values from 0.97 to 1.03 as gender parity.
The 2022 distribution
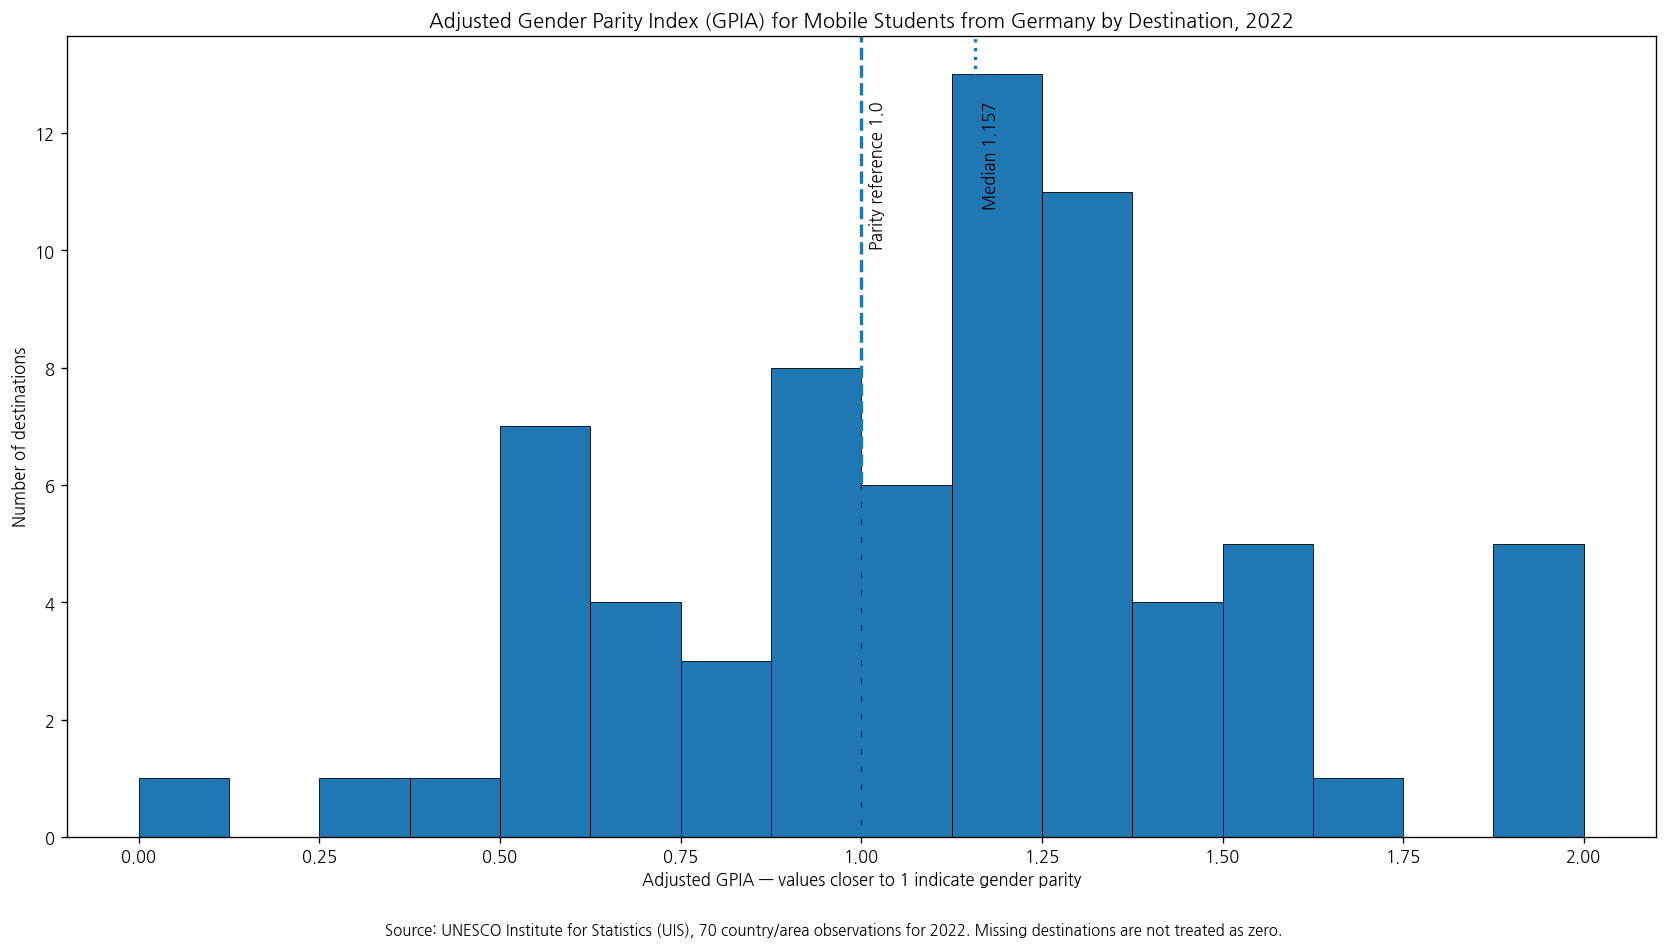
The 2022 cross-section contains 70 country or area observations. The median adjusted GPIA is 1.157, while the mean is 1.122. The first quartile is 0.887 and the third quartile is 1.348, placing the middle half of observations within that interval. Only 3 destinations fall inside the commonly used 0.97–1.03 parity range. Another 43 are above 1.03, indicating a higher female value, while 24 are below 0.97, indicating a higher male value. This is a description of the reported destinations, not a global estimate of the gender composition of all German students studying abroad.
The distribution also needs to be read separately from student volume. A destination with thousands of German mobile students and a destination with only a small number can each contribute one GPIA value. When counts are small, a difference of only a few students can produce a large movement in a parity index. The source dataset used here does not include the underlying female and male counts alongside this indicator, so it is not possible to judge the size of the population behind every extreme value. Large departures from 1 are best treated as signals of an imbalanced reported composition, not as evidence that the destination itself is a major student market.
Destinations with higher female values
Values above 1 indicate that the female indicator value is higher than the male value. El Salvador, Rwanda, Tunisia, San Marino and Bahrain each report the upper-bound value of 2.000 in this 2022 dataset. Iceland follows at 1.680, Chile at 1.568, Namibia at 1.556 and the United Republic of Tanzania at 1.538. The Republic of Korea is recorded at 1.523. These observations show a clear direction of gender imbalance, but the adjusted scale must not be mistaken for a direct headcount ratio.
| Destination | Adjusted GPIA |
|---|---|
| El Salvador | 2.000 |
| Rwanda | 2.000 |
| Tunisia | 2.000 |
| San Marino | 2.000 |
| Bahrain | 2.000 |
| Iceland | 1.680 |
| Chile | 1.568 |
| Namibia | 1.556 |
| United Republic of Tanzania | 1.538 |
| Republic of Korea | 1.523 |
| Qatar | 1.500 |
| Luxembourg | 1.480 |
An adjusted GPIA of 2.000 does not mean that there are exactly twice as many women as men. Above parity, the adjusted formula is deliberately transformed and capped at 2 so that disparities on the female-higher side can be compared more symmetrically with disparities on the male-higher side. Without the underlying sex-disaggregated counts, the exact female-to-male student ratio cannot be reconstructed reliably from a rounded adjusted value at the upper bound. This is particularly important for smaller destinations, where a very small male count could produce a value close to the maximum.
Destinations with higher male values
Values below 1 indicate a higher male value. Saudi Arabia has the lowest observation at 0.082, followed by Thailand at 0.308 and Belarus at 0.417. The Republic of Moldova and Uzbekistan are both at 0.500, while Malta is at 0.539, Mauritius at 0.571, Hong Kong SAR at 0.581, Malaysia at 0.581 and Serbia at 0.611. These values show the direction and relative distance from parity. They do not show how many German students are enrolled in those destinations.
| Destination | Adjusted GPIA |
|---|---|
| Saudi Arabia | 0.082 |
| Thailand | 0.308 |
| Belarus | 0.417 |
| Republic of Moldova | 0.500 |
| Uzbekistan | 0.500 |
| Malta | 0.539 |
| Mauritius | 0.571 |
| China, Hong Kong Special Administrative Region | 0.581 |
| Malaysia | 0.581 |
| Serbia | 0.611 |
| Japan | 0.706 |
| Slovakia | 0.712 |
Destinations closest to gender parity
Values nearest 1 indicate the smallest gender difference on this measure. Ghana and North Macedonia are both reported at exactly 1.000, while South Africa is at 0.988 and therefore falls within the common UIS parity band. Romania, at 0.959, and India, at 1.053, are just outside that band. A value near 1 does not imply that a destination hosts many students; it only indicates that the female and male indicator values are similar relative to each other.
| Destination | Adjusted GPIA |
|---|---|
| Ghana | 1.000 |
| North Macedonia | 1.000 |
| South Africa | 0.988 |
| Romania | 0.959 |
| India | 1.053 |
| Bulgaria | 0.933 |
Why use an adjusted gender parity index?
The main analytical benefit of GPIA is comparability around the parity point. With an ordinary female-to-male ratio, a value of 0.5 and a value of 2 represent opposite directions but appear at very different numeric distances from 1. The adjusted method keeps the lower side unchanged while transforming values above 1 so that equivalent proportional differences are shown at similar distances from parity. This makes cross-destination visual comparison easier and prevents the female-higher side from expanding without an upper bound.
The adjusted index is still a narrow measure. It does not identify why a gender imbalance exists, whether the students are in undergraduate, graduate, exchange or other programs, what subjects they study, how long they remain abroad, or whether admission and completion patterns differ. It also does not measure gender equality in the destination’s higher education system as a whole. It only describes the relative female and male values for one specific group: internationally mobile students originating from Germany.
What can and cannot be inferred
- Supported interpretation: the direction and relative size of the gender imbalance among mobile students from Germany in each reported destination in 2022.
- Not supported by this indicator alone: destination headcounts, exact female and male counts, the overall gender composition of all German students abroad, or causal explanations for the differences.
- Coverage rule: only the 70 reported country/area observations are analyzed; destinations without observations are not converted to zero.
Because this is a single-year cross-section, it also cannot establish a trend. A destination may have a high or low GPIA in 2022 because of a persistent pattern or because of a temporary cohort effect. Determining direction over time would require the same indicator for multiple years and, ideally, the underlying sex-disaggregated counts. A cross-section is useful for locating differences, but it should not be used to claim that a destination is becoming more or less balanced without longitudinal evidence.
Source and interpretation rules
The source is the UNESCO Institute for Statistics national-level indicator E.5T8.FOREIGN.ORG276.GPIA for 2022. The analysis uses the 70 reported observations as published and does not replace missing destinations with zero. The adjusted GPIA is centered on 1, with 0.97–1.03 commonly treated by UIS as a parity range. Values above 1 indicate a higher female value and values below 1 indicate a higher male value. For this indicator, a higher number is not inherently better and a lower number is not inherently worse; the important feature is the distance and direction from parity.
Bottom line
Across the 70 reported destinations in 2022, adjusted GPIA values for internationally mobile students from Germany range from 0.082 to 2.000, with a median of 1.157. Only 3 destinations fall in the 0.97–1.03 parity range, while 43 are above 1.03 and 24 are below 0.97. The dataset therefore shows substantial variation in gender balance across destinations. At the same time, the absence of underlying student counts means the index should be used to compare balance, not to rank destinations by market size or to explain why the differences exist.
Frequently Asked Questions
What does an adjusted GPIA of 1 mean?
It means the female and male indicator values are equal. UIS commonly treats 0.97–1.03 as a gender-parity range.
Does a GPIA of 2.0 mean there are twice as many female students?
No. Values above 1 are transformed onto a symmetric 0–2 adjusted scale, so 2.0 is not a simple two-to-one headcount ratio.
Can this dataset show which destination has the most students from Germany?
No. It reports a gender parity index, not total student counts or the separate female and male headcounts for each destination.
Can the index explain why destinations have different gender balances?
No. Explaining the differences would require additional evidence on factors such as programs, fields of study, costs, visas, language and labor-market conditions.
Related Articles
- Post-Secondary Attainment for Adults 25+
- Bachelor’s-or-Higher Educational Attainment by Country
- Government Education Spending as a Share of GDP
Green Map creates custom-edited map images using open geographic data sources such as geoBoundaries, Natural Earth, OpenStreetMap, and government open data.
These maps are edited visual materials, not raw data files, and are provided for education, documents, presentations, and graphic reference.