The World Bank has latest non-null observations for 186 countries and separately reported economies for indicator SE.SEC.CUAT.PO.ZS, but the reference years stretch from 1975 to 2024. To avoid presenting decades-old observations as if they were current, the main map and comparison tables on this page use only the 125 observations dated 2020–2024. Those recent rows represent 67.2% of the full latest-value package.
Across this recent subset, the median is 25.6%. The Russian Federation has a 2021 observation of 76.3%, Canada a 2024 value of 68.8%, and Ireland a 2023 value of 63.3%. These are useful recent observations, but because the reference years differ, they are not a clean 2024 league table.
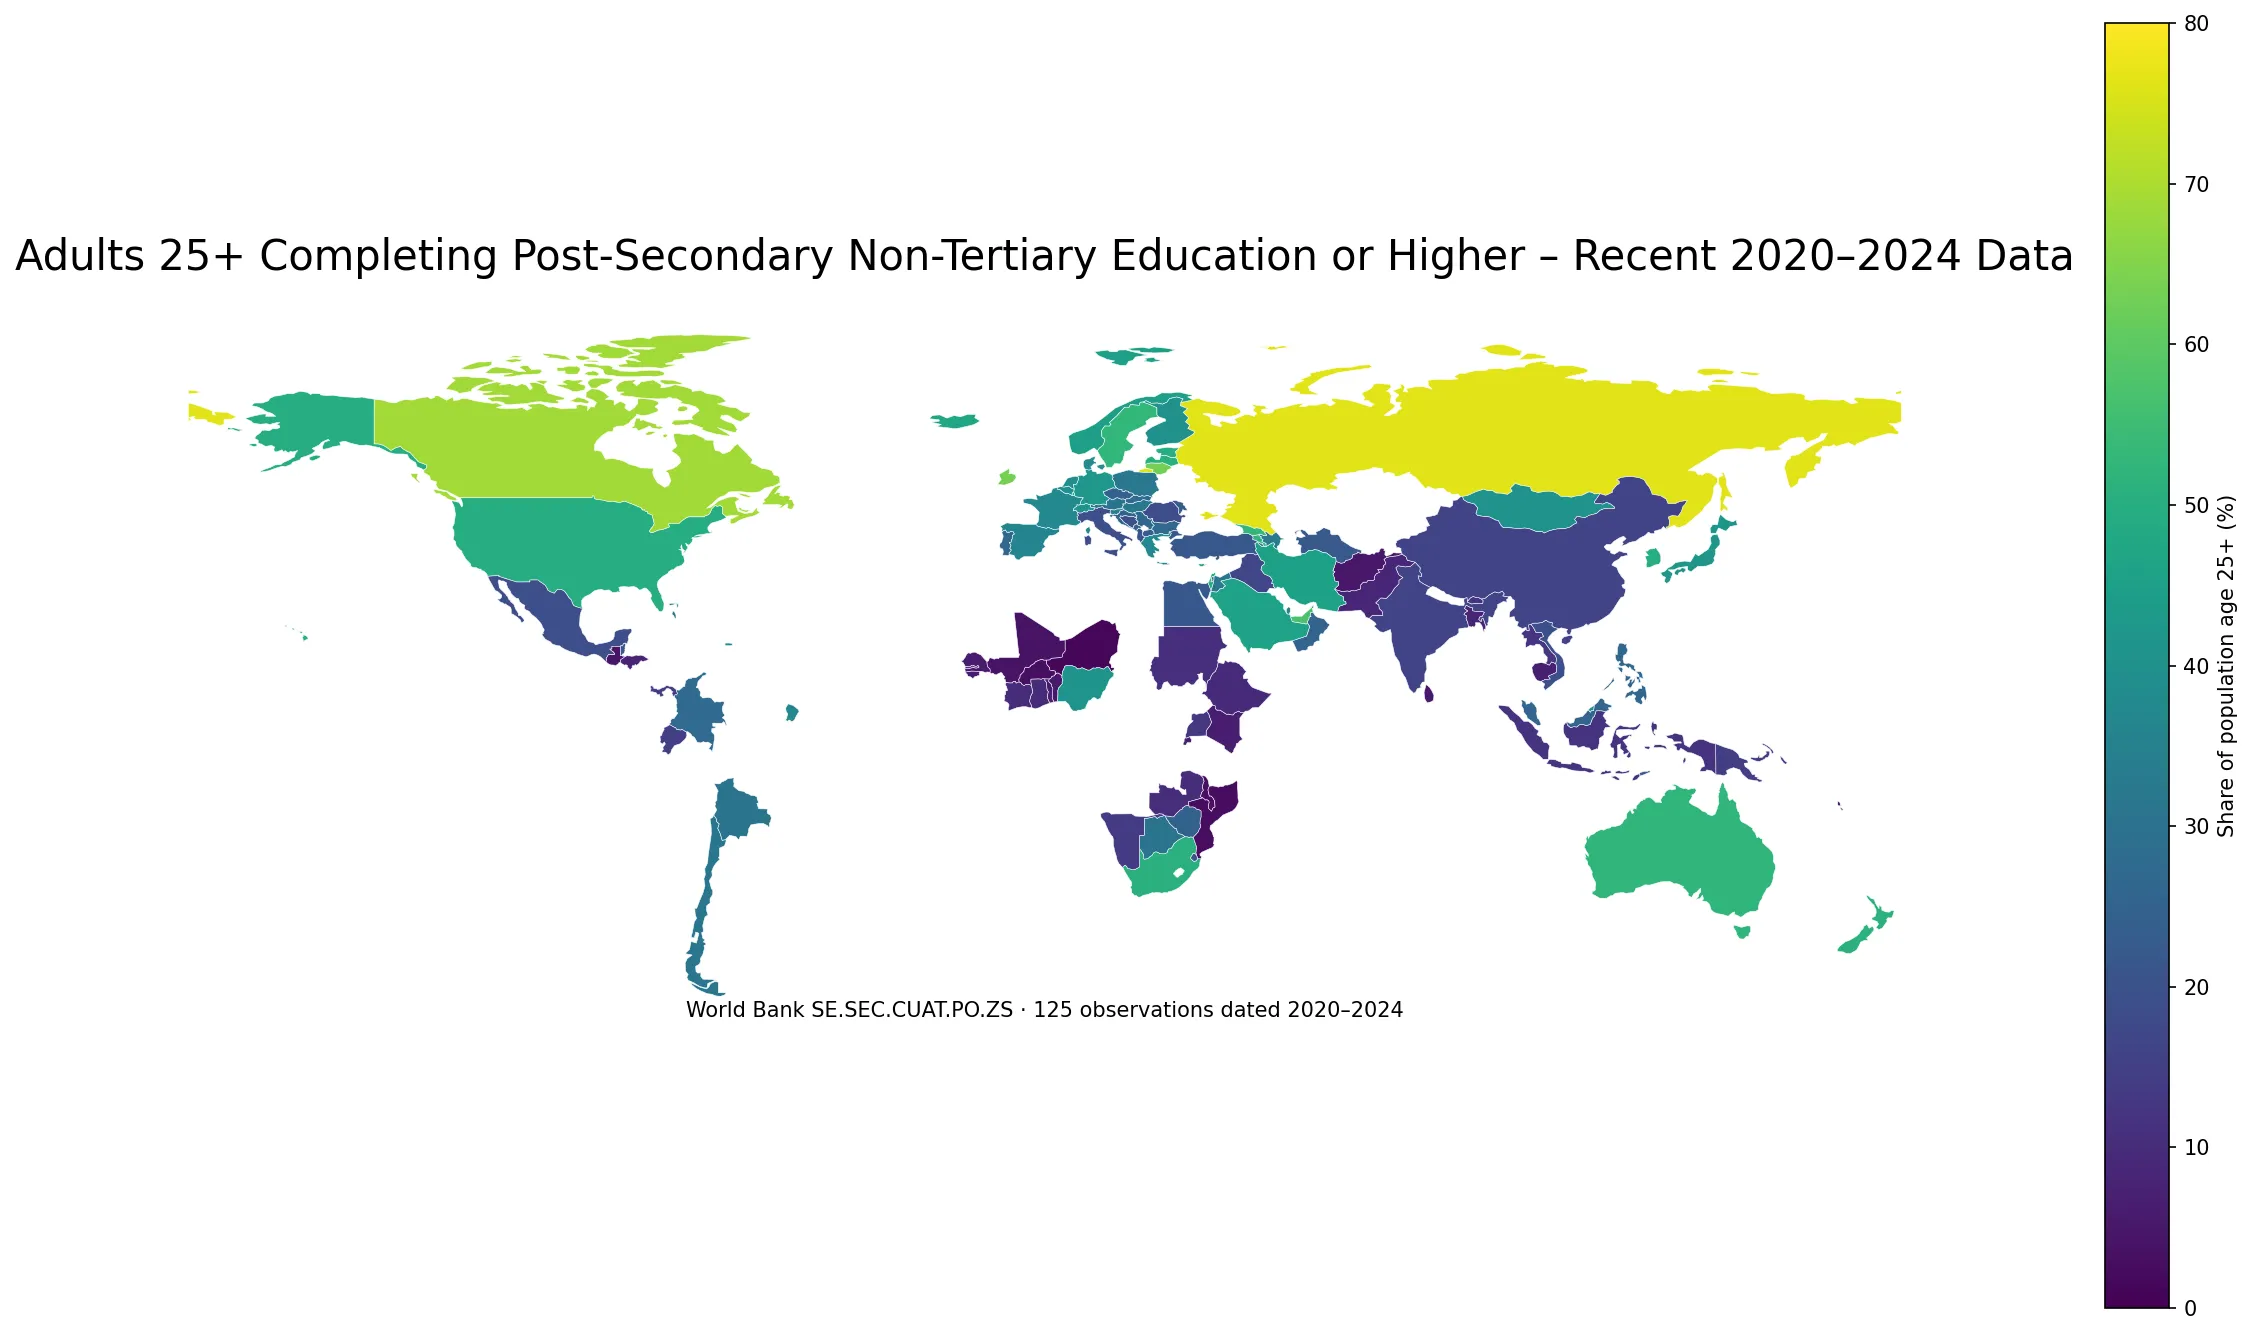
Table of Contents
The indicator measures adults 25+ who have completed post-secondary non-tertiary education or a higher level
The official series is World Bank SE.SEC.CUAT.PO.ZS, titled Educational attainment, at least completed post-secondary, population 25+, total (%) (cumulative). The World Bank defines it as the percentage of the population age 25 and older that has attained or completed post-secondary non-tertiary education, using data from the UNESCO Institute for Statistics.
UNESCO UIS defines ISCED level 4 as post-secondary non-tertiary education: learning that follows upper-secondary education and can prepare people for labour-market entry or progression to tertiary education, while remaining below the complexity of tertiary education. Programs and credentials vary across national systems, so the international level should not be treated as an exact synonym for one specific diploma in every country.
The phrase “at least” is essential. Adults who completed this post-secondary non-tertiary threshold and adults who continued into short-cycle tertiary, bachelor’s, master’s or doctoral education all meet the threshold. A 50% value therefore means about half of adults age 25+ have reached this level or higher, not that half completed exactly one particular type of program.
Only 21 observations are from 2024, so the package cannot support a 2024 country ranking
The full package keeps one latest non-null observation per economy. Only 21 of those recent values are dated 2024. There are 51 observations from 2023, 29 from 2022, 14 from 2021, and 10 from 2020. Together, the five-year window contains 125 observations.
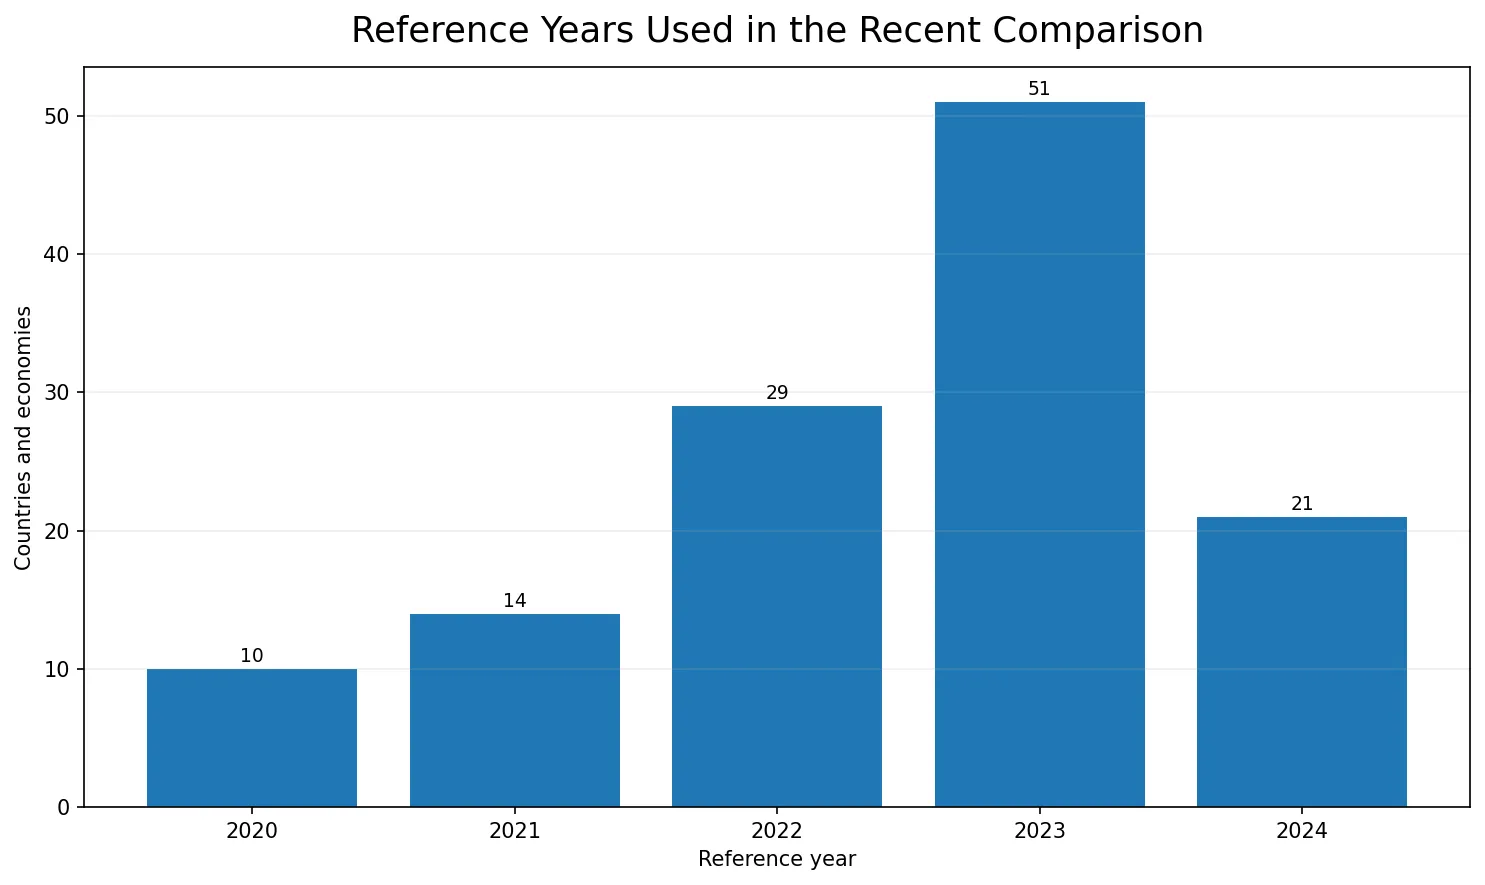
The remaining 61 latest-value rows are dated 2019 or earlier, with the oldest extending back to 1975. Adult educational attainment generally changes more slowly than a monthly economic statistic, but an observation from decades ago can still be a poor description of the current adult population. That is why those rows are excluded from the current comparison rather than silently mixed into the map.
The recent-country median is 25.6%, and 13 observations reach 50% or more
The unweighted mean across the 125 recent observations is 27.5% and the median is 25.6%. The first quartile is 14.2% and the third quartile 39.4%. 23 observations are below 10% and 47 below 20%, while 52 are at 30% or above, 31 at 40% or above, and 13 at 50% or above.
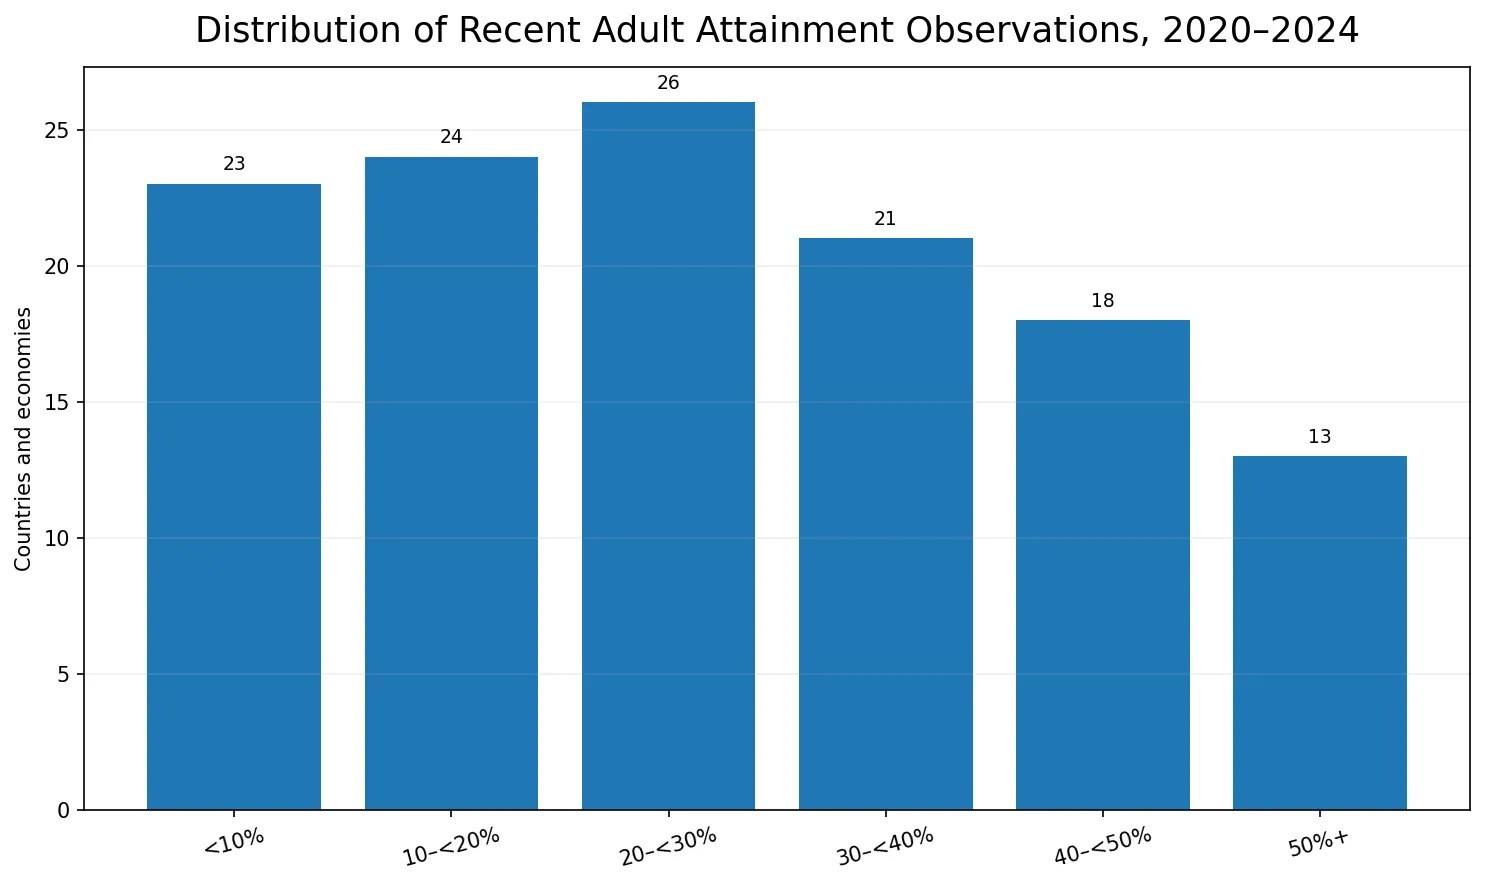
| Attainment range | Countries/economies | Share of 125 |
|---|---|---|
| <10% | 23 | 18.4% |
| 10–<20% | 24 | 19.2% |
| 20–<30% | 26 | 20.8% |
| 30–<40% | 21 | 16.8% |
| 40–<50% | 18 | 14.4% |
| 50%+ | 13 | 10.4% |
These summary statistics are not population-weighted global rates. Canada, the United States, Singapore and a small island economy each contribute one row to the median and simple mean. The median is useful for describing the distribution of reporting economies, but it should not be converted into a statement that 25.6% of the world’s adults have reached this level.
The highest recent observations include the Russian Federation, Canada, Ireland, Lithuania and Singapore
Within the 2020–2024 window, the Russian Federation reports 76.3% in 2021, Canada 68.8% in 2024, Ireland 63.3% in 2023, Lithuania 63.2% in 2023, and Singapore 63.1% in 2022. The United Arab Emirates is 57.0% in 2024, while Georgia, Sweden, Armenia and Australia are all around 52–53%.
| Country or economy | Reference year | Adults 25+ at the threshold or higher |
|---|---|---|
| Russian Federation | 2021 | 76.3% |
| Canada | 2024 | 68.8% |
| Ireland | 2023 | 63.3% |
| Lithuania | 2023 | 63.2% |
| Singapore | 2022 | 63.1% |
| United Arab Emirates | 2024 | 57.0% |
| Georgia | 2024 | 52.9% |
| Sweden | 2023 | 52.5% |
| Armenia | 2023 | 52.5% |
| Australia | 2024 | 52.4% |
| New Zealand | 2020 | 51.1% |
| Latvia | 2023 | 50.7% |
The table is deliberately labeled as recent observations rather than a synchronized ranking. A two- or three-point difference should not be presented as evidence that one education system is definitively better when the underlying years differ.
The lowest recent observations also need their dates attached
Niger is at 1.4% in 2022, Mozambique 2.7% in 2022, Burkina Faso 3.0% in 2024, Malawi 3.0% in 2020, and Mali 3.9% in 2022. Guatemala is 4.2% in 2023, Afghanistan 4.7% in 2021, Sri Lanka 5.1% in 2022, and Benin 5.2% in 2022.
| Country or economy | Reference year | Adults 25+ at the threshold or higher |
|---|---|---|
| Niger | 2022 | 1.4% |
| Mozambique | 2022 | 2.7% |
| Burkina Faso | 2024 | 3.0% |
| Malawi | 2020 | 3.0% |
| Mali | 2022 | 3.9% |
| Guatemala | 2023 | 4.2% |
| Afghanistan | 2021 | 4.7% |
| Sri Lanka | 2022 | 5.1% |
| Benin | 2022 | 5.2% |
| Senegal | 2022 | 5.7% |
| Guinea-Bissau | 2022 | 6.1% |
| Vanuatu | 2020 | 6.4% |
The indicator alone cannot explain these differences. Adult attainment combines multiple generations and can reflect decades of schooling access, policy, household resources, conflict, migration, gender inequality, regional inequality and demographic structure. Those possible mechanisms require separate evidence and should not be inferred causally from the map.
Korea and the United States are near 50% in 2024, while Canada is close to 69%
Among selected economies with recent observations, Korea is 49.6% in 2024, the United States 49.8% in 2024, Canada 68.8% in 2024, Australia 52.4% in 2024, and South Africa 50.7% in 2024. Germany is 42.4% in 2023, France 37.4% in 2023, and Japan 41.6% in 2020. China is 16.1% in 2020, India 16.1% in 2023, and Indonesia 11.7% in 2023.
| Country | Reference year | Adults 25+ at the threshold or higher |
|---|---|---|
| Canada | 2024 | 68.8% |
| United States | 2024 | 49.8% |
| Korea, Rep. | 2024 | 49.6% |
| Australia | 2024 | 52.4% |
| South Africa | 2024 | 50.7% |
| Germany | 2023 | 42.4% |
| France | 2023 | 37.4% |
| Japan | 2020 | 41.6% |
| Nigeria | 2023 | 41.4% |
| China | 2020 | 16.1% |
| India | 2023 | 16.1% |
| Indonesia | 2023 | 11.7% |
| Mexico | 2020 | 18.8% |
Reference years remain part of the comparison. For country-specific progress, a time series for one country is more defensible than inferring change from a cross-section of latest values collected in different years.
This threshold sits between upper-secondary attainment and short-cycle tertiary attainment
The related Green Map attainment indicators form a useful education-level ladder. The upper-secondary-or-higher series uses a lower threshold. The post-secondary non-tertiary-or-higher series used here is one level above it. The short-cycle-tertiary-or-higher series uses a still higher threshold.
All three are cumulative attainment measures for adults age 25+, but the threshold education level differs. In general, a higher threshold includes fewer people. However, subtracting one latest-value article from another and labeling the result as a transition, dropout or progression rate would be unsafe unless country coverage, reference year and statistical basis are aligned.
This is not a current college-enrollment rate or this year’s graduation rate
UNESCO UIS defines educational attainment as the highest level of education an individual has successfully completed. This indicator therefore measures accumulated educational attainment in the adult population, not the number of students currently enrolled, not annual graduates, and not a learning-quality score.
Because everyone age 25 and older is in the denominator, younger adults educated under recent policies are combined with older cohorts who may have had very different access to schooling. That makes the measure useful for understanding the stock of education accumulated across generations, while making it slower to respond to recent reforms than a current-cohort completion indicator.
Data source and comparison method
The statistical source is World Bank World Development Indicators series SE.SEC.CUAT.PO.ZS, with the UNESCO Institute for Statistics as the underlying provider. The full verified package contains 186 latest non-null country/economy rows. The main map, rankings and distribution statistics on this page restrict the sample to the 125 observations dated 2020–2024.
The recent-sample mean is 27.54% and the median 25.56%. ISO-3 codes are joined to a simplified world boundary layer; 110 polygons are directly matched to the 125 recent statistical rows. Small islands and separately reported territories can have valid statistics without a distinct visible polygon. An unfilled area therefore does not mean zero attainment.
Frequently Asked Questions
What does post-secondary non-tertiary attainment mean in this indicator?
SE.SEC.CUAT.PO.ZS measures the share of adults age 25+ who have completed post-secondary non-tertiary education or reached a higher level. ISCED level 4 follows upper secondary but remains below tertiary education.
Why is this not presented as a 2024 country ranking?
Only 21 of the latest observations are dated 2024, and the full package spans 1975–2024. The main map and comparison tables therefore use the 125 observations dated 2020–2024 and display reference years explicitly.
Is this the current college-enrollment rate?
No. It is a cumulative educational-attainment measure for the population age 25 and older. Current enrollment, entry and annual graduation rates are separate statistics.
How does this differ from short-cycle tertiary attainment?
Post-secondary non-tertiary is a lower threshold than short-cycle tertiary. Adults who meet the short-cycle tertiary threshold also exceed the post-secondary non-tertiary threshold, but the reverse is not necessarily true.
Related Articles
These three Green Map pages provide the closest comparisons at the education levels immediately below and above this threshold.
- Global Lower-Secondary-or-Higher Attainment Map – Latest Values for Adults 25+
- Global Upper-Secondary Educational Attainment Map – Latest Values for Adults 25+
- Global Short-Cycle Tertiary Attainment Map – Latest Values for Adults 25+
Green Map creates custom-edited map images using open geographic data sources such as geoBoundaries, Natural Earth, OpenStreetMap, and government open data.
These maps are edited visual materials, not raw data files, and are provided for education, documents, presentations, and graphic reference.