How many adults have completed education beyond upper secondary and reached at least the short-cycle tertiary level? World Bank World Development Indicators series SE.TER.CUAT.ST.ZS answers that question for the population age 25 and older. It is an accumulated attainment measure, not a current college-enrollment rate. The verified package contains 184 country/economy observations, with latest available values ranging from 1.1% to 73.9%.
The map is a latest-observation snapshot, not a 2025 league table. Reference years span 2003–2025. 144 observations (78.3%) are dated 2019 or later, but Mexico is the only economy with a 2025 row. This mixed-vintage design is useful for finding broad geographic differences in the most recently reported adult attainment level, while making exact same-year rankings inappropriate.
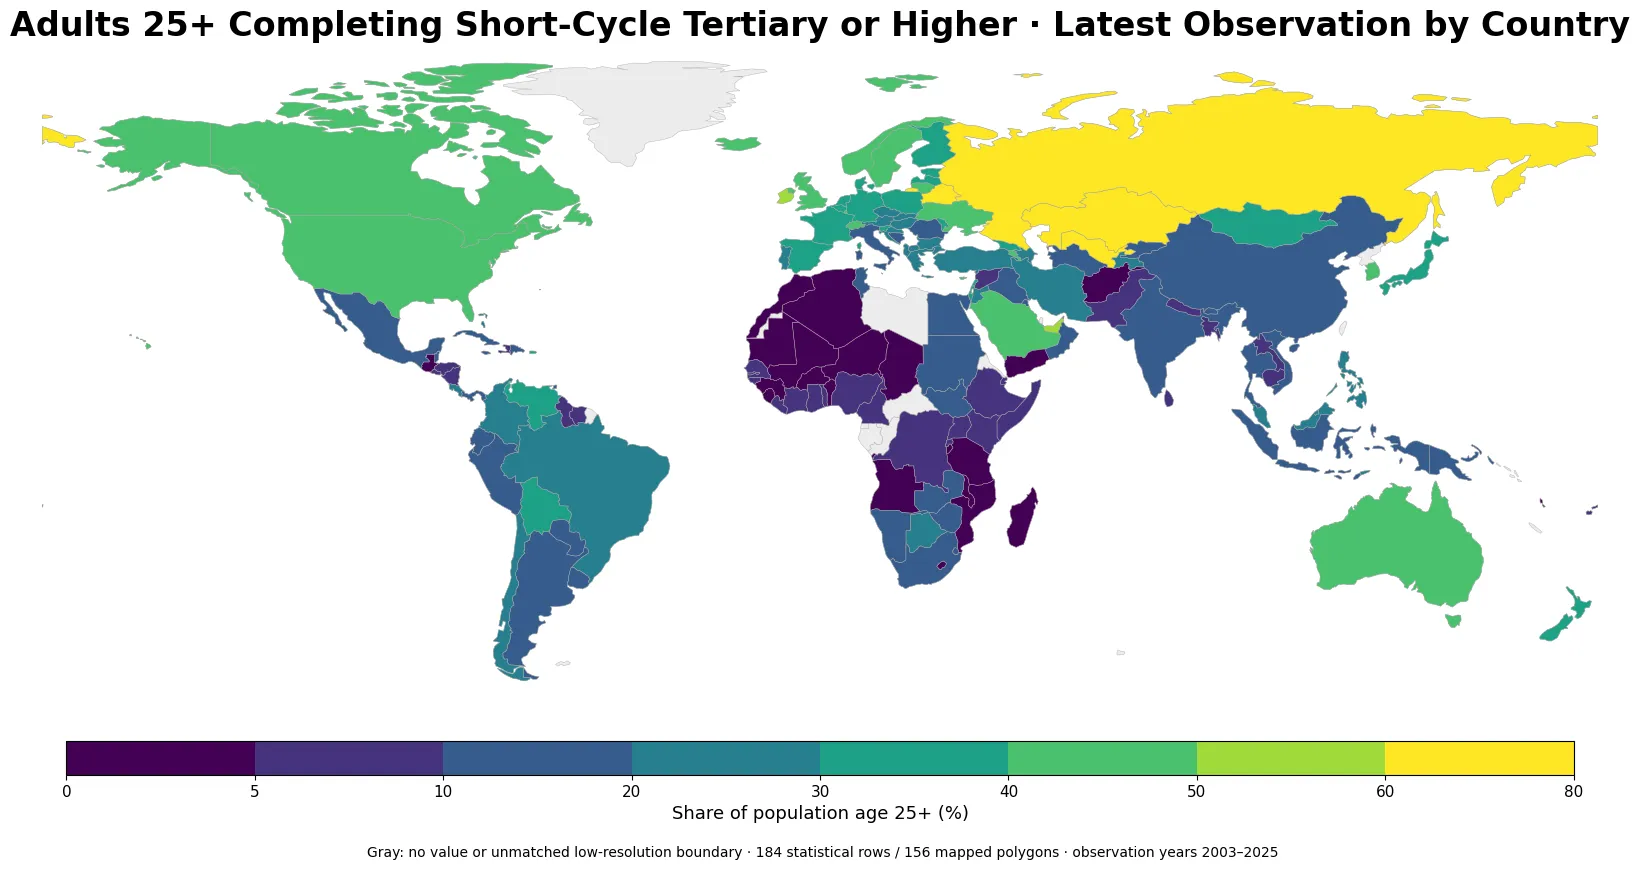
Table of Contents
Short-cycle tertiary is an attainment threshold, not a college enrollment rate
The indicator counts adults age 25+ who have attained or completed short-cycle tertiary education. Under the International Standard Classification of Education, this is a tertiary level below a bachelor’s degree in the hierarchy. Programs and qualifications differ across national systems, so “short-cycle tertiary” should be treated as an internationally harmonized education level rather than as an exact synonym for one specific type of college or diploma in every country.
The word “at least” also changes the interpretation. Adults who completed bachelor’s, master’s, doctoral, or other higher tertiary levels are included because they have crossed the short-cycle-tertiary threshold. A 40% value therefore means that about four in ten adults age 25+ have completed short-cycle tertiary education or a higher level. It does not mean 40% are currently enrolled in tertiary education, nor does it measure the annual number of graduates.
The country-row median is 17.9%, but it is not a population-weighted world rate
Across the 184 latest observations, the simple median is 17.9% and the unweighted mean is 21.3%. The distribution includes 22 observations below 5%, 33 from 5% to 9.9%, 45 from 10% to 19.9%, 35 from 20% to 29.9%, 26 from 30% to 39.9%, 16 from 40% to 49.9%, 3 from 50% to 59.9%, and 4 at 60% or above. The spread is broad enough that a single average hides much of the cross-country variation.
These summary statistics give one equal weight to each country/economy row. They are not estimates of the share of all adults in the world who have reached this education threshold. A population-weighted global figure would require age-appropriate population weights or an official aggregate designed for that purpose. The values here describe the distribution of reporting economies.
A 2019-or-later subset still shows a wide attainment gap
Restricting the dataset to observations dated 2019 or later leaves 144 economies, or 78.3% of the full set. Their median is 20.9% and their unweighted mean is 23.2%. Even in this more recent subset, 11 observations remain below 5%, while 21 are at 40% or above. The broad international gap is therefore not created only by very old rows.
High recent observations include Russian Federation 64.1% (2021), Uzbekistan 61.5% (2022), Belarus 60.7% (2019), United Arab Emirates 55.7% (2024), Singapore 53.2% (2024), Ireland 51.2% (2023), United States 49.8% (2024), Korea, Rep. 49.6% (2024). At the lower end are Niger 1.3% (2022), Kiribati 1.8% (2023), Malawi 2.0% (2020), Mozambique 2.7% (2022), Burkina Faso 3.0% (2024), Afghanistan 3.1% (2021), Burundi 3.1% (2020), Mali 3.9% (2022). These are attainment shares, not scores for education quality. A small decimal difference between two high-value economies should not be interpreted as a meaningful ranking of learning, skills, teaching quality, or current student performance.
Selected economies illustrate why the percentage and reference year must be read together
The United States reports 49.8% in 2024 and Korea 49.6% in 2024. Australia is 47.5% in 2024, while Canada is 49.3% in 2021 and the United Kingdom 48.7% in 2021. Germany is 30.2% in 2022 and France 37.2% in 2023. Japan’s latest value in the package is 34.4%, but it is dated 2010, which makes it a poor candidate for fine current ranking against economies measured in 2023 or 2024.
| Country/economy | Reference year | Adults 25+ completing short-cycle tertiary or higher |
|---|---|---|
| United States | 2024 | 49.8% |
| Korea, Rep. | 2024 | 49.6% |
| Canada | 2021 | 49.3% |
| United Kingdom | 2021 | 48.7% |
| Australia | 2024 | 47.5% |
| Germany | 2022 | 30.2% |
| France | 2023 | 37.2% |
| Japan | 2010 | 34.4% |
| Spain | 2024 | 35.4% |
| Turkiye | 2023 | 21.9% |
| Brazil | 2024 | 22.7% |
| Mexico | 2025 | 19.7% |
| South Africa | 2024 | 17.3% |
| China | 2020 | 16.1% |
| India | 2021 | 12.4% |
| Indonesia | 2023 | 11.7% |
| Nigeria | 2023 | 9.1% |
| Ethiopia | 2021 | 6.3% |
| Niger | 2022 | 1.3% |
The table is intentionally not sorted into a global ranking. Mixed reference years mean that a newer survey and a decade-old observation do not have the same currency. The data can support broad comparisons and clearly separated bands, but an exact 1-to-184 ordering would imply precision that the latest-observation design does not provide.
The latest observations are spread from 2003 to 2025
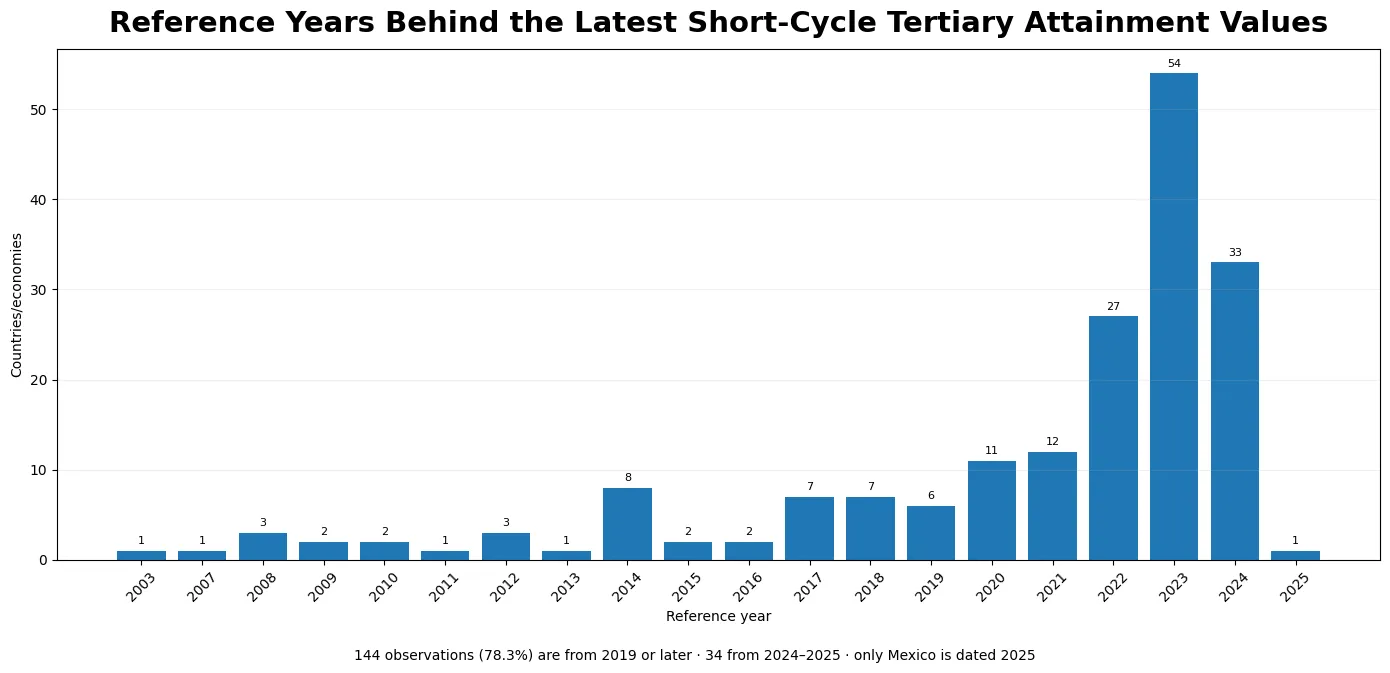
The reference-year distribution is concentrated in recent years but not exclusively so: 54 observations are from 2023, 33 from 2024, 27 from 2022, 12 from 2021, 11 from 2020, and 6 from 2019. Another 40 observations are from 2018 or earlier. Sierra Leone is represented by a 2003 observation, Japan by 2010, and Algeria by 2011. “Latest available” therefore refers to the newest value available for each economy, not to a common recent year.
Adult educational attainment usually changes more slowly than monthly economic indicators, yet that does not make a 10- or 20-year-old observation current. Questions about recent policy effects, convergence, or rates of progress need matched-year data or country time series. This article does not infer a trend from one retained observation per economy.
This threshold is stricter than lower- or upper-secondary attainment
Short-cycle tertiary attainment sits above secondary education in the education hierarchy. Someone counted in this indicator has crossed a higher threshold than a person counted only as having completed lower secondary or upper secondary. That makes this series useful when the question is about the accumulated stock of adults who have reached tertiary education, not simply basic or secondary schooling.
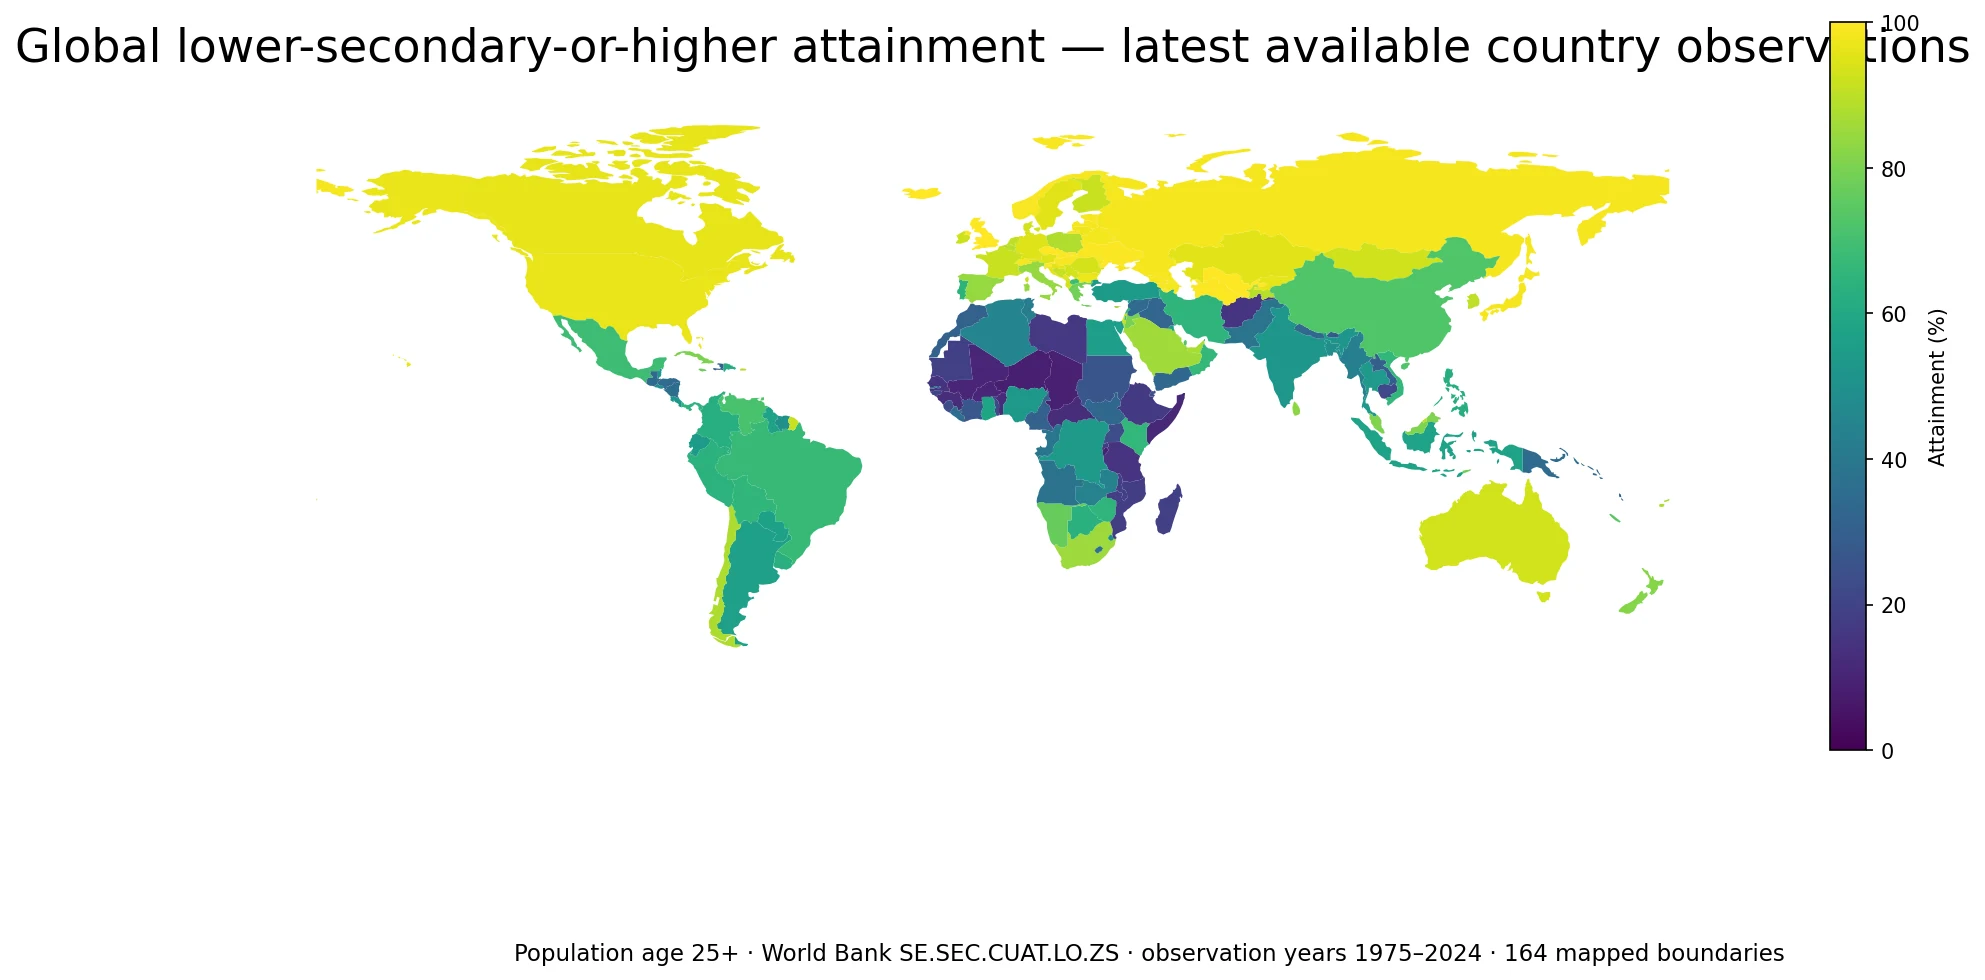
However, subtracting one latest-value attainment map from another and labeling the difference as a dropout rate would be unsafe unless the country coverage, reference year, denominator, and classification basis are aligned. The related lower-secondary article is useful for understanding the threshold concept, but this package does not fabricate cross-indicator gaps from unmatched vintages.
The map shows spatial differences, not the causes behind them
Relatively high latest observations appear across North America, Australia, several European economies, parts of East Asia, and parts of Russia and Central Asia. Many low observations occur in Sub-Saharan Africa and South Asia. The pattern can help identify where a larger or smaller share of adults has reached at least this tertiary threshold.
The dataset alone cannot explain those differences. Tertiary access can be shaped by household resources, tuition and financial aid, labor-market incentives, urbanization, migration, gender gaps, institutional capacity, conflict, demographic history, and decades of education policy. None of those causal variables is present in the supplied CSV. The indicator also records attainment level rather than learning quality, field of study, occupational skills, earnings, or employment outcomes.
Data source, methodology, and comparison limits
The statistical source is World Bank World Development Indicators series SE.TER.CUAT.ST.ZS. World Bank metadata defines it as the percentage of the population age 25 and older that attained or completed short-cycle tertiary education and identifies the UNESCO Institute for Statistics (UIS) as the underlying provider. The metadata states that data are collected mainly through population censuses, household surveys, and labor-force surveys and mapped to ISCED for international comparability. The official definition and limitations are available in the World Bank DataBank metadata glossary.
The verified cleaned CSV retains one latest non-null observation for each real economy and excludes regional and income-group aggregates. All means, medians, band counts, and table values in this article were calculated directly from those 184 rows. The visualization joins ISO-3 codes to a locally available low-resolution country boundary set and fills 156 polygons. Small islands and separately reported territories can remain in the statistical sample without a visible polygon, so an unfilled or gray area should not be interpreted as a zero value.
Frequently Asked Questions
Is this a 2025 country ranking of short-cycle tertiary attainment?
No. The package uses each economy’s latest non-null observation, with reference years spanning 2003–2025. Mexico is the only economy with a 2025 observation.
Is short-cycle tertiary attainment the same as the current college enrollment rate?
No. It is the cumulative share of adults age 25+ who have completed short-cycle tertiary education or a higher level. Enrollment and entry rates answer different questions.
Does short-cycle tertiary mean exactly the same qualification in every country?
No. The data are harmonized to the ISCED framework, but national degrees and qualifications do not always map perfectly to identical programs. Broad comparisons are safer than fine rankings.
Does a gray or unfilled country mean the attainment rate is zero?
No. Data may be missing or the economy may lack a separate polygon in the low-resolution boundary set. Missing geometry and missing data are not zero.
Related Articles
- Global Lower-Secondary-or-Higher Attainment Map – Latest Values for Adults 25+
- Global Internet Use Map – 2024 Country Comparison
- World Bank Data Catalog Licensing Guide – Check Access and Reuse Terms
Green Map creates custom-edited map images using open geographic data sources such as geoBoundaries, Natural Earth, OpenStreetMap, and government open data.
These maps are edited visual materials, not raw data files, and are provided for education, documents, presentations, and graphic reference.