The 2022 map of industrial freshwater withdrawal share shows a strongly uneven pattern. Several European economies and Canada report very large industrial shares, while much of Asia, Africa and Latin America falls in lower bands. The percentage should not be confused with the volume of water used by industry. It measures the fraction of a country or economy’s total freshwater withdrawals assigned to industrial uses.
The comparison uses World Bank World Development Indicators series ER.H2O.FWIN.ZS. The supplied 2022 master table contains 217 country/economy rows, of which 177 have numeric values and 40 are missing. Across the reported values, the unweighted median is 7.1% and the mean is 18.3%. The middle half runs from 2.1% to 26.2%, which makes the high-end tail visible even before looking at the map.
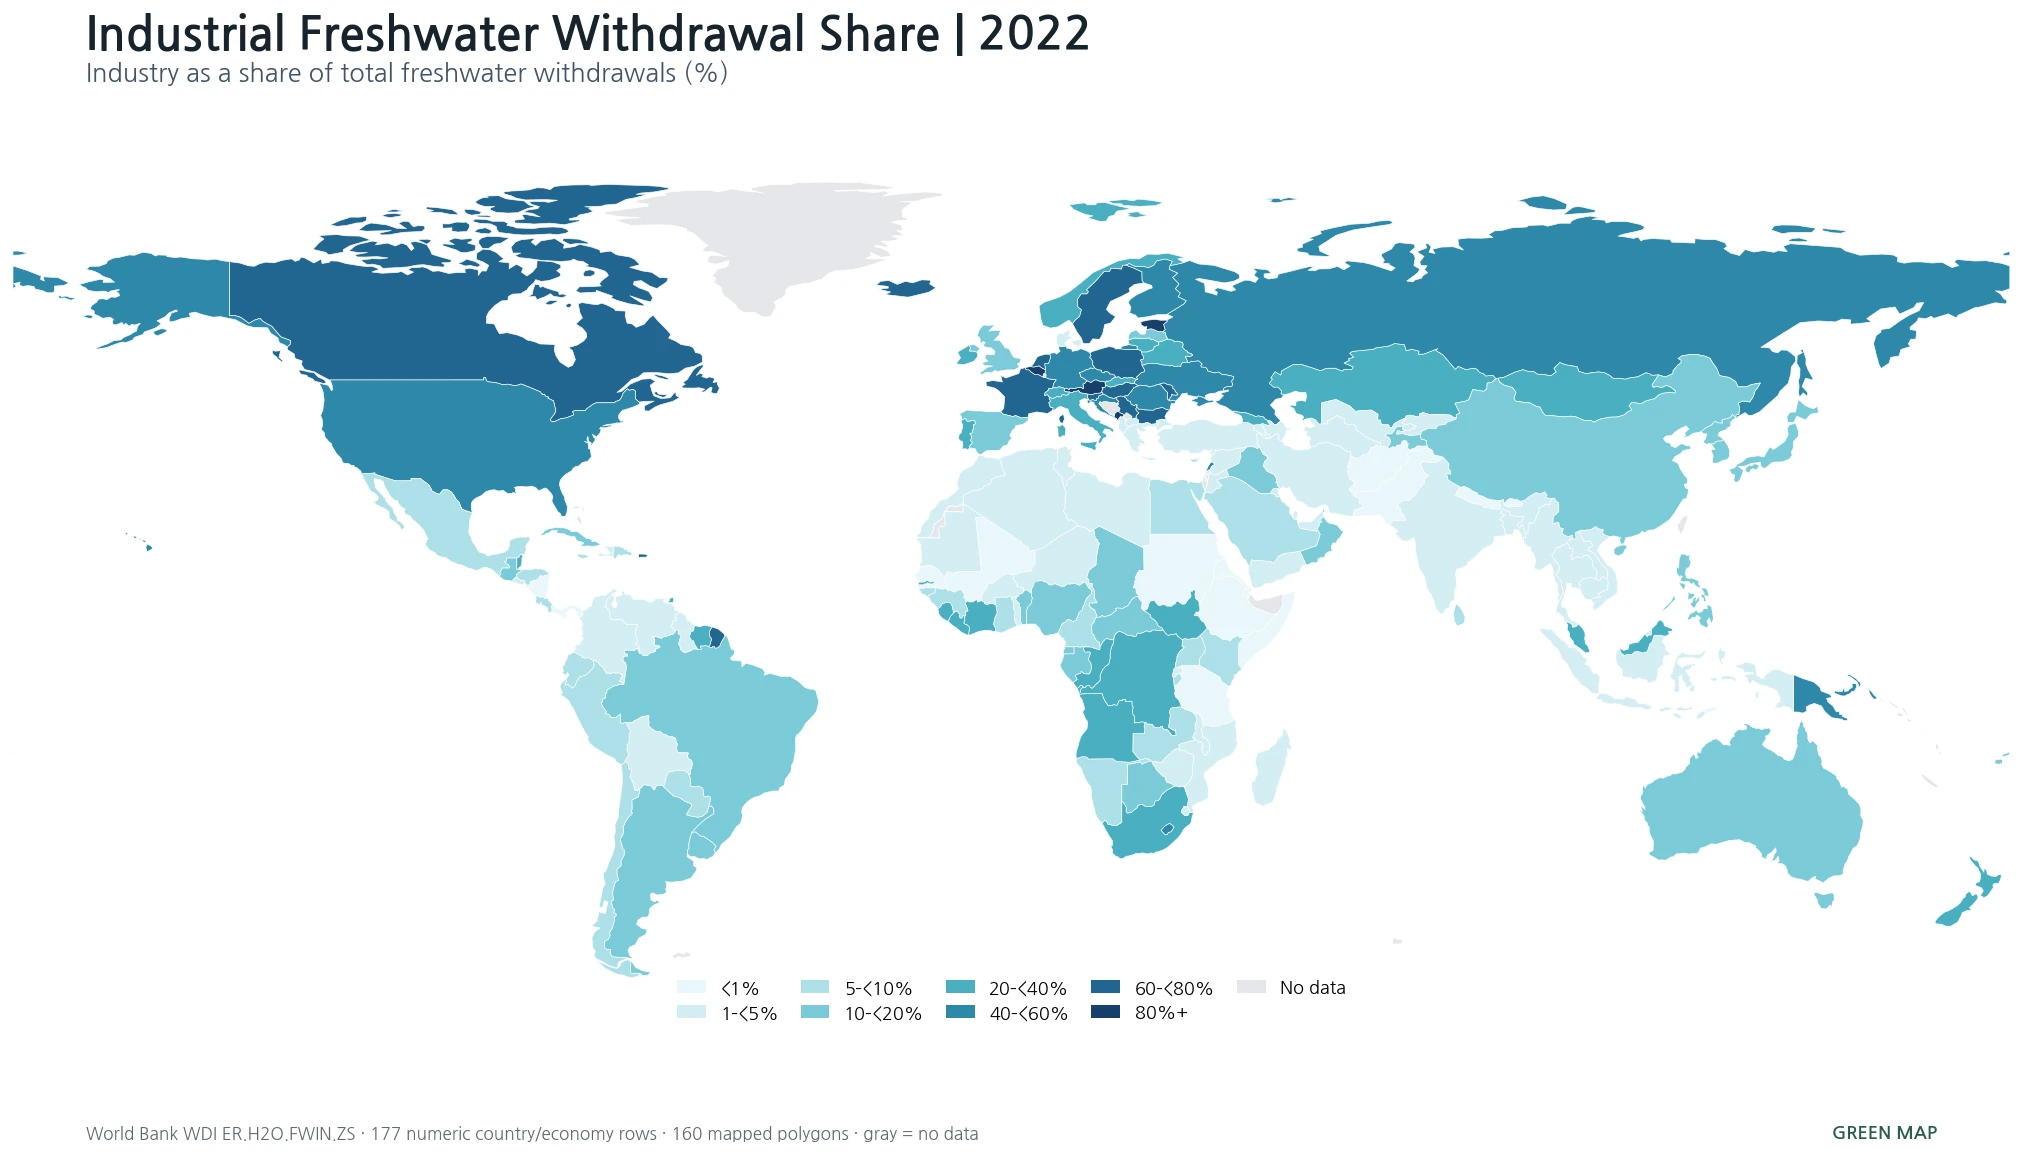
Table of Contents
Read the percentage as a sector share, not a water-use total
World Bank metadata defines industrial withdrawals as water withdrawn for direct industrial use, including cooling water for thermoelectric power plants. The denominator is total freshwater withdrawals across uses. This makes the series useful for comparing the structure of national water withdrawals, but it does not answer how many cubic meters industry actually withdraws.
A country can have a low industrial share even with a substantial industrial sector if agriculture dominates national withdrawals. The reverse is also possible: a country can show a very high industrial percentage even when its total withdrawal volume is relatively small. The indicator therefore cannot be used as a ranking of industrial size, industrial efficiency, or absolute industrial water demand.
The official definition and methodology are available in the World Bank WDI metadata glossary. The underlying source is identified there as FAO AQUASTAT.
The upper tail reaches the mid-90s
Montenegro has the highest reported 2022 value at 94.2%, followed almost exactly by Estonia at 94.2% and Austria at 93.3%. Belgium is also above 80%, while Slovenia, Serbia, Canada, Hungary, Moldova and Puerto Rico complete the top ten. Only 4 reported observations are at or above 80%, and 16 are at or above 60%.
| Country/economy | Industrial share of freshwater withdrawals, 2022 |
|---|---|
| Montenegro | 94.2% |
| Estonia | 94.2% |
| Austria | 93.3% |
| Belgium | 84.1% |
| Slovenia | 78.0% |
| Serbia | 77.9% |
| Canada | 75.8% |
| Hungary | 75.7% |
| Moldova | 73.1% |
| Puerto Rico (US) | 72.2% |
The top ranking is best read as a composition ranking. It does not say that Montenegro, Estonia or Austria withdraw more industrial water in cubic meters than much larger economies. Their percentages indicate that industry accounts for a particularly large part of the freshwater withdrawals recorded for those economies.
Nearby countries can fall into completely different bands
One of the map’s strongest geographic signals is the contrast between neighbors. Montenegro reports 94.2% while Albania is at 1.4%. Austria is at 93.3% compared with Switzerland at 37.1%. Around the Baltic, Estonia is 94.2%, but Latvia is 17.6% and Lithuania 29.3%.
Those differences show why a regional label alone is not enough. Industrial mix, irrigation demand, power-plant cooling, the size of total withdrawals and national reporting practices can all matter. This single series does not identify which factor caused a particular value, so the map should be used to locate contrasts rather than to assign a one-factor explanation.
How selected major economies compare
Canada stands out among large economies at 75.8%, followed by France at 68.1%, Germany at 54.3% and the United States at 47.2%. Russia is 44.8%. In East Asia, China is 17.7%, South Korea 16.4% and Japan 16.4%, placing all three in a relatively narrow band. India is much lower at 2.2%.
| Country | Industrial share, 2022 |
|---|---|
| Canada | 75.8% |
| France | 68.1% |
| Germany | 54.3% |
| United States | 47.2% |
| Russian Federation | 44.8% |
| South Africa | 23.2% |
| Australia | 18.6% |
| China | 17.7% |
| Korea, Rep. | 16.4% |
| Japan | 16.4% |
| Brazil | 15.0% |
| United Kingdom | 12.0% |
| Mexico | 8.9% |
| Saudi Arabia | 5.4% |
| Indonesia | 4.1% |
| India | 2.2% |
India’s low percentage is a good example of why the metric must not be treated as a proxy for industrialization. A large agricultural share of national withdrawals can reduce the industrial percentage even when industrial water use is economically important. Separate data are needed for industrial output, total withdrawals, and sector-specific withdrawal volumes.
Low values, zero values, and missing values are different
Among the 177 numeric observations, 21 are below 1% and 72 are below 5%. Djibouti, Dominica, Grenada, St. Kitts and Nevis, St. Lucia and Monaco are recorded as exactly zero in the supplied 2022 table. St. Vincent and the Grenadines is 0.02%, Senegal 0.05% and Nicaragua 0.05%.
An observed zero is not the same as a missing observation. The 40 missing rows remain NA and are not converted to zero or backfilled from another year. Likewise, an observed 0% should not be expanded into the claim that an economy has no industrial activity; it is simply the value reported for this particular share indicator.
The distribution is highly right-skewed
| Share band | Number of reported economies |
|---|---|
| 0–<1% | 21 |
| 1–<5% | 51 |
| 5–<10% | 25 |
| 10–<20% | 25 |
| 20–<40% | 27 |
| 40–<60% | 12 |
| 60–<80% | 12 |
| 80%+ | 4 |
The median of 7.1% sits far below the mean of 18.3% because a relatively small group of values in the 60–90% range pulls the average upward. For a “typical country” interpretation, the median and quartiles are more informative than the mean alone. The map is especially useful for seeing where the upper tail is geographically concentrated and where neighboring countries diverge.
This is not a water-stress map
Industrial share and water stress answer different questions. Water stress compares withdrawals with available renewable freshwater resources, while this indicator only partitions withdrawals by sector. A high industrial share can occur in a country with low overall water stress, and a low industrial share can occur in a country facing severe pressure if agriculture or municipal demand dominates withdrawals.
Absolute freshwater withdrawals are another separate measure. To compare how much water an economy withdraws in total, a volume series such as “Annual freshwater withdrawals, total (billion cubic meters)” is more appropriate. To judge scarcity, renewable water availability and environmental flow requirements must also be considered. The present map intentionally stays with the industrial percentage.
Data source and mapping method
The metric is World Bank WDI series ER.H2O.FWIN.ZS, “Annual freshwater withdrawals, industry (% of total freshwater withdrawal).” The source listed by the World Bank is FAO AQUASTAT. This package fixes the comparison to a common 2022 reference year. All 177 numeric country/economy observations are retained for rankings and descriptive statistics, while 40 missing values remain missing.
The choropleth was generated directly from the verified cleaned CSV and a low-resolution world boundary layer. 160 country polygons could be colored directly after matching the supplied values. Small islands and separately reported territories may have valid data but no visible polygon at this scale. Gray therefore means either missing data or no direct low-resolution polygon match; it does not mean zero. No interpolation, estimated replacement, or prior-year backfilling was added.
Country/economy rows should also not be confused with a count of sovereign states. World Bank datasets include territories and separately reported economies. For that reason, the statistics in this article are explicitly described as country/economy observations rather than “all countries in the world.”
Frequently Asked Questions
Does a high industrial withdrawal share mean a country uses the most industrial water?
No. The indicator is a percentage of total freshwater withdrawals. A high share can coexist with a relatively small total withdrawal volume, so it is not a ranking of industrial water use in cubic meters.
How do selected East Asian economies compare in 2022?
South Korea is 16.4% in the supplied 2022 World Bank WDI series. Japan is 16.4% and China 17.7%.
Is 0% the same as missing data?
No. Zero is a reported numeric observation, while missing means no 2022 numeric value is present. The 40 missing rows in this package remain NA and are not replaced with zero or an earlier year.
Does the industrial category include power-plant cooling?
Yes. World Bank metadata states that industrial withdrawals include direct industrial use and withdrawals for cooling thermoelectric power plants.
Related Articles
These Green Map comparisons use the same general approach of fixing a common reference year and keeping missing values separate from zero.
- Global Forest Area Share Map – 2023 Country Comparison
- Global Arable Land Share Map – 2023 Country Comparison
- Global Marine Protected Area Share Map – 2025 Country Comparison
Green Map creates custom-edited map images using open geographic data sources such as geoBoundaries, Natural Earth, OpenStreetMap, and government open data. These maps are edited visual materials, not raw data files, and are provided for education, documents, presentations, and graphic reference.