A country-by-country map of forest area as a share of land area reveals a wide spread between economies whose land is overwhelmingly forested and those with very little land classified as forest. The comparison uses World Bank World Development Indicators series AG.LND.FRST.ZS, “Forest area (% of land area),” and fixes every observation to the same reference year: 2023. The master table contains 217 countries and economies, of which 213 have a numeric 2023 value and four remain missing.
The simple average across the 213 reported economies is about 31.7%, and the median is 31.1%. This is an unweighted country-level average, not the share of the world’s total land that is forest. Every economy counts once regardless of its land size. The distribution contains 16 economies at 70% or above, 36 between 50% and 69.9%, 57 between 30% and 49.9%, 56 between 10% and 29.9%, and 48 below 10%.
“Forest” also has a specific statistical definition here. World Bank metadata, drawing on FAOSTAT from the Food and Agriculture Organization of the United Nations, describes forest area as land under natural or planted stands of trees capable of reaching at least five meters in situ. Tree stands in agricultural production systems—such as fruit plantations and agroforestry systems—and trees in urban parks and gardens are excluded. The indicator therefore should not be treated as a satellite tree-cover percentage, a measure of forest quality, or a count of every tree in a country.
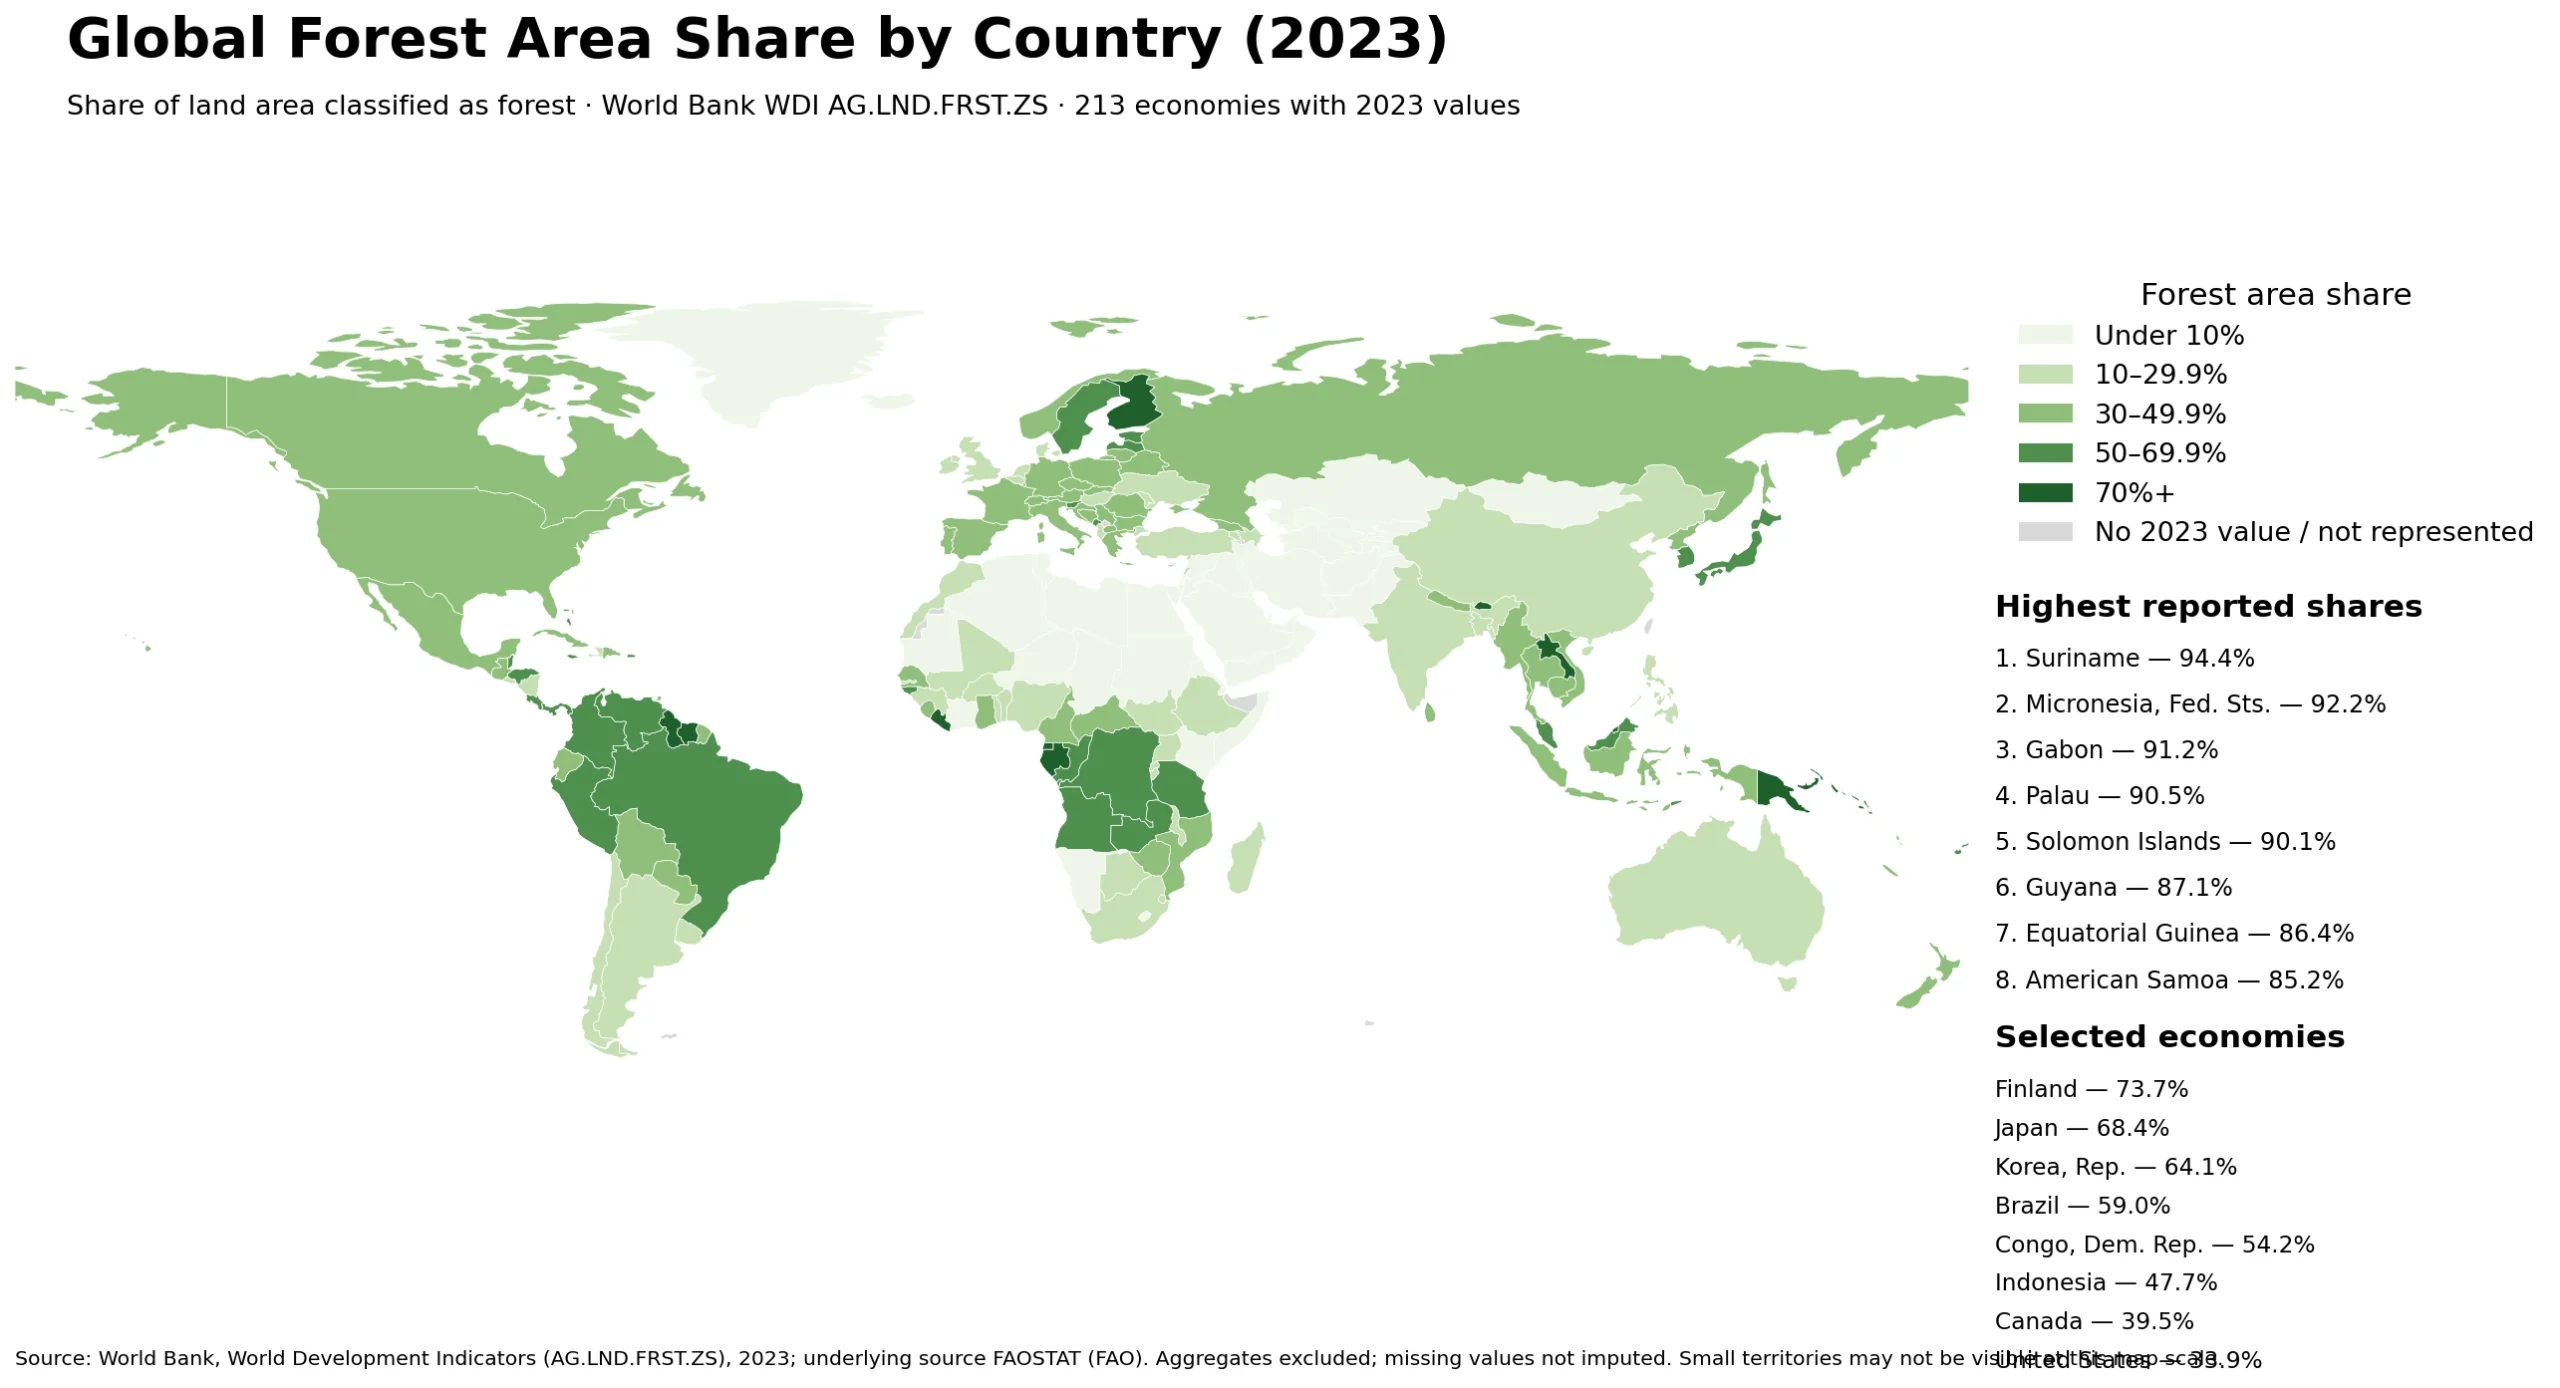
Table of Contents
Where forest covers the largest share of land
| Country or economy | Forest area share, 2023 |
|---|---|
| Suriname | 94.4% |
| Micronesia, Fed. Sts. | 92.2% |
| Gabon | 91.2% |
| Palau | 90.5% |
| Solomon Islands | 90.1% |
| Guyana | 87.1% |
| Equatorial Guinea | 86.4% |
| American Samoa | 85.2% |
| Papua New Guinea | 79.0% |
| Liberia | 78.1% |
Suriname has the highest reported share at 94.4%. The Federated States of Micronesia follows at 92.2%, Gabon at 91.2%, Palau at 90.5%, and the Solomon Islands at 90.1%. Guyana is also exceptionally high at 87.1%. The leading group spans northern South America, Central Africa, and Pacific island economies rather than forming a single geographic block.
A high percentage does not mean a country has the world’s largest absolute forest area. Suriname’s land is overwhelmingly classified as forest, but its total land area is far smaller than Brazil’s or Canada’s. To compare the number of square kilometers of forest, a separate measure such as Forest area (sq. km) is required. This article stays with the percentage of national land area so that the map answers a land-composition question rather than a total-size question.
How selected large and familiar economies compare
| Country | Forest area share, 2023 |
|---|---|
| Finland | 73.7% |
| Sweden | 68.7% |
| Japan | 68.4% |
| Korea, Rep. | 64.1% |
| Brazil | 59.0% |
| Congo, Dem. Rep. | 54.2% |
| Russian Federation | 49.8% |
| Indonesia | 47.7% |
| Canada | 39.5% |
| United States | 33.9% |
| India | 24.5% |
| China | 24.0% |
| Australia | 17.4% |
Selected economies show how broad the range remains even outside the very top and bottom. Finland is at 73.7%, Sweden at 68.7%, Japan at 68.4%, and South Korea at 64.1%. Brazil is 59.0% and the Democratic Republic of the Congo 54.2%. Russia is just below half at 49.8%, while Indonesia is 47.7%, Canada 39.5%, and the United States 33.9%. India and China are close to one quarter of land area, and Australia is 17.4%.
These percentages should not be converted into a one-dimensional environmental ranking. A high forest share does not tell us whether the forest is primary, naturally regenerated, planted, fragmented, protected, degraded, or biologically diverse. A low share also does not by itself indicate poor land management, because deserts, grasslands, tundra, and other non-forest ecosystems can naturally dominate national landscapes. The indicator measures land classification, not the cause or ecological condition behind that share.
Forty-eight economies are below 10%
Of the 213 economies with a 2023 value, 48 are below 10%. Monaco, Gibraltar, Qatar, and Naoero are recorded at 0.0% in the supplied series. Oman is about 0.008%, Egypt 0.045%, the Faroe Islands 0.058%, Libya 0.123%, Curaçao 0.158%, Kuwait 0.351%, and Saudi Arabia 0.454%. The low end includes both very small urban or island economies and dry countries, so a single explanation would be misleading.
A reported 0.0% should not be read as proof that no trees exist. The value reflects the indicator’s forest definition, the denominator of total land area, and the precision of the reported percentage. Urban trees may be outside the definition, agricultural tree systems can be excluded, and a very small qualifying area can round to zero. The lightest map category therefore means a very low official forest-area share, not a literal absence of all woody vegetation.
Forest share and total forest area answer different questions
The distinction between percentage and absolute area is essential. Brazil is at 59.0%, Canada at 39.5%, and the United States at 33.9%. These percentages tell us how much of each country’s land is classified as forest, but they do not show how many square kilometers of forest each country contains. Because national land areas differ enormously, a lower percentage in a very large country can still represent a vast absolute forest area.
The reverse is also true for highly forested smaller economies. Suriname’s 94.4% is a powerful description of national land composition, but it does not imply that Suriname holds more total forest than every large country below it in the percentage ranking. Percentage maps are best for comparing the character of national land cover; absolute-area maps are better for comparing the physical scale of forest resources.
Four missing observations are not treated as zero
The 2023 master table has no retained value for the Channel Islands, Hong Kong SAR, China, Macao SAR, China, or Kosovo. Those four rows remain missing rather than being filled with a prior-year observation or replaced with a neighboring value. On the map, a gray or unclassified area therefore means “no 2023 value in this comparison,” not 0% forest.
The geographic scope also should not be confused with a count of sovereign states. World Bank country and economy reporting includes separately reported territories and economies, while regional and other aggregate rows were excluded from this dataset. That is why the 217-row master universe is not a sovereign-country count. Some island economies included in the table are too small to be visible on a simplified world map, but their data remain part of the statistical comparison.
Definition, source, and comparison method
The primary series is World Bank World Development Indicators AG.LND.FRST.ZS, with FAOSTAT from the Food and Agriculture Organization of the United Nations as the underlying source. The World Bank metadata glossary defines forest area as the share of total land under natural or planted stands of trees capable of reaching at least five meters in situ, excluding tree stands in agricultural production systems and trees in urban parks and gardens.
Every statistic in this comparison uses 2023 observations only. The 213 numeric values are retained as reported; the four missing rows are not imputed. Rankings, bin counts, the simple mean, and the median were calculated directly from those 213 observations. This avoids mixing each economy’s latest available year and makes the country colors directly comparable on a single reference-year map.
Frequently Asked Questions
Does a high forest area share mean a country has the most forest in square kilometers?
No. This indicator measures forest as a percentage of national land area. Absolute forest area also depends on the size of the country, so a separate square-kilometer measure is needed for total forest area.
What counts as forest in this World Bank indicator?
The WDI definition covers land under natural or planted stands of trees capable of reaching at least five meters in situ. Agricultural tree systems and trees in urban parks and gardens are excluded.
Does 0.0% mean an economy has no trees at all?
No. A 0.0% value reflects the official forest definition and percentage precision. Some trees may fall outside the definition, and a very small qualifying share may round to zero.
Are gray areas on the map countries with very low forest share?
No. Four country or economy rows do not have a retained 2023 value in this comparison. Missing observations remain missing rather than being treated as zero or filled with another year.
Related Maps
- Printable Guyana Map for Classrooms, Presentations, and Editing
- Gabon Map for Classroom, Presentation and Design Projects
- Finland Map Collection – Printable Color, Black and White & Outline Maps
- South America Map: Printable Country Map Collection
Green Map creates custom-edited map images using open geographic data sources such as geoBoundaries, Natural Earth, OpenStreetMap, and government open data. These maps are edited visual materials, not raw data files, and are provided for education, documents, presentations, and graphic reference.