Youth unemployment is often misread as the percentage of all young people who do not have a job. The indicator is narrower. It measures unemployed people as a share of the labor force ages 15–24, so the denominator includes young people who are employed or actively seeking work. Students and other people outside the labor force are not automatically counted as unemployed. In the World Bank national-estimate series SL.UEM.1524.NE.ZS, 103 of 217 economies have a value for 2024 and 114 are source-missing. The comparison below uses only reported observations and keeps missing values separate from zero.
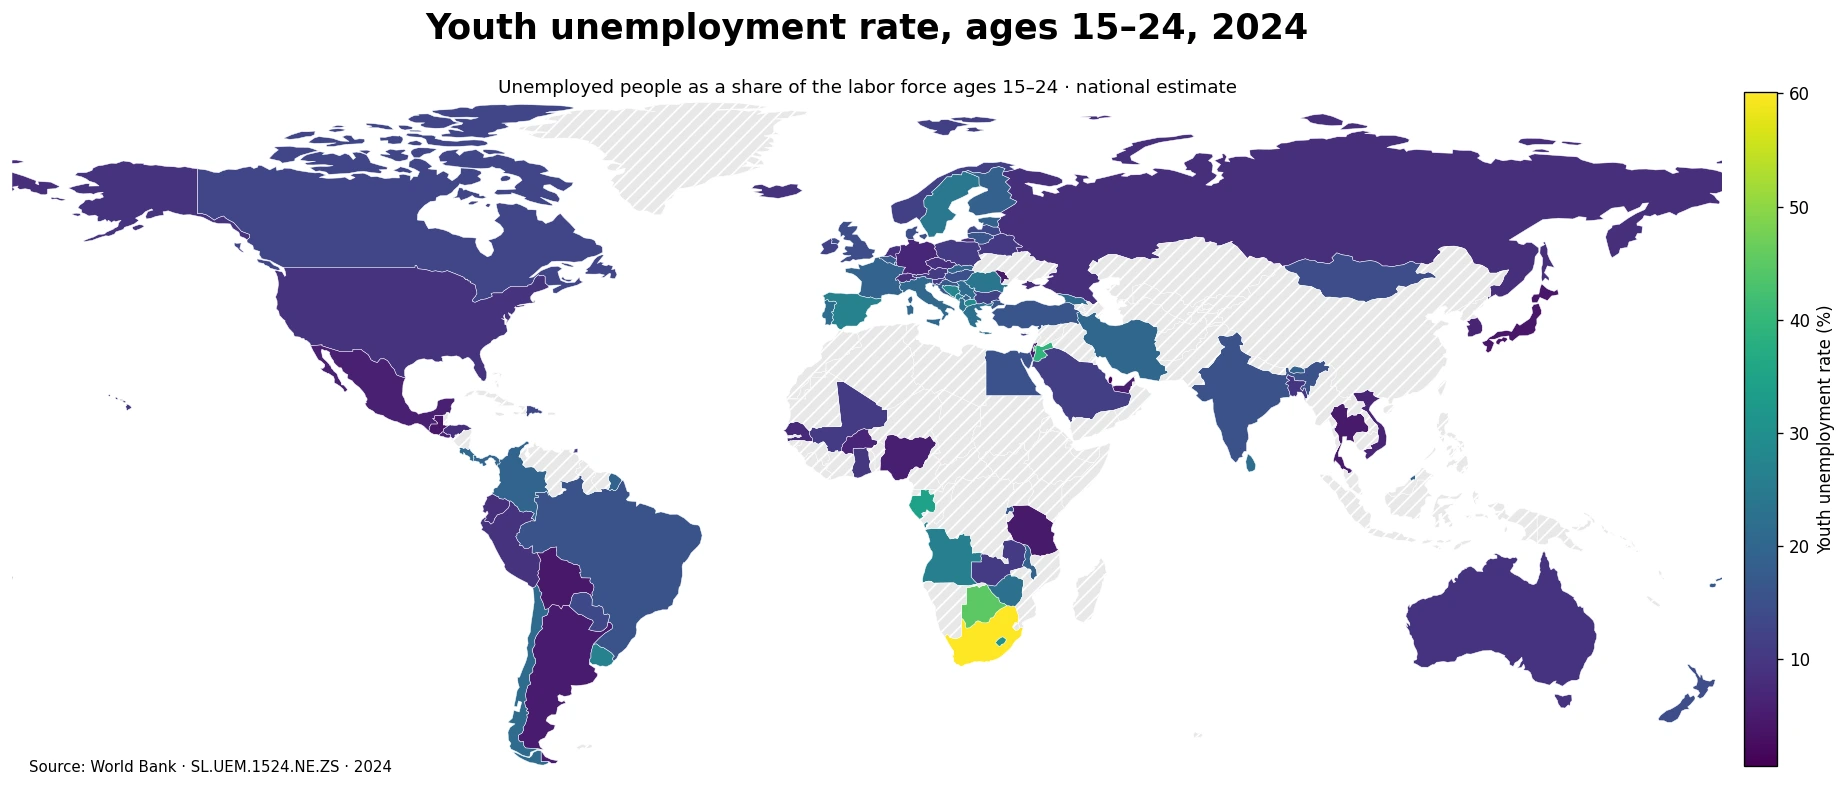
Table of Contents
The median reported youth unemployment rate was 14.3%
Across the 103 economies with a 2024 observation, the simple mean is 15.64% and the median is 14.29%. The first quartile is 8.94% and the third quartile is 20.24%, placing the middle half of reported economies between roughly 8.9% and 20.2%. The range is wide: the minimum is 0.533% and the maximum is 60.111%, a spread of 59.58 percentage points. The mean exceeds the median because several very high values stretch the upper tail.
33 reporting economies are below 10%, while 27 are at or above 20%. Only 6 reach at least 30%, and 3 exceed 40%. Those thresholds are useful for seeing how uneven the distribution is, but they do not turn the indicator into a complete score of youth opportunity. A country can record a relatively low unemployment rate while also having a small youth labor force if many young people remain in education or are otherwise outside employment and active job search.
South Africa stood at the top of the 2024 distribution
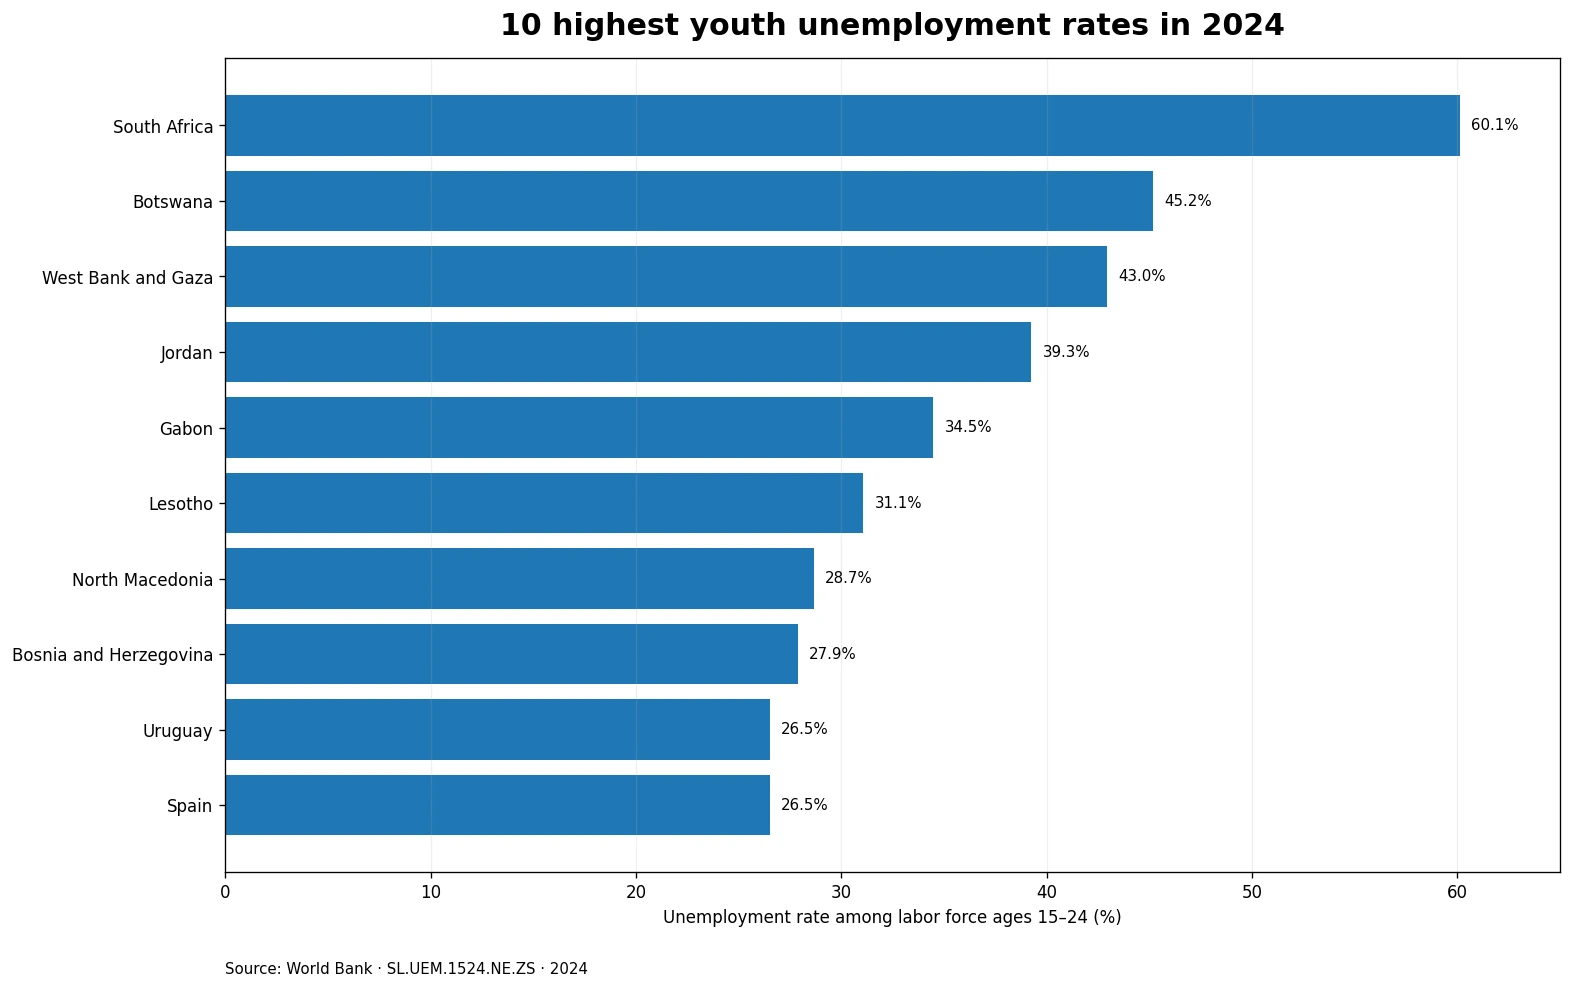
South Africa records the highest reported value at 60.1%. Botswana follows at 45.2%, West Bank and Gaza at 43.0%, Jordan at 39.3%, Gabon at 34.5%, and Lesotho at 31.1%. The average for the ten highest observations is 36.3%. At these levels, a substantial share of young people who have entered the labor force are available for work and seeking employment without being employed.
| Economy | Youth unemployment rate |
|---|---|
| South Africa | 60.1% |
| Botswana | 45.2% |
| West Bank and Gaza | 43.0% |
| Jordan | 39.3% |
| Gabon | 34.5% |
| Lesotho | 31.1% |
| North Macedonia | 28.7% |
| Bosnia and Herzegovina | 27.9% |
| Uruguay | 26.5% |
| Spain | 26.5% |
The indicator itself cannot establish why these rates are high. Hiring demand, economic growth, the pace at which new entrants move from school to work, the mix of industries, labor-market institutions, informality, geography and survey practice can all matter. Because this is a national-estimate series, country statistics may also differ in survey design and operational definitions. Large gaps are still informative, but fine rankings separated by only a small fraction of a percentage point should not be treated as precise measures of underlying policy performance.
Very low rates require context too
At the bottom of the reported distribution, Qatar is at 0.5%, followed by Guatemala at 3.8%, Japan at 4.0%, Bolivia at 4.3%, and both Israel and Thailand at about 4.6%. Moldova, Tanzania, Argentina and the United Arab Emirates complete the ten lowest observations. The average for the bottom ten is 4.1%, far below the top-ten average.
| Economy | Youth unemployment rate |
|---|---|
| Qatar | 0.5% |
| Guatemala | 3.8% |
| Japan | 4.0% |
| Bolivia | 4.3% |
| Israel | 4.6% |
| Thailand | 4.6% |
| Moldova | 4.6% |
| Tanzania | 4.7% |
| Argentina | 5.1% |
| United Arab Emirates | 5.2% |
A low youth unemployment rate says that relatively few labor-force participants ages 15–24 are unemployed. It does not say that most young people are working. If a large share is in full-time education and not looking for work, the labor-force denominator can be relatively small. Discouraged workers who stop actively searching may also move outside the conventional unemployment measure. That is why employment-to-population ratios, labor-force participation and the share of young people not in employment, education or training provide essential context.
The denominator is the youth labor force, not the entire youth population
A 20% youth unemployment rate should not be translated as “one in five young people is unemployed.” It means one in five participants in the youth labor force is unemployed under the statistical definition. Someone who is 20 years old, enrolled in education and not seeking work is generally outside the labor force and therefore outside both the numerator and denominator. This distinction becomes especially important when comparing economies where the age of labor-market entry, educational participation and the prevalence of part-time student work differ sharply.
The indicator is best understood as a measure of difficulty finding work among young people who are already attached to the labor market. An employment-to-population ratio answers a different question: what share of all people ages 15–24 are employed? A participation rate asks how many are working or looking for work. A NEET rate focuses on young people who are neither employed nor in education or training. None of these measures is redundant; together they separate job-search difficulty from the size and composition of the youth labor force.
A one-year snapshot does not show whether conditions are improving
The 2024 comparison is cross-sectional. It shows where reporting economies stand relative to one another in that year, but it does not reveal whether an economy has improved since 2023 or deteriorated relative to the years before the pandemic. Youth labor markets can respond quickly to business cycles, hiring freezes, sector-specific shocks and the timing of school-to-work transitions. A time series using the same indicator is needed to separate a persistently high rate from a temporary spike.
Historical values in international databases can also be revised when national statistical agencies update source data. For trend analysis, it is safer to retrieve several years from the same current data release rather than stitching together files downloaded at different times. This article therefore limits its quantitative claims to the 2024 cross-section and does not infer long-run improvement or deterioration from a single observation.
National estimates are useful but not perfectly harmonized
The phrase “national estimate” matters. The World Bank series draws on national statistical sources, and the accompanying definition notes that concepts of labor force and unemployment differ by country. The 15–24 age bracket is consistent in the indicator title, but survey frequency, reference periods, treatment of borderline work and details of job-search criteria can vary. International comparisons are therefore strongest when they focus on broad differences, distributions and orders of magnitude rather than tiny gaps between neighboring ranks.
A two-percentage-point difference may not carry the same substantive meaning in every pair of countries. At the same time, a contrast between a single-digit rate and a rate above 40% is large enough to signal very different observed labor-market outcomes among participants, even though additional evidence is still needed to explain the mechanisms. Sectoral hiring, education completion, urban-rural patterns, wages, informality and vacancy data can help turn the descriptive comparison into a deeper labor-market diagnosis.
Missing observations were preserved as missing
The country-and-economy master contains 217 rows. Only 103 have a reported 2024 value, while 114 are marked as source-missing. All summary statistics, quartiles, thresholds and rankings use the 103 valid observations only. No missing observation was replaced with zero. Doing so would falsely classify countries without data as having the lowest possible unemployment rate and would materially distort both the distribution and the map.
Of the 103 reported observations, 96 can be attached to polygons in the low-resolution Natural Earth boundary used for the visualization. Barbados, Hong Kong SAR, St. Lucia, Malta, Mauritius, Singapore and Seychelles have reported values but are not represented as separate polygons in this particular boundary file. Their values remain in the tables and statistical calculations. A blank or uncolored area on this map therefore does not always mean that the source value is missing.
Five checks make the youth unemployment rate easier to interpret
- Confirm the denominator: the labor force ages 15–24, not all people in that age group.
- Compare the employment-to-population ratio to see how many young people are actually working.
- Check labor-force participation to distinguish low unemployment from low market participation.
- Use the NEET rate to capture some young people who are outside both work and education or training.
- Review a consistent time series before labeling a one-year value as improvement or deterioration.
These checks prevent common mistakes. A high unemployment rate can coexist with strong labor-force participation if many young people are actively looking for jobs. A low unemployment rate can coexist with weak employment if few young people are participating in the labor market. A high NEET rate can expose exclusion that the unemployment rate does not capture. The measures answer different questions, and a balanced reading uses the denominator of each indicator rather than treating them as interchangeable percentages.
Source and calculation method
The analysis uses the World Bank indicator Unemployment, youth total (% of total labor force ages 15-24) (national estimate), code SL.UEM.1524.NE.ZS. Aggregate regional groups were excluded, leaving a 217-economy country master. For 2024, 103 rows contain a numerical observation and 114 remain source-missing. The mean, median, quartiles, threshold counts and top/bottom rankings were calculated directly from those 103 reported values without imputation.
The map joins ISO3 codes to a low-resolution Natural Earth world boundary. 96 reporting economies match a polygon after standard code handling; seven small or separately reported economies have values but no separate polygon in this boundary. The unit is percent of the labor force ages 15–24. Missing observations remain no data rather than zero, and the map is used as a spatial overview rather than as a substitute for the numerical table.
Frequently Asked Questions
Does a 20% youth unemployment rate mean one in five young people is unemployed?
No. The denominator is the labor force ages 15–24, not the entire population in that age group. Young people outside the labor force, such as many full-time students who are not seeking work, are not included.
Is a low youth unemployment rate always a sign of strong youth employment?
No. A low rate can coexist with low labor-force participation. Employment-to-population, participation and NEET rates provide additional information about how many young people are working or outside the labor market.
Were economies without a 2024 value treated as zero?
No. The source has 114 missing economies for 2024. They remain missing and are excluded from the distribution statistics and rankings.
Related Articles
Green Map creates custom-edited map images using open geographic data sources such as geoBoundaries, Natural Earth, OpenStreetMap, and government open data. These maps are edited visual materials, not raw data files, and are provided for education, documents, presentations, and graphic reference.