The World Bank indicator NY.GDP.PCAP.CN reports GDP per capita in current local currency units (LCU). It is still GDP divided by population, but the monetary unit changes from one economy to another. A value expressed in yen is not on the same numerical scale as a value expressed in rupees, rupiah, pounds, euros, or another local currency. That makes the raw numbers useful for domestic nominal analysis but unsuitable for a single worldwide ranking by magnitude.
This article therefore does not color countries by the size of their current-LCU values. Instead, the map answers a question that is genuinely comparable across the dataset: how recent is each economy’s latest observation? The verified table contains 214 countries and economies. 186 have a 2025 observation, 15 have 2024 as the latest year, 4 have 2023, and 9 have a latest observation from 2022 or earlier. This distinction matters before any cross-country comparison is attempted.
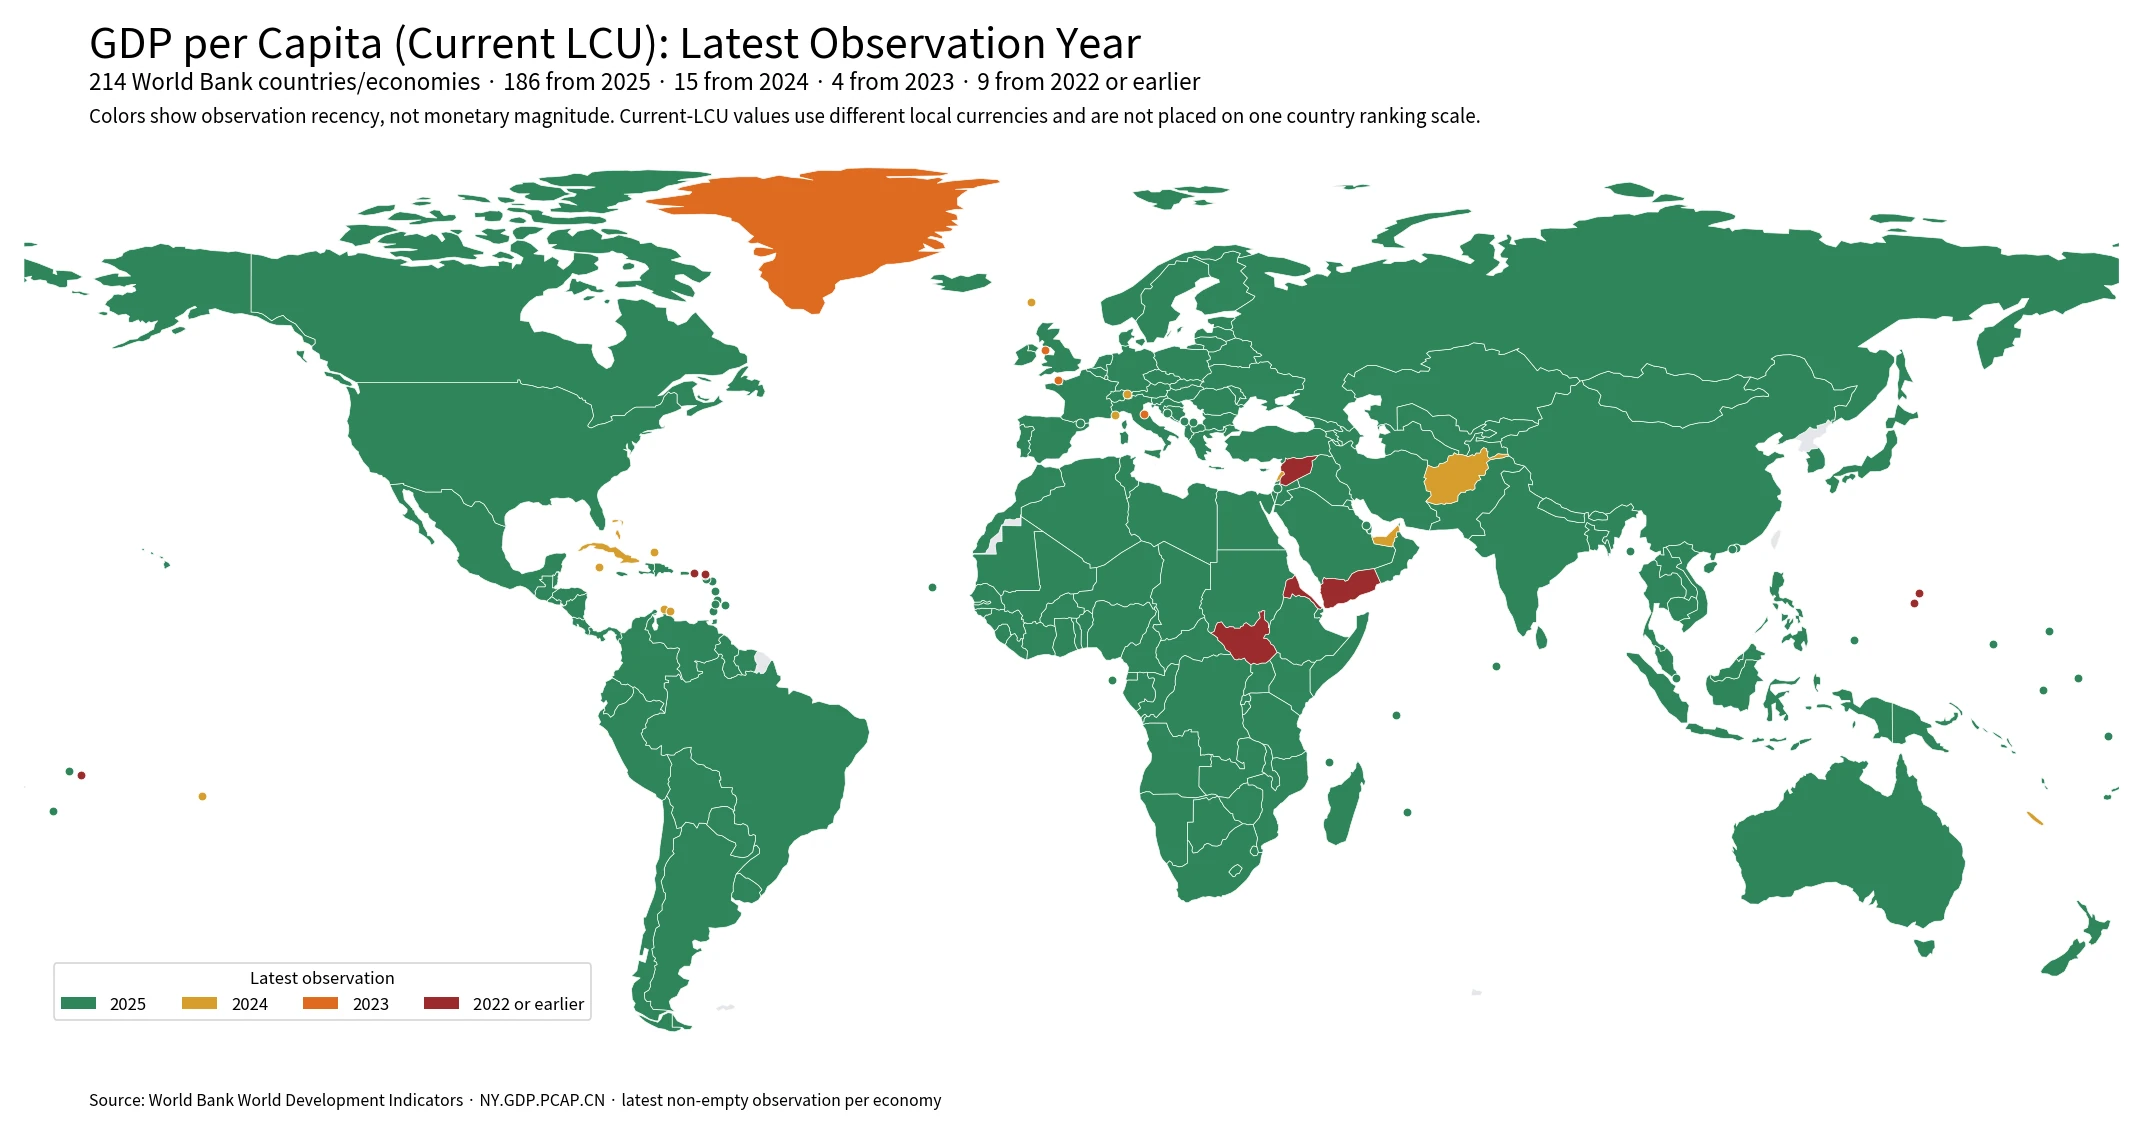
Table of Contents
What current LCU means
LCU stands for local currency unit. In this World Bank series, each observation is recorded in the currency unit used for that economy’s national accounts. The word current means the values are measured at current prices rather than after removing price changes. A rise in current-LCU GDP per capita can therefore reflect a combination of real output growth, domestic inflation, and population change. It should not automatically be read as an equal rise in real purchasing power or living standards.
GDP per capita itself is an average production measure, not a measure of the wage received by a typical person. It does not show the income distribution, the median household income, or the amount of disposable income people can spend. These conceptual limits apply to all GDP-per-capita series. The current-LCU version adds another limitation for international work: the unit is not common across countries, so raw numerical magnitudes cannot be compared as if they were dollars on one scale.
Most observations are from 2025, but not all of them
All 214 rows in the supplied table contain a numeric value, but the observation years are not uniform. There are 186 values from 2025, 15 from 2024, 4 from 2023, and 9 from 2022 or earlier. About 86.9% of the economies therefore have a 2025 value. The remaining 28 should not be silently mixed into a “2025 country ranking,” because their numbers describe an earlier economic period.
| Latest observation year | Countries/economies | Share of 214 |
|---|---|---|
| 2025 | 186 | 86.9% |
| 2024 | 15 | 7.0% |
| 2023 | 4 | 1.9% |
| 2022 or earlier | 9 | 4.2% |
The map makes this time dimension visible. Most larger country areas fall into the 2025 category, while older observations appear among several fragile economies and small or separately reported territories. That is a data-recency pattern, not an income pattern. Two countries can have the same map color even when their economic levels are very different, because the color only says that their latest observation comes from the same year.
Why a raw current-LCU country ranking would be misleading
Local currency units have different face values. Ten thousand units of one currency may represent far more or far less purchasing power than ten thousand units of another. Some currencies are quoted in very small denominations, producing numerically large GDP-per-capita figures, while others use units with much larger face values. Without currency conversion, the number of digits is partly a property of the monetary unit rather than a direct measure of economic performance.
The following examples are included only to show the issue. They are not ranked. Each row is the latest raw value in that economy’s own local currency. The values should be read within the relevant national currency system, not compared vertically as if they shared one unit.
| Economy | Latest year | Raw GDP per capita (current LCU) | How to read it |
|---|---|---|---|
| Australia | 2025 | 100,632 | Nominal GDP per person in that economy’s local currency |
| Brazil | 2025 | 59,858 | Nominal GDP per person in that economy’s local currency |
| Germany | 2025 | 53,537 | Nominal GDP per person in that economy’s local currency |
| India | 2025 | 236,000 | Nominal GDP per person in that economy’s local currency |
| Indonesia | 2025 | 83,371,834 | Nominal GDP per person in that economy’s local currency |
| Japan | 2025 | 5,380,359 | Nominal GDP per person in that economy’s local currency |
Indonesia, Japan, India, Germany, Brazil, and Australia can all display very different numerical ranges even when the underlying economic question is simply GDP per person. A logarithmic color scale does not fix the problem. A log transformation can compress a wide numeric range, but it cannot turn rupiah, yen, rupees, euros, reais, and Australian dollars into a common economic unit. A visually smooth choropleth would therefore create a false impression of comparability.
Use a different GDP-per-capita series for cross-country levels
For a nominal cross-country comparison in one currency, the World Bank current-US-dollar series NY.GDP.PCAP.CD is more appropriate. Converting all observations into US dollars removes the simple unit mismatch, although the resulting values can move sharply when market exchange rates change. A country can experience a substantial dollar decline even when its local-currency nominal GDP is still rising if its currency depreciates strongly.
For comparisons that focus more on the quantity of goods and services people can buy, purchasing-power-parity GDP per capita is often more informative. PPP conversion adjusts for differences in price levels and expresses values in international dollars. It answers a different question from market-exchange-rate dollars and a very different question from current LCU. Neither should be treated as a universal replacement; the right series depends on whether the analysis is about domestic nominal accounting, market-currency size, purchasing power, or real growth.
For growth through time, a constant-price GDP-per-capita series or a real growth rate is usually preferable. Current-price local-currency values include inflation. If prices rise quickly, nominal GDP per capita can increase even when real output per person changes little. In other words, the fact that current LCU avoids exchange-rate conversion does not mean it removes inflation. It simply keeps the accounting in the domestic currency.
Older latest observations need separate treatment
Several economies have a latest value well before 2025. Eritrea’s latest observation in this table is from 2011, South Sudan’s from 2015, Yemen’s from 2018, and the French part of St. Martin’s from 2021. American Samoa, Guam, the Northern Mariana Islands, the Syrian Arab Republic, and the U.S. Virgin Islands are latest in 2022. The Channel Islands, Greenland, the Isle of Man, and San Marino are latest in 2023. These are not missing values—the dataset contains numbers—but they are old observations relative to the 2025 majority.
| Economy | Latest observation year | Raw GDP per capita (current LCU) |
|---|---|---|
| Eritrea | 2011 | 10,588 |
| South Sudan | 2015 | 3,893 |
| Yemen, Rep. | 2018 | 339,700 |
| St. Martin (French part) | 2021 | 18,320 |
| American Samoa | 2022 | 18,017 |
| Guam | 2022 | 41,833 |
| Northern Mariana Islands | 2022 | 23,786 |
| Syrian Arab Republic | 2022 | 3,963,152 |
| Virgin Islands (U.S.) | 2022 | 44,321 |
| Channel Islands | 2023 | 60,007 |
| Greenland | 2023 | 403,041 |
| Isle of Man | 2023 | 72,421 |
| San Marino | 2023 | 55,371 |
The 15 economies whose latest value is from 2024 also differ from the 2025 group by one year. That difference may be modest in stable conditions, but it can become important during high inflation, rapid growth, recession, currency reform, or major statistical revisions. A map that explicitly displays observation year helps readers see this issue before interpreting a table of values.
Where current-LCU GDP per capita is useful
The series is valuable for domestic nominal analysis. Within one economy, it can be compared with other current-LCU national-accounts variables, provided the definitions and periods are aligned. It also allows analysts to inspect nominal changes without first introducing an exchange-rate conversion. When a dollar-denominated GDP-per-capita series falls sharply while the current-LCU series continues to rise, that contrast can be a clue that exchange-rate movements are an important part of the change.
The series can also serve as a building block for ratios calculated within the same currency and year. Because numerator and denominator share a local monetary unit, the unit can cancel when constructing certain shares. However, this requires carefully matched definitions and time periods. The supplied package contains only the latest observation per economy, so a serious time-series study would require the full historical series rather than treating one latest row as a trend.
Long historical analysis also needs attention to currency redenomination, extreme inflation, and national-accounts revisions. A country may change the number of currency units used to express prices, and statistical agencies can revise GDP methods or base years. World Bank harmonization improves comparability, but unusually large monetary changes still warrant checking indicator metadata and the relevant national statistical documentation before drawing strong conclusions.
Four rules for reading the map and the data
- The map shows observation year, not the level of GDP per capita.
- Raw current-LCU values should not be sorted into one worldwide magnitude ranking because local currency units differ.
- 186 of the 214 economies have 2025 values; the other 28 use 2024 or earlier latest observations and should be separated in same-year analysis.
- Use current US$ for one-currency nominal comparisons, PPP for price-level-adjusted comparisons, and constant-price series for real changes over time.
Source and scope
The source is World Bank World Development Indicators, NY.GDP.PCAP.CN. The supplied dataset contains the most recent non-empty observation for each of 214 countries and economies. Because it is a latest-available table rather than a single-year cross section, the observation-year map is an essential part of interpreting the coverage. No missing values were converted to zero, and no raw current-LCU monetary magnitudes were used to create the map colors.
This indicator alone cannot answer questions about household income, poverty, inequality, purchasing power, or real living standards. GDP per capita is an economy-wide average production measure, and current LCU is a nominal domestic-currency unit. Cross-country comparisons require a common conversion method chosen for the question being asked, while trend analysis requires attention to inflation and changes in currency or statistical methodology.
Frequently Asked Questions
Can GDP per capita in current LCU be used for a global country ranking?
Not by comparing the raw monetary numbers directly. Each economy uses a different local currency unit, so numerical magnitude partly reflects the currency denomination. A common-currency series is more appropriate for cross-country nominal levels.
Why does the map show observation year instead of GDP-per-capita level?
Observation year is comparable across all rows, while current-LCU monetary magnitudes are not on one common unit. The map separates 2025 observations from 2024 and older latest values.
How is current LCU different from PPP GDP per capita?
Current LCU reports nominal GDP per person in each economy’s own currency. PPP converts values using price-level comparisons and is designed for international comparisons of purchasing power.
What is current-LCU GDP per capita useful for?
It is useful for domestic nominal analysis, comparisons with other same-currency national-accounts variables, and examining changes before exchange-rate conversion. Historical analysis still needs inflation and currency-methodology checks.
Related Articles
Green Map creates custom-edited map images using open geographic data sources such as geoBoundaries, Natural Earth, OpenStreetMap, and government open data.
These maps are edited visual materials, not raw data files, and are provided for education, documents, presentations, and graphic reference.