Direct household payments for health care differ enormously in dollar terms across countries. In the World Bank latest-value extract used here, 193 countries and areas range from $0.77 to $2,595.63 per person. The median of those latest observations is $120.54 and the simple country-level mean is $273.86. Those figures are descriptive, not a synchronized 2024 world average: 169 observations are dated 2023, 22 are from 2024, Ukraine is from 2021, and Cuba is from 2020.
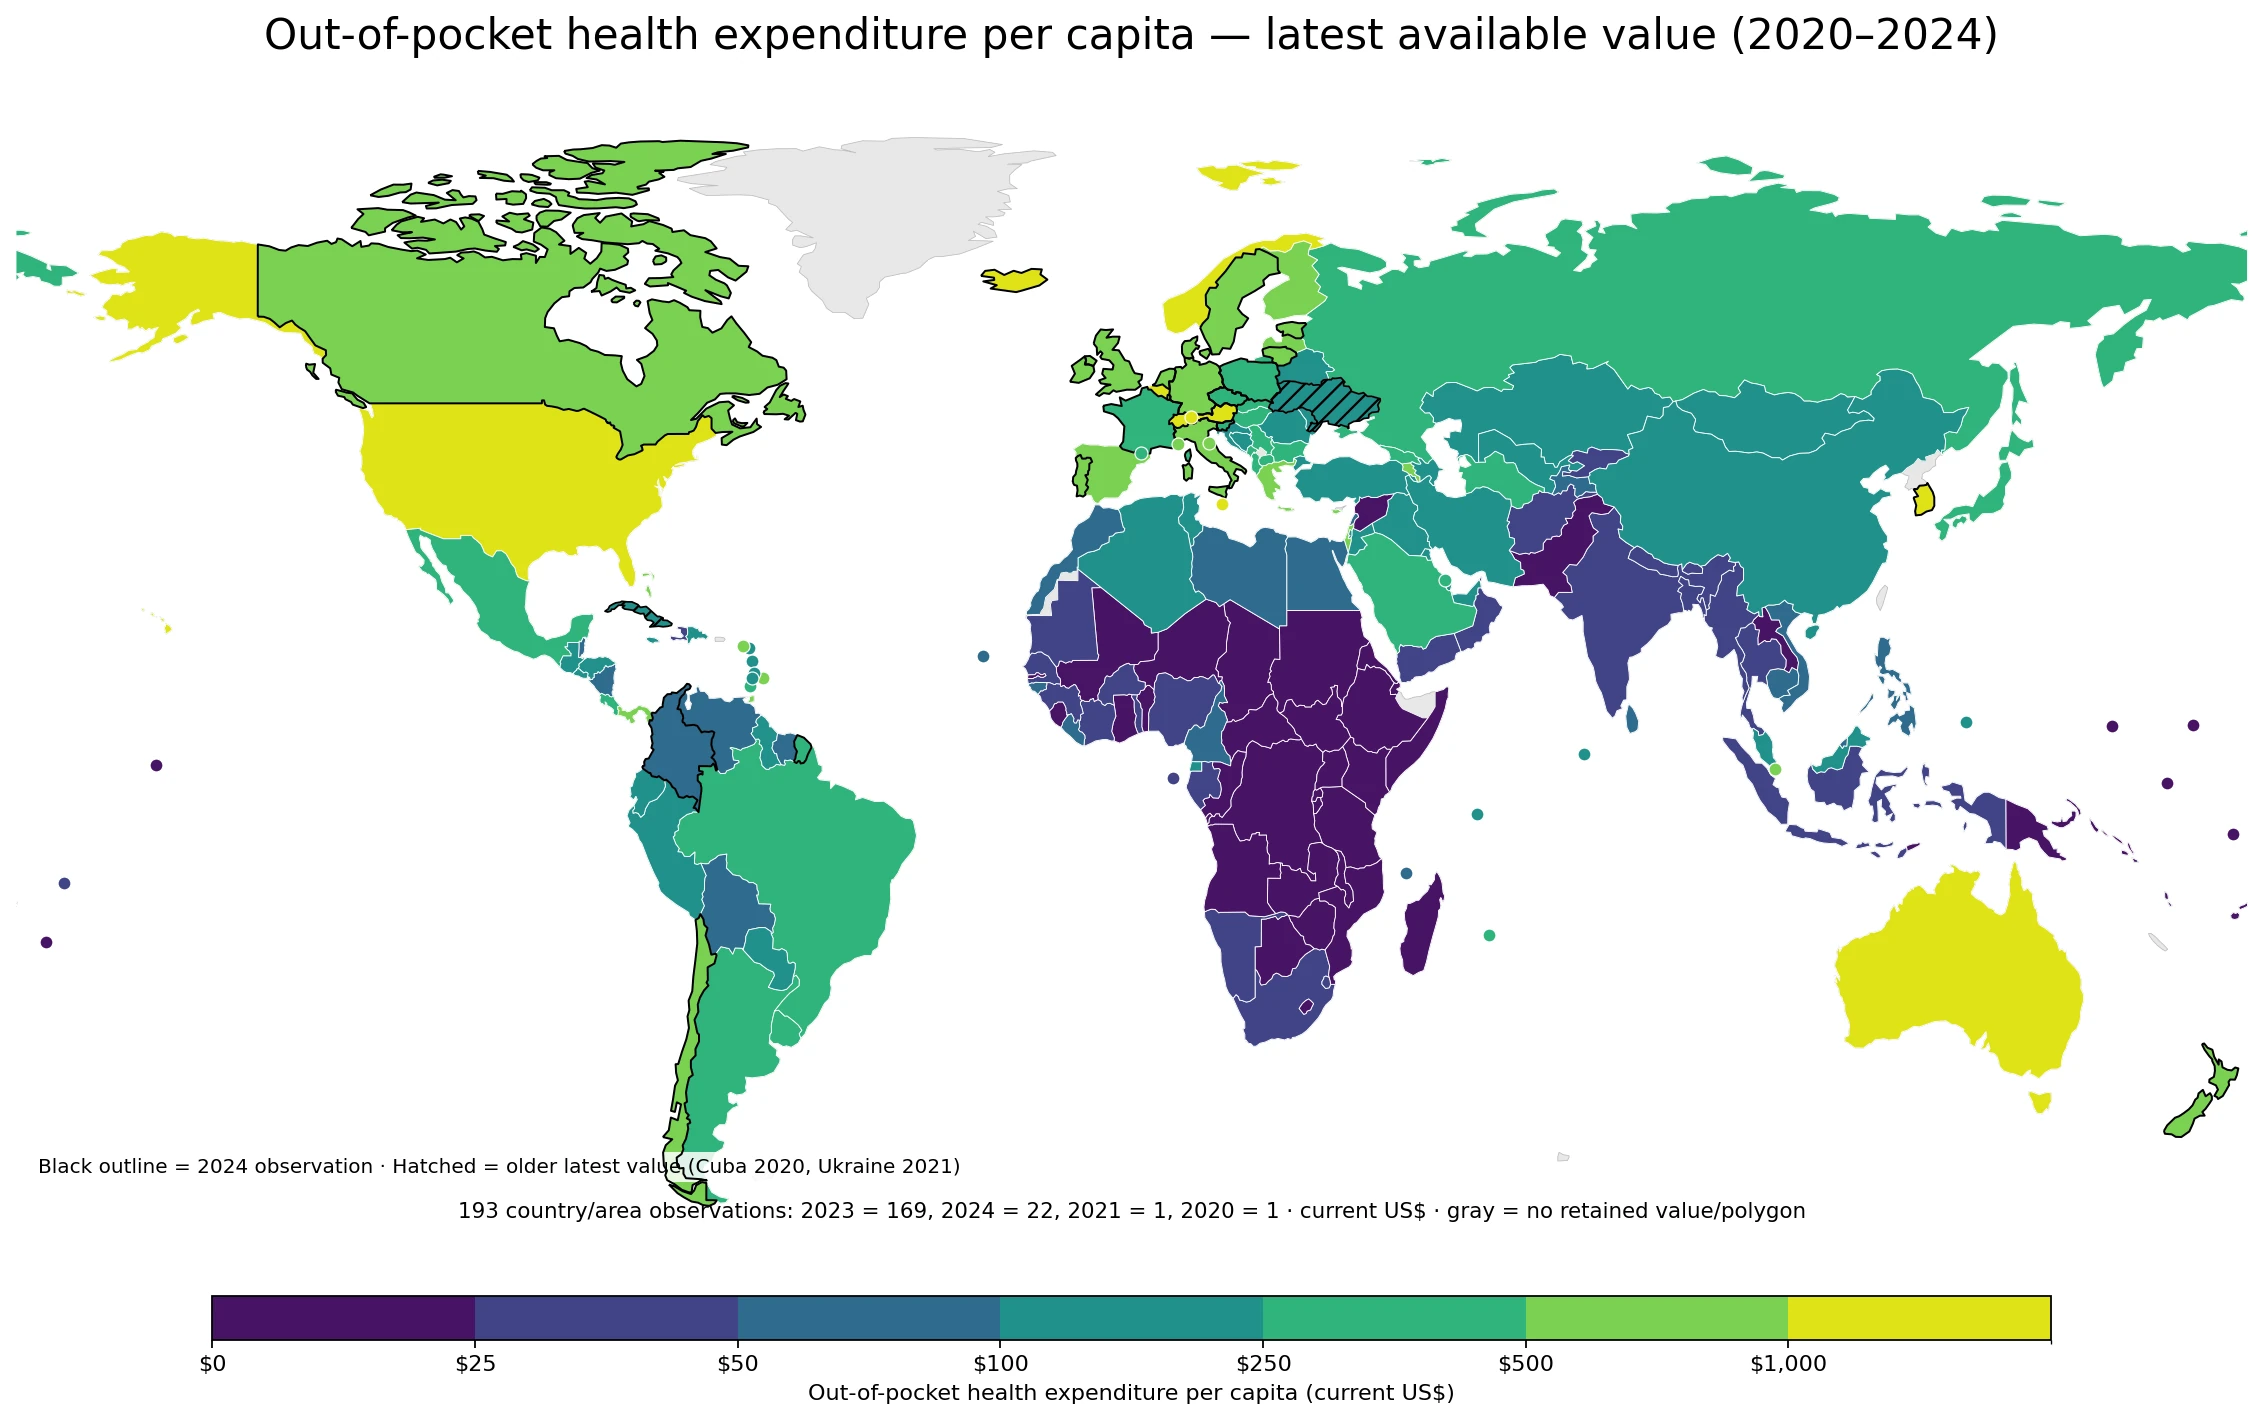
Table of Contents
What does out-of-pocket health expenditure per capita measure?
The World Bank series SH.XPD.OOPC.PC.CD is sourced from the World Health Organization Global Health Expenditure Database. WHO defines the indicator as household out-of-pocket health expenditure, classified as HF.3 in the System of Health Accounts framework, divided by population. Its unit is current US dollars.
Per capita does not mean every resident personally paid the reported amount. It is an aggregate total divided by the whole population, including people who did not use health services in that year. Actual payments are unevenly distributed across households. The measure also should not be confused with insurance premiums, government-financed care, or the percentage of national health spending financed directly by households.
The 193 latest values span 2020 to 2024
The source extract keeps the most recent non-missing observation available for each country or area. That design explains why the metadata can identify 2024 as the newest year while most rows are actually from 2023. Treating all 193 values as a 2024 cross-section would therefore misstate the data.
| Latest observation year | Countries/areas |
|---|---|
| 2024 | 22 |
| 2023 | 169 |
| 2021 | 1 (Ukraine) |
| 2020 | 1 (Cuba) |
A total of 191 of the 193 observations are from 2023 or 2024, so the extract is far more current than many mixed-year global datasets. Even so, current-US-dollar spending is sensitive to exchange rates and nominal price changes. The map is best read as a latest-available geographic snapshot, while any fine same-year ranking should be rebuilt from a synchronized time slice.
The latest-value median is $120.54, while the mean is $273.86
Giving each of the 193 geographic observations equal weight produces a median of $120.54, a simple mean of $273.86, a first quartile of $32.28, and a third quartile of $354.97. The mean is more than twice the median because a relatively small group of observations above $1,000 stretches the upper tail. This is not a population-weighted estimate of what the average person in the world paid.
| Latest out-of-pocket spending per person | Countries/areas |
|---|---|
| Below $25 | 43 |
| $25 to below $50 | 25 |
| $50 to below $100 | 21 |
| $100 to below $250 | 40 |
| $250 to below $500 | 25 |
| $500 to below $1,000 | 29 |
| $1,000 or more | 10 |
Sixty-eight observations are below $50 and 89 are below $100. At the other end, 39 are at least $500 and 10 exceed $1,000. The wide spread is why a single global-looking average is less informative than the map and distribution bands together.
Switzerland and Liechtenstein have the highest latest observations
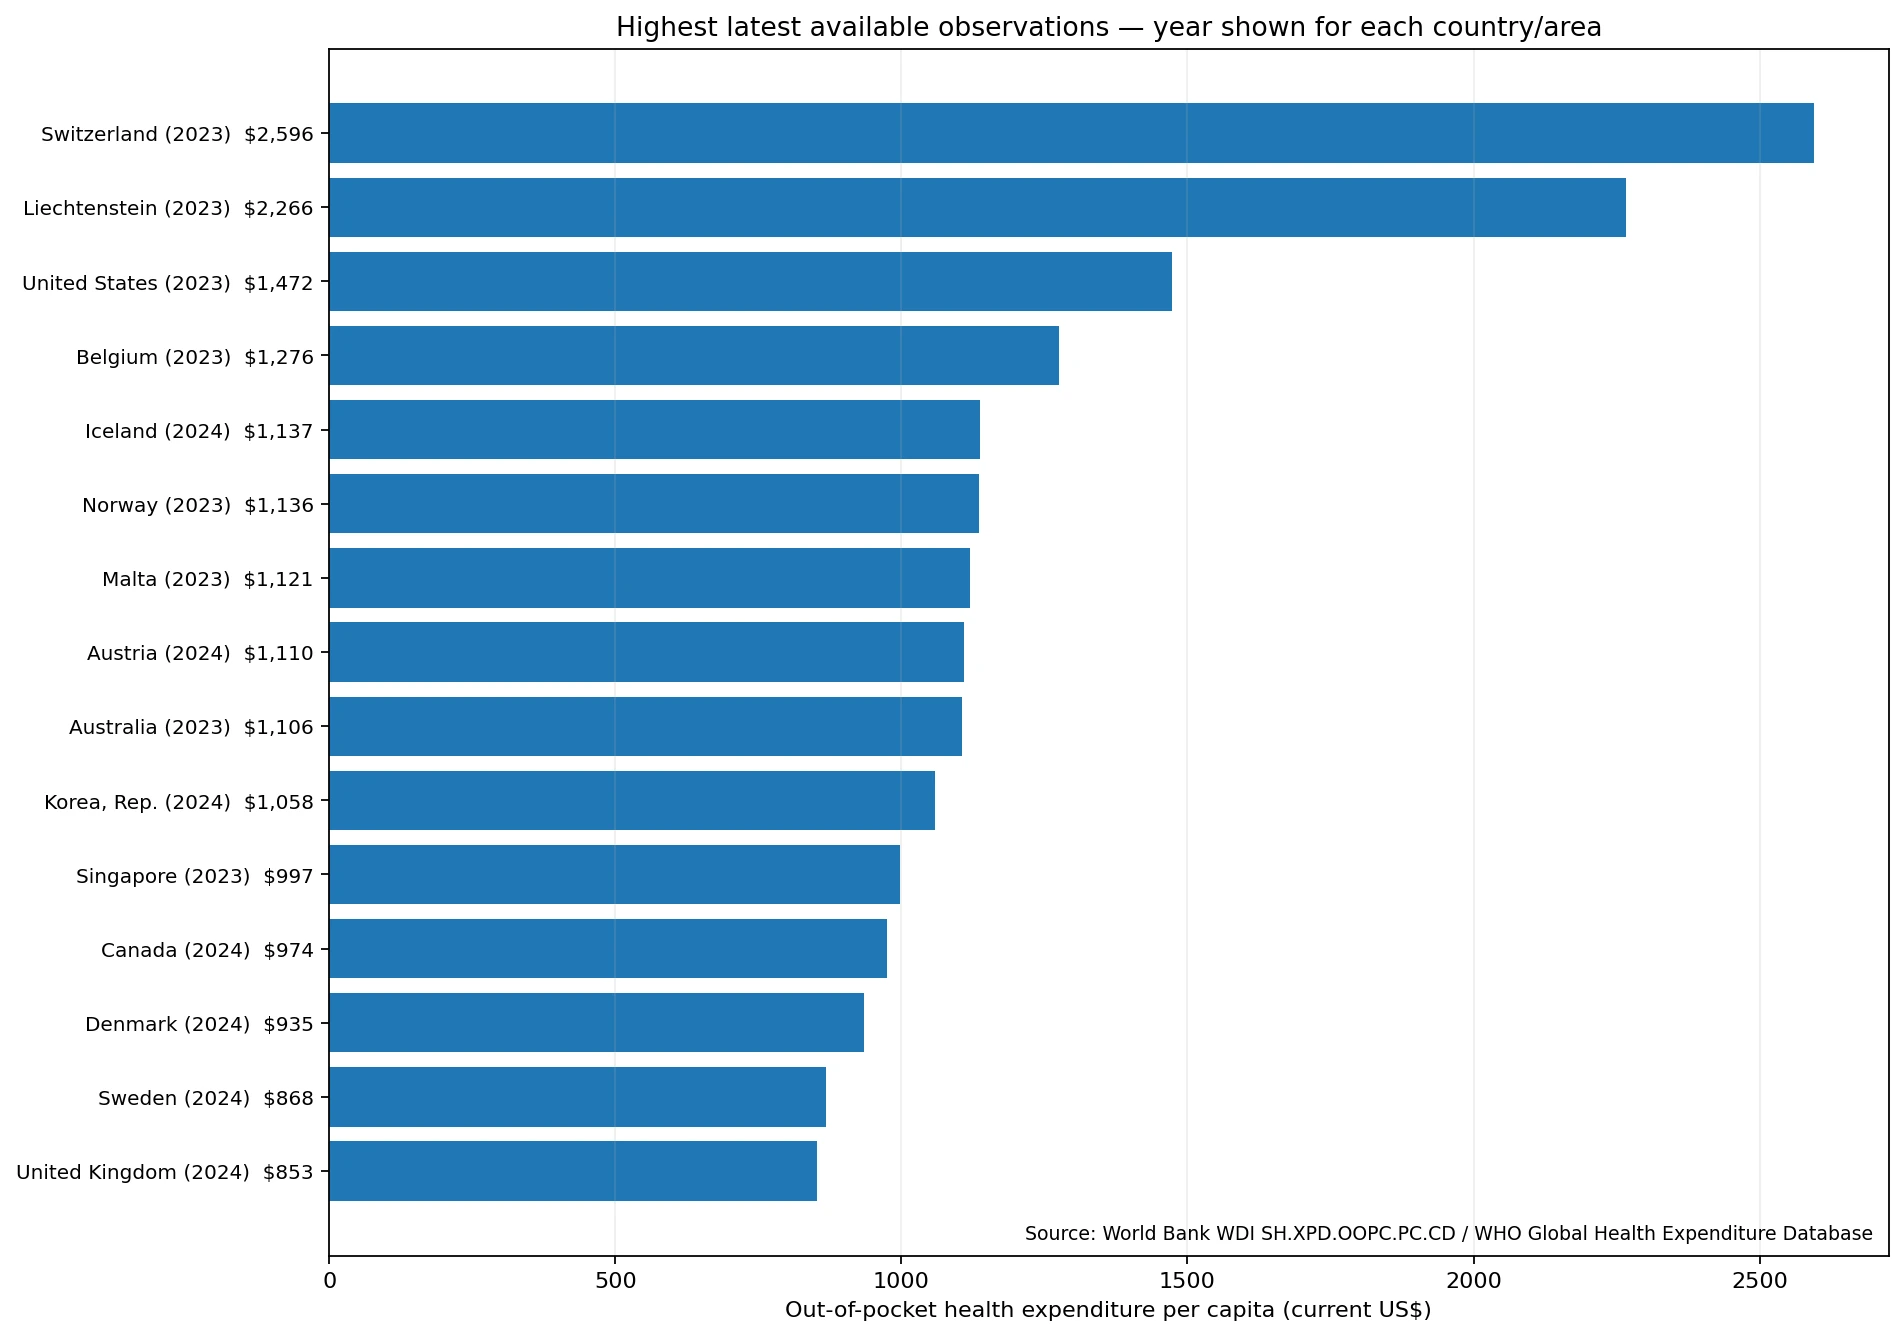
Switzerland records $2,595.63 per person in 2023 and Liechtenstein $2,266.48 in 2023. The United States is $1,472.25 in 2023 and Belgium $1,275.75 in 2023. Iceland reaches $1,137.06 in 2024, Norway $1,135.54 in 2023, Malta $1,120.58 in 2023, Austria $1,109.61 in 2024, and Australia $1,106.32 in 2023.
Those high dollar amounts show where households paid large out-of-pocket sums per person in nominal US-dollar terms. They do not by themselves establish that financial protection is worse or that the health system performs poorly. Income, medical prices, service use, exchange rates, insurance design and public financing all differ across countries. A burden measure needs a denominator such as household resources or total current health expenditure.
Several of the lowest latest observations are in small Pacific states and sub-Saharan Africa
The lowest retained value is Tuvalu at $0.77 in 2023. Rwanda is $2.16, the Solomon Islands $3.52, Madagascar $4.78, Malawi $4.95 and Mozambique $5.49, all in 2023. Zimbabwe, Somalia, Burundi and Kiribati are also around $7 per person.
A low dollar amount is not automatically evidence of strong financial protection. It can coexist with low service use, low prices, public or external financing, or unmet need. This one series does not identify which mechanism produced the result, so the lower end should be interpreted as spending levels rather than a score of health-system quality.
The map shows a high-dollar cluster in North America and much of western and northern Europe
North America and many western and northern European countries sit in the $500-and-above bands, while much of sub-Saharan Africa is below $100. Australia is above $1,000. East Asia and Latin America are more mixed: Japan is $445.16 in 2023, China $245.61, Mexico $313.80 and Brazil $264.89.
That geography is descriptive. Current-US-dollar values combine domestic spending levels with exchange rates and price structures, and the indicator alone cannot tell us why one region is higher than another. Purchasing-power-adjusted spending, the out-of-pocket share of current health expenditure, government financing and service-use indicators are better companions for causal or affordability questions.
Selected countries illustrate why the year belongs next to the value
The latest observation year differs even among large economies. The Republic of Korea is $1,058.29 in 2024; Canada is $974.38, the United Kingdom $852.98, Germany $733.33 and France $491.58, all in 2024. The United States, Australia, Japan, China, Brazil and India use 2023 in this extract. The table below is therefore a latest-value reference, not a common-year league table.
| Country | Latest year | Out-of-pocket health expenditure per capita |
|---|---|---|
| United States | 2023 | $1,472.25 |
| Australia | 2023 | $1,106.32 |
| Korea, Rep. | 2024 | $1,058.29 |
| Canada | 2024 | $974.38 |
| United Kingdom | 2024 | $852.98 |
| Germany | 2024 | $733.33 |
| France | 2024 | $491.58 |
| Japan | 2023 | $445.16 |
| Mexico | 2023 | $313.80 |
| Brazil | 2023 | $264.89 |
| China | 2023 | $245.61 |
| Nigeria | 2023 | $48.05 |
| India | 2023 | $37.16 |
| South Africa | 2023 | $35.91 |
Absolute dollar spending and financial burden are different questions. A high-income country can have a large per-capita amount while that amount represents a smaller share of household resources or total health spending. A lower-income country can show a much smaller dollar amount while direct payments still create serious hardship for some households.
Current US dollars are not purchasing-power-adjusted
The unit here is current US dollars. It is a nominal conversion at the exchange rates relevant to the observation year, not a constant-price series and not a purchasing-power-parity measure. Exchange-rate movements can change the US-dollar value even when local-currency spending moves differently. For cross-country comparisons focused on real purchasing power, the companion PPP out-of-pocket expenditure per capita series is more appropriate.
A different companion indicator answers the financing-share question. WHO reports out-of-pocket expenditure as a percentage of current health expenditure. A country can rank high in dollar amount but lower in share, or vice versa, because total health spending and income levels differ.
Source and mapping method
The statistical series is World Bank World Development Indicators SH.XPD.OOPC.PC.CD, sourced from the WHO Global Health Expenditure Database. WHO’s official indicator metadata defines the numerator as household out-of-pocket health expenditure (HF.3), divides it by population and reports the result in US dollars. The World Bank indicator page currently shows the series extending through 2024.
The map joins the 193 supplied latest observations to a Natural Earth low-resolution world layer using ISO-3 codes. A total of 165 observations match visible country polygons and 28 small countries or areas are added as point markers, so no statistical row is silently discarded. Missing values are not converted to zero. Because the distribution is highly skewed, the map uses fixed dollar bands of $0–25, $25–50, $50–100, $100–250, $250–500, $500–1,000 and $1,000 or more.
Frequently Asked Questions
Does out-of-pocket expenditure per capita equal the hospital bill paid by the average individual?
No. It is total household out-of-pocket health expenditure divided by the entire population. People who did not use health services are still included in the denominator, so individual payments can differ widely.
Does a higher dollar amount mean households face greater financial hardship?
Not necessarily. The current-US-dollar amount is affected by prices, income, service use, exchange rates and financing arrangements. Financial hardship is better assessed with measures tied to household resources or the out-of-pocket share of health spending.
Can all 193 latest values be treated as 2024 data?
No. The extract contains 169 observations from 2023, 22 from 2024, one from 2021 and one from 2020. The year should remain attached to each value.
How is current US$ different from the PPP version of the indicator?
Current US$ converts nominal spending using exchange rates for the observation year. PPP-adjusted international dollars account for cross-country price-level differences and are often more useful for purchasing-power comparisons.
Related Articles
Out-of-pocket health spending and relative poverty focuses on the population pushed below a relative poverty line after direct health payments.
Domestic private health expenditure as a share of current health expenditure covers the broader private financing mix, including more than direct household payments alone.
Domestic government health expenditure as a share of current health expenditure provides the government-financing counterpart.
Green Map creates custom-edited map images using open geographic data sources such as geoBoundaries, Natural Earth, OpenStreetMap, and government open data.
These maps are edited visual materials, not raw data files, and are provided for education, documents, presentations, and graphic reference.