Europe’s population density looks very different when the comparison moves below the national level. The verified Eurostat table used here contains 1,279 NUTS 3 regions for 2024. At the top of the distribution, Paris records 20,147.8 people per km². At the other end, Landsbyggð in Iceland records just 1.4 people per km². That enormous spread is the central finding: a single continental or national average cannot describe the local density experienced across Europe’s statistical regions.
This is a data-focused Insight rather than a downloadable map page. The useful question is not simply which country is crowded. It is where density is concentrated at the NUTS 3 level, which regions sit far below the middle of the distribution, and how the values moved between 2023 and 2024 where a valid comparison is available.
Table of Contents
What the 2024 NUTS 3 density data shows
The median 2024 density across all 1,279 entries is 120.4 people per km². The first quartile is about 61.5 and the third quartile about 283.0, so half of the regions fall between roughly 61.6 and 283.0 people per km². That middle band is useful, but it does not capture the extremes that make the regional pattern so uneven.
There are 125 regions above 1,000 people per km², including a much smaller group of 12 above 5,000. At the low end, 15 regions are below 10 people per km². Those tails explain why the simple arithmetic mean, about 405.0 people per km², is much higher than the median. A handful of very dense regions pull the mean upward, so it should not be treated as a typical European regional density.

The comparison graphic above ranks the highest-density NUTS 3 regions in 2024. Paris stands well ahead of the rest, followed by Kentrikos Tomeas Athinon, Hauts-de-Seine, the Brussels-Capital arrondissement, and Bucureşti. The chart is useful because it keeps the focus on the statistical region rather than turning these values into country-level claims.
How to read a NUTS 3 comparison
Eurostat’s GISCO documentation describes NUTS as a three-level regional statistical hierarchy, with NUTS 3 as the smallest of those three levels. Each row in this dataset therefore refers to a statistical region, not a whole country. This matters because a dense metropolitan core and a much less dense region can both sit inside the same national border while producing completely different density values.
The table covers 35 country codes and 1,279 NUTS 3 entries, but the number of regions per country is not uniform. Germany alone contributes 400 rows, while some countries in the table have only one or a few NUTS 3 units. For that reason, counting how many regions from each country appear in the top ten would not be a fair national ranking. The analysis below stays at the regional level and uses distribution measures, rather than pretending every country has the same statistical structure.
The densest NUTS 3 regions
| Region | Country code | 2024 density (people/km²) | Change vs 2023 |
|---|---|---|---|
| Paris | FR | 20,147.8 | -0.316% |
| Kentrikos Tomeas Athinon | EL | 11,142.8 | -1.087% |
| Hauts-de-Seine | FR | 9,679.5 | +0.541% |
| Arr. de Bruxelles-Capitale/Arr. Brussel-Hoofdstad | BE | 7,827.4 | +0.736% |
| Bucureşti | RO | 7,426.4 | -0.466% |
| Notios Tomeas Athinon | EL | 7,410.0 | -0.997% |
| Seine-Saint-Denis | FR | 7,309.4 | +1.642% |
| Dytikos Tomeas Athinon | EL | 6,832.6 | -1.344% |
| Melilla | ES | 6,180.4 | +0.918% |
| Val-de-Marne | FR | 5,921.2 | +0.678% |
Paris is the clear high point at 20,147.8 people per km². Kentrikos Tomeas Athinon follows at 11,142.8, while Hauts-de-Seine reaches 9,679.5. The Brussels-Capital arrondissement stands at 7,827.4 and Bucureşti at 7,426.4. Several additional NUTS 3 areas associated with Athens and the Paris metropolitan area also appear near the top.
These figures should be read as local regional densities. A high value in one NUTS 3 unit does not mean the entire country has the same density. That distinction is precisely why this level of geography is useful: it separates exceptionally compact regions from the broader national pattern.
Why the regional spread is so wide
Only 12 of the 1,279 regions exceed 5,000 people per km², and 56 exceed 2,000. Those very dense cases are a small share of the dataset, yet their values are far above the median. At the other end, 228 regions fall below 50 people per km² and 71 are below 25.
The result is not a smooth distribution centered around one typical value. It is a long spread that includes dense capital and metropolitan statistical regions as well as sparsely populated northern and peripheral regions. That is why a regional table or map-like visualization adds more information than a single continental average.
The lowest-density regions
| Region | Country code | 2024 density (people/km²) | Change vs 2023 |
|---|---|---|---|
| Landsbyggð | IS | 1.4 | +0.000% |
| Finnmark/Finnmárku/Finmarkku | NO | 1.6 | +0.000% |
| Lappi | FI | 1.9 | +0.000% |
| Norrbottens län | SE | 2.6 | +0.000% |
| Jämtlands län | SE | 2.7 | +0.000% |
| Kainuu | FI | 3.4 | -2.857% |
| Guyane | FR | 3.6 | +2.857% |
| Västerbottens län | SE | 5.1 | +0.000% |
| Nordland/Nordlánnda | NO | 6.8 | +0.000% |
| Troms/Romsa/Tromssa | NO | 6.8 | +1.493% |
Landsbyggð in Iceland is the lowest entry at 1.4 people per km². Finnmark/Finnmárku/Finmarkku in Norway follows at 1.6, with Lappi in Finland at 1.9. Norrbottens län and Jämtlands län in Sweden are also below 3 people per km². These figures sit so far from the high-density end that they make the scale of Europe’s internal regional variation immediately visible.
A low density value should not be used as a shortcut for economic weakness, population decline, or quality of life. Density is simply population divided by area. Explaining why a region is sparse would require other evidence about settlement, land area, transport, geography, migration, or economic structure. Those variables are not included in the supplied dataset, so the interpretation here stops at the measured density and its recorded year-to-year movement.
What changed from 2023 to 2024
A valid 2023 comparison is available for 1,241 regions. Of those, 726 (58.5%) show a higher density in 2024, 402 (32.4%) show a decline, and 113 (9.1%) are recorded at no percentage change. The median year-over-year change among comparable regions is only +0.175%, which indicates that small movements are much more common than the most dramatic outliers.
The remaining 38 entries do not have a usable change value in the supplied table. They are excluded from the increase/decrease counts rather than being treated as zero change. That distinction is important because a missing comparison and an unchanged density are not the same thing.
Regions with the largest increases and declines
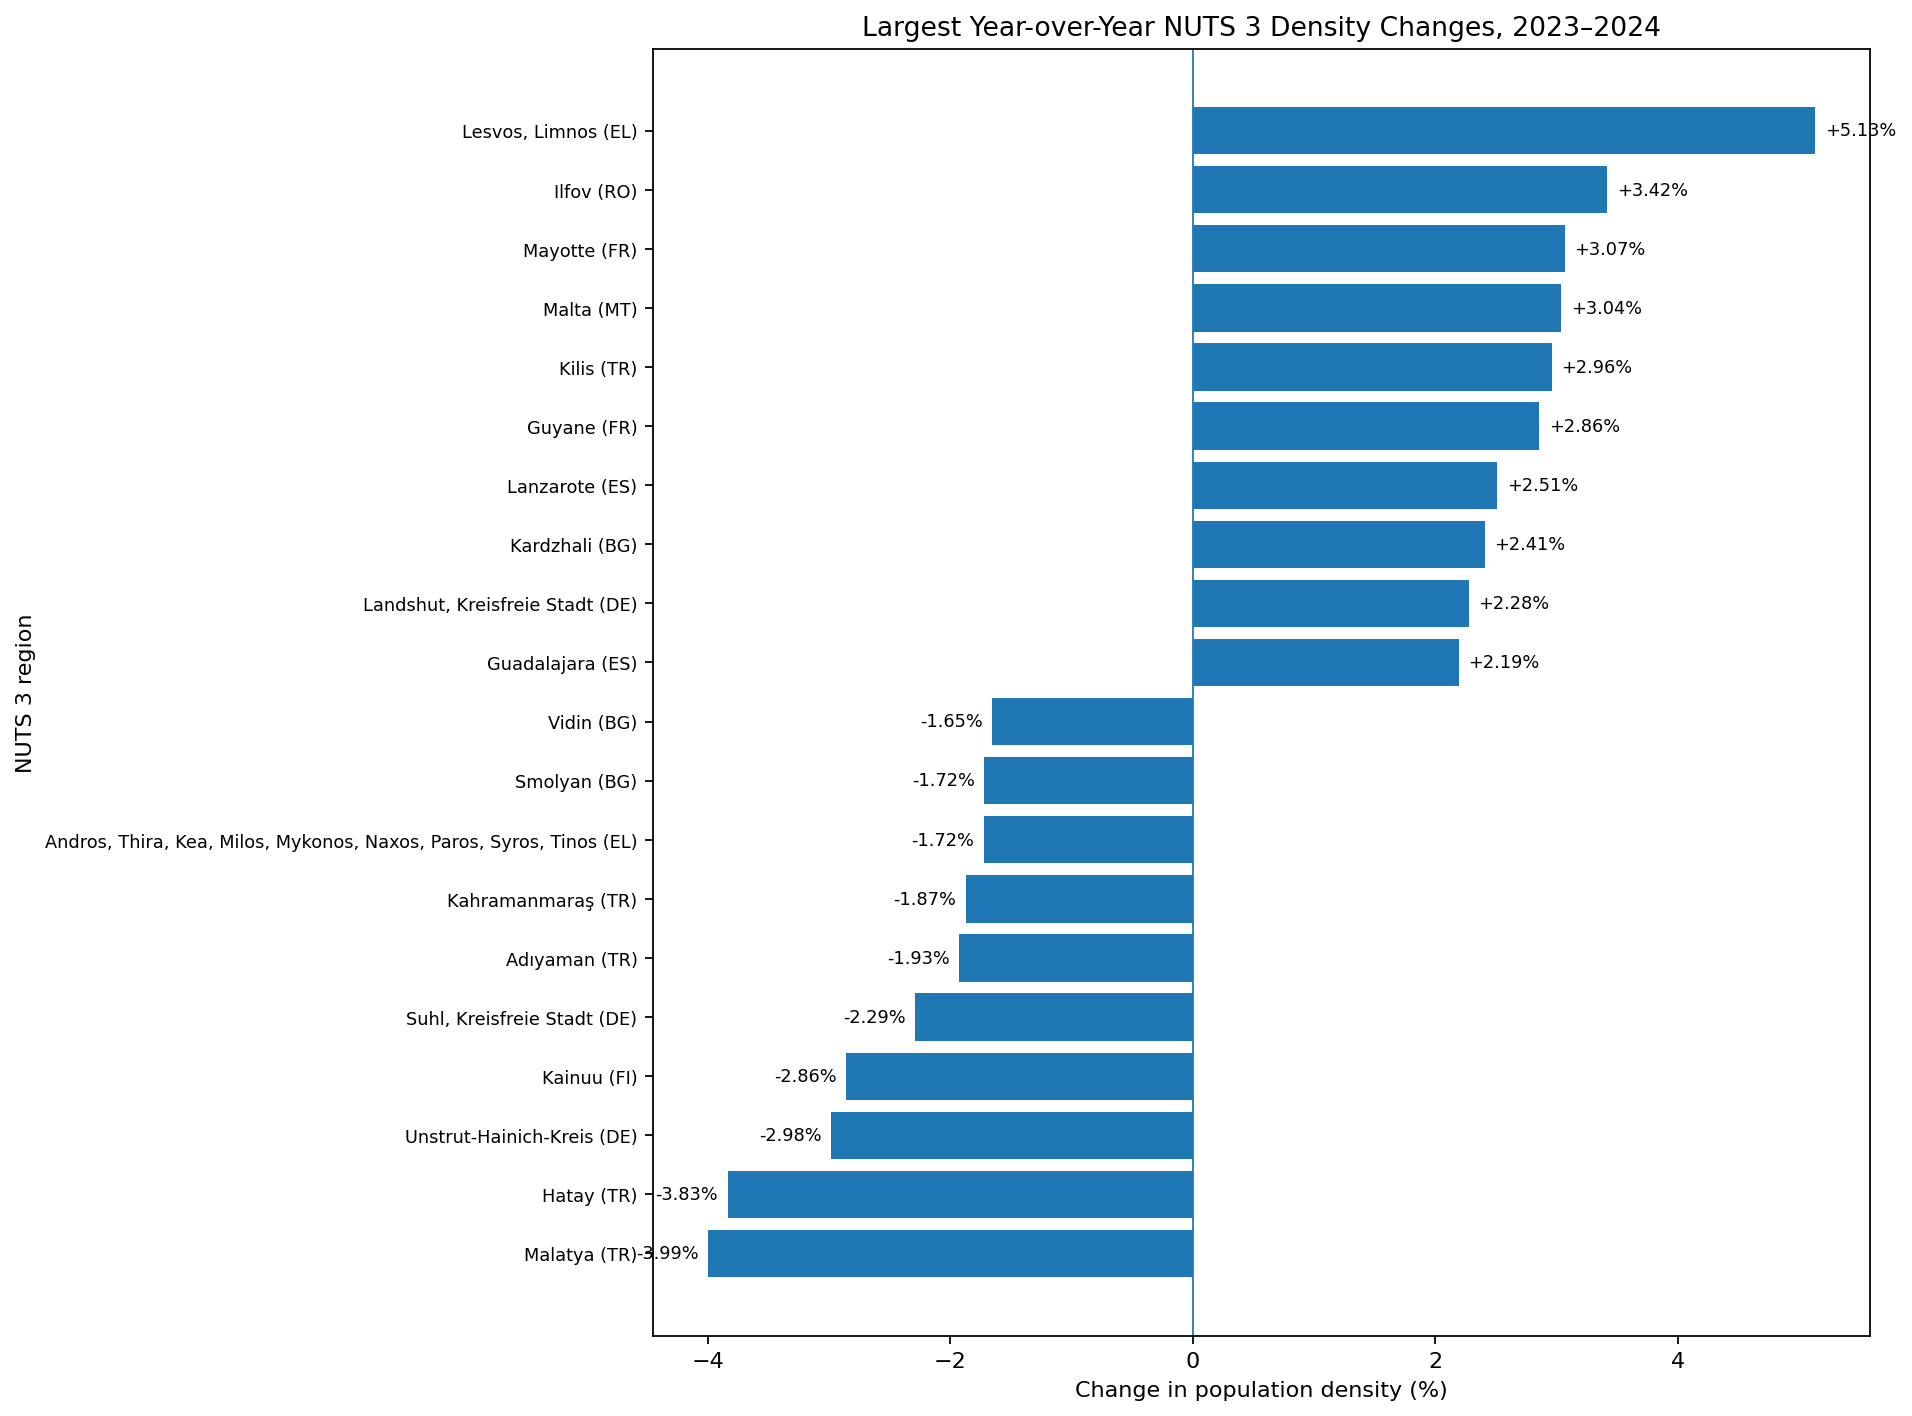
Lesvos, Limnos records the largest positive change in the table at +5.133%. Ilfov follows at +3.421%, then Mayotte at +3.068%, Malta at +3.037%, and Kilis at +2.962%. On the declining side, Malatya records -3.994%, Hatay -3.833%, Unstrut-Hainich-Kreis -2.979%, and Kainuu -2.857%.
These percentages describe the change in density, not the absolute number of residents gained or lost. The table also does not contain a separate explanation of boundary revisions or area changes. For that reason, the largest movements are best treated as flags for further investigation rather than evidence of a particular cause.
What this dataset can and cannot tell us
- It can show the 2024 density of each included NUTS 3 region, the distribution of those values, and 2023-to-2024 changes where both years are available.
- It should not be used to assume that every NUTS 3 unit is physically comparable in size or function across countries.
- It does not establish why density changed, nor does it prove a relationship with housing costs, income, transport, employment, or migration.
- It is a regional statistical comparison, so its values should not be substituted for national population-density figures.
The strongest use of this dataset is to identify where the regional extremes are and how unusual they are relative to the middle of the distribution. Paris at more than 20,000 people per km² and Landsbyggð at 1.4 are not just different values; together they show why a single Europe-wide density number would hide most of the geographic story.
Data source and method
The underlying figures come from Eurostat dataset DEMO_R_D3DENS. The verified table provides 2024 population density, the corresponding 2023 value when available, and a year-over-year percentage change. Density is reported as people per square kilometre. The percentage change is interpreted as (2024 density - 2023 density) / 2023 density × 100. To describe the distribution without letting the highest values dominate the summary, this analysis also calculates the median and quartiles.
The official data endpoint is the Eurostat DEMO_R_D3DENS API. For the regional classification itself, see Eurostat GISCO’s NUTS documentation.
Frequently asked questions
Is NUTS 3 population density the same as a country’s population density?
No. This comparison uses Eurostat NUTS 3 statistical regions. Multiple NUTS 3 regions can sit within the same country and have very different density values.
Which NUTS 3 region has the highest density in the 2024 data?
Paris is highest in the supplied 2024 table at 20,147.8 people per km², followed by Kentrikos Tomeas Athinon and Hauts-de-Seine.
How were regions with no 2023 comparison handled?
38 of the 1,279 rows have no usable year-over-year change value. They were excluded from the change counts rather than treated as zero.
Related maps
Green Map creates custom-edited map images using open geographic data sources such as geoBoundaries, Natural Earth, OpenStreetMap, and government open data. These maps are edited visual materials, not raw data files, and are provided for education, documents, presentations, and graphic reference.