If today’s enrolment patterns continued, how many total years of education could a person expect to receive from primary through tertiary education? UNESCO Institute for Statistics indicator SLE.1T8 measures this as school life expectancy for primary-to-tertiary education, both sexes.
Among the 77 country and area observations dated 2024, the median is 14.6 years and the mean is 14.8. 8 observations are at 18 years or more, 2 are at 20 years or more, and 3 are below 10 years.
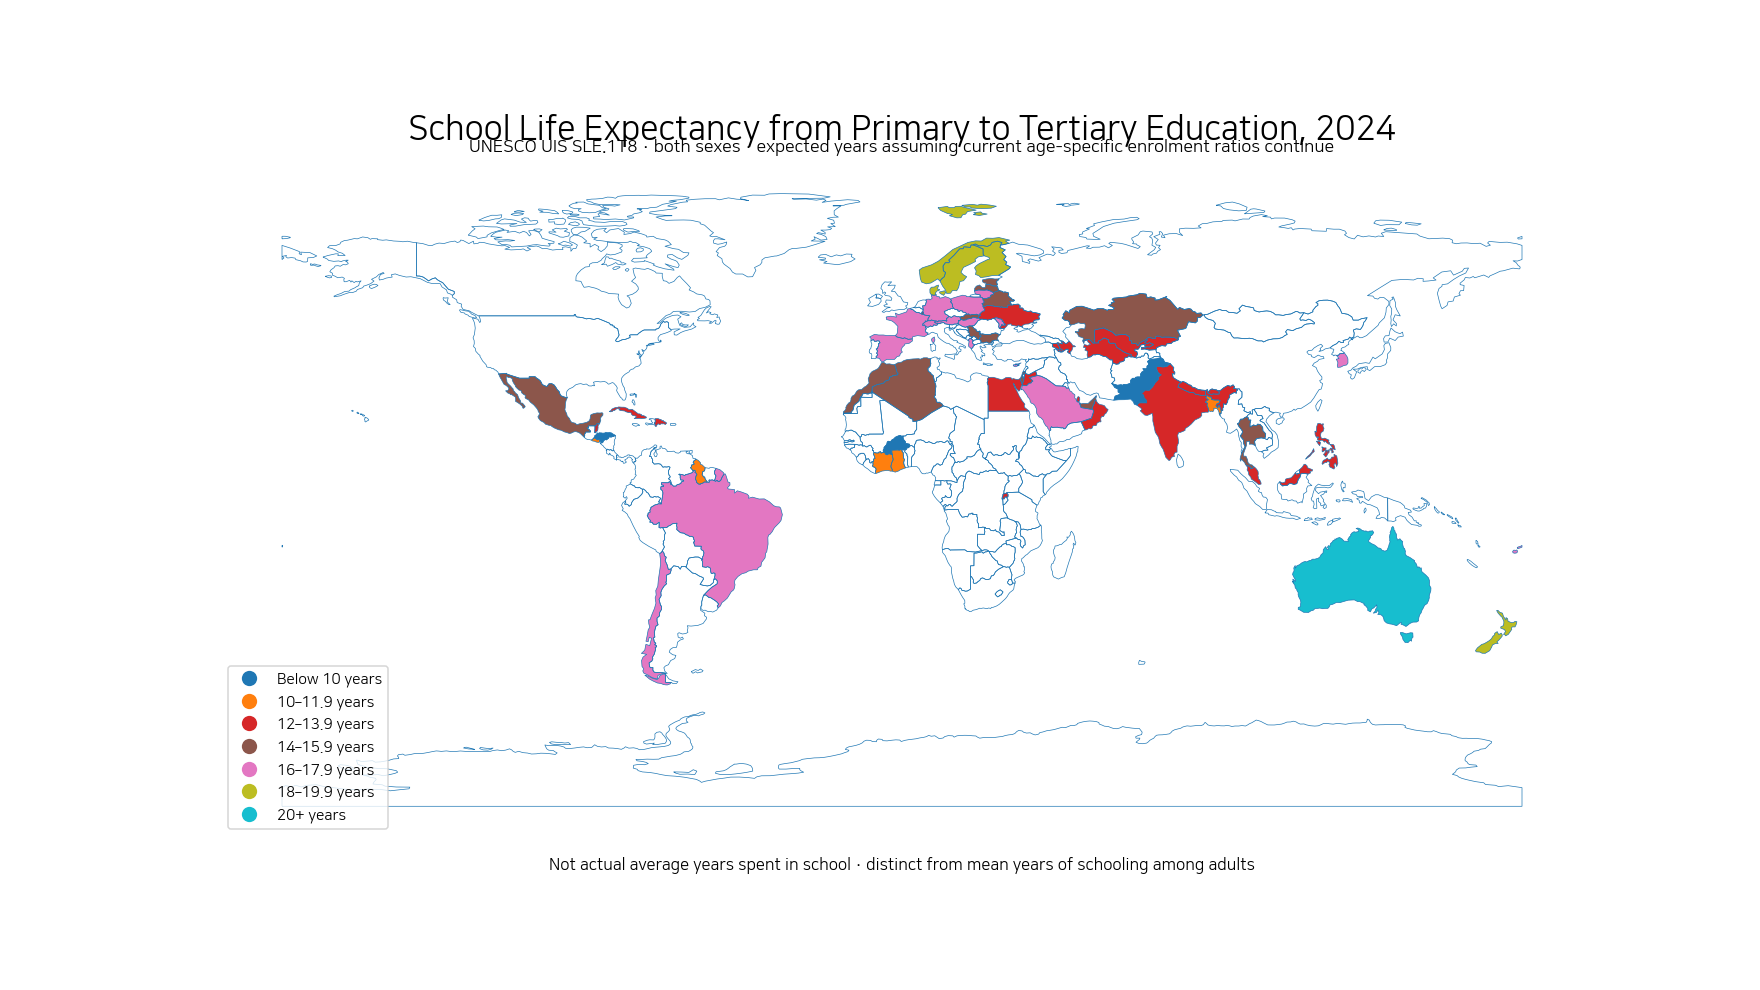
Table of Contents
School life expectancy is an expectation based on current enrolment patterns
UIS defines school life expectancy as the total number of years of schooling that a person of a certain age can expect to receive in the future, assuming the probability of enrolment at each age is equal to the current enrolment ratio for that age.
The indicator is therefore not produced by following one birth cohort for decades. It summarizes today’s age-specific participation pattern into an expected future duration. If enrolment expands or contracts, the indicator can change.
It is not the actual average time an individual spends in school
School life expectancy is not the observed average number of years actually spent in education. A particular person may receive more or less schooling than the indicator suggests.
Grade repetition can also increase time spent enrolled and therefore influence the expected duration. The indicator measures expected participation time, not completed grades or the highest qualification ultimately obtained.
The scope runs from primary through tertiary education
The code SLE.1T8 covers ISCED levels 1 through 8: primary, secondary, post-secondary non-tertiary and the full range of tertiary education through doctoral study.
Pre-primary education is excluded from this particular series. Because tertiary education is included, the result can be much longer than the statutory duration of primary and secondary schooling alone.
The median across 77 observations is 14.6 years
The first quartile is 13.3 years, the median 14.6 and the third quartile 16.5. 44 observations are at 14 years or more, 35 at 15 years or more, and 25 at 16 years or more.
8 observations reach at least 18 years and 2 reach at least 20. At the lower end, 8 are below 12 years and 3 below 10 years.
Eight countries and areas are at 18 years or more
The 18+ group includes Monaco at 21.0 years, Australia 20.6, Finland 19.6, New Zealand 19.2, Hong Kong SAR 18.7, Sweden 18.6, Norway 18.5 and Denmark at 18.1.
High values indicate long expected participation in education under current enrolment patterns. Broad tertiary participation and sustained enrolment across many ages can push the indicator upward.
| Country or area | ISO3 | 2024 school life expectancy |
|---|---|---|
| Monaco | MCO | 21.0 years |
| Australia | AUS | 20.6 years |
| Finland | FIN | 19.6 years |
| New Zealand | NZL | 19.2 years |
| Hong Kong SAR, China | HKG | 18.7 years |
| Sweden | SWE | 18.6 years |
| Norway | NOR | 18.5 years |
| Denmark | DNK | 18.1 years |
| Spain | ESP | 17.7 years |
| Cyprus | CYP | 17.6 years |
| Macao SAR, China | MAC | 17.5 years |
| Germany | DEU | 17.3 years |
| Chile | CHL | 17.3 years |
| Albania | ALB | 17.3 years |
| Fiji | FJI | 17.3 years |
Monaco and Australia exceed 20 years
Monaco has the maximum at 21.0 years, while Australia records 20.6. Finland and New Zealand are both above 19 years.
A value above 20 years does not mean every student completes more than 20 years of degrees. It is an enrolment-based expectation, and repetition or participation at older ages can also affect the result.
Burkina Faso has the lowest value at 7.5 years
Burkina Faso records 7.5 years, followed by Pakistan at 8.2 and Honduras at 8.8. These are the only observations below 10 years.
El Salvador is about 11.0 years, Bangladesh 11.1, Ghana 11.7 and Côte d’Ivoire close to 12. Lower values indicate shorter expected participation under current enrolment patterns, but the indicator alone does not identify the causes.
| Lower school-life-expectancy country or area | ISO3 | 2024 value |
|---|---|---|
| Burkina Faso | BFA | 7.5 years |
| Pakistan | PAK | 8.2 years |
| Honduras | HND | 8.8 years |
| El Salvador | SLV | 11.0 years |
| Bangladesh | BGD | 11.1 years |
| Ghana | GHA | 11.7 years |
| Guyana | GUY | 11.8 years |
| Côte d’Ivoire | CIV | 12.0 years |
| Malaysia | MYS | 12.1 years |
| Belize | BLZ | 12.3 years |
| San Marino | SMR | 12.3 years |
| Turkmenistan | TKM | 12.3 years |
| British Virgin Islands | VGB | 12.5 years |
| Seychelles | SYC | 12.8 years |
| Rwanda | RWA | 12.9 years |
Major comparison cases span roughly 13 to 21 years
Australia is 20.6, Finland 19.6, New Zealand 19.2, Sweden 18.6, Norway 18.5, Spain 17.7 and Germany 17.3 years.
France is 16.1, Brazil 16.1, the United Arab Emirates 15.8, Mexico 14.9 and India 13.4. The Republic of Korea appears as one ordinary comparison row rather than a headline focus under the V10 country-focus contract.
| Country | 2024 school life expectancy |
|---|---|
| Australia | 20.6 years |
| Finland | 19.6 years |
| New Zealand | 19.2 years |
| Sweden | 18.6 years |
| Norway | 18.5 years |
| Spain | 17.7 years |
| Germany | 17.3 years |
| Republic of Korea | 16.9 years |
| France | 16.1 years |
| Brazil | 16.1 years |
| United Arab Emirates | 15.8 years |
| Mexico | 14.9 years |
| India | 13.4 years |
| Malaysia | 12.1 years |
It is different from mean years of schooling
Mean years of schooling usually summarizes the average number of completed years of education among adults, often those aged 25 and older. It is an attainment measure reflecting past educational experience.
School life expectancy is forward-looking: it uses current age-specific enrolment ratios to estimate how many years of schooling a person can expect to receive. A country can therefore have much higher school life expectancy than the mean years of schooling of older adults.
It is also different from the standard duration of secondary education
The theoretical duration of secondary education describes how many years the formal lower- and upper-secondary programmes are designed to last.
School life expectancy instead reflects actual current participation patterns across primary through tertiary education. Two countries with identical six-year secondary structures can have very different school life expectancy because tertiary participation and age-specific enrolment differ.
Compulsory-education years are another separate concept
Compulsory education is the period during which attendance is legally required. A legal entitlement or obligation does not guarantee identical participation at every age.
School life expectancy can substantially exceed compulsory duration when many students continue into tertiary education. It can also be affected by participation gaps even where statutory compulsory education is long.
Tertiary participation can strongly affect the indicator
Where primary and secondary enrolment are already high, tertiary participation can create much of the remaining difference in school life expectancy.
Countries with broad university participation, postgraduate enrolment or substantial participation at older ages can have high expected years. This still does not imply higher education quality or stronger labour-market outcomes.
Grade repetition can raise expected years
Because school life expectancy is derived from enrolment ratios, systems with significant grade repetition can record more years of expected enrolment without necessarily producing more completed grades.
This is one reason the indicator should be read alongside completion, attainment and learning measures. Time enrolled and education successfully completed are related but distinct concepts.
The 2024 extract contains 77 countries and areas
This is not a complete world list. The finding that eight observations reach 18 years or more applies to the 77 country and area observations available for 2024 in this dataset.
A missing country does not mean zero expected schooling. It means no 2024 observation is present in the current extract.
Blank map areas do not mean zero
Of the 77 source observations, 64 match separate polygons in the low-resolution world boundary layer used here. Small islands and territories can have valid statistics without a visible polygon.
The map uses bands below 10 years, 10–11.9, 12–13.9, 14–15.9, 16–17.9, 18–19.9 and 20+. Missing values remain unclassified rather than being filled with zero.
Data source and interpretation
Country values come from the UNESCO UIS Data Browser for SLE.1T8, using the 2024 observations. The definition of school life expectancy follows the UIS Glossary.
UIS defines school life expectancy as the total future years of schooling expected for a person of a certain age if the probability of being enrolled at each age remains equal to the current enrolment ratio for that age. The package provider tag is corrected from World Bank to UNESCO UIS, and the generic unit ‘value’ is clarified as years.
Frequently Asked Questions
What does school life expectancy mean?
It is the total future years of schooling a person can expect if current age-specific enrolment ratios continue.
Is school life expectancy the actual average time students spend in school?
No. It is an expectation calculated from current enrolment patterns rather than an observed average from following individuals.
Is it the same as mean years of schooling?
No. Mean years of schooling usually measures completed education among adults, while school life expectancy estimates future schooling based on current enrolment.
Does a higher value mean higher education quality?
Not necessarily. It indicates longer expected participation in education, not learning quality, completion, efficiency or labour-market outcomes.
Related Articles
- Secondary Education Standard Duration in 2025
- Compulsory Education Duration by Country | 2025
- Out-of-School Rate for Upper-Secondary-Age Youth | 2024
Green Map creates custom-edited map images using open geographic data sources such as geoBoundaries, Natural Earth, OpenStreetMap, and government open data.
These maps are edited visual materials, not raw data files, and are provided for education, documents, presentations, and graphic reference.