What share of young people who are officially of upper-secondary school age are not enrolled in education? UNESCO Institute for Statistics indicator ROFST.3.CP measures the out-of-school rate for youth of upper-secondary school age, both sexes.
Across the 123 country and area observations dated 2024, the unweighted median is 19.9% and the mean is 26.7%. 23 observations are at or above 50%, while 31 are at or above 40%. The Republic of Korea is 4.50%, the 15th-lowest observation.
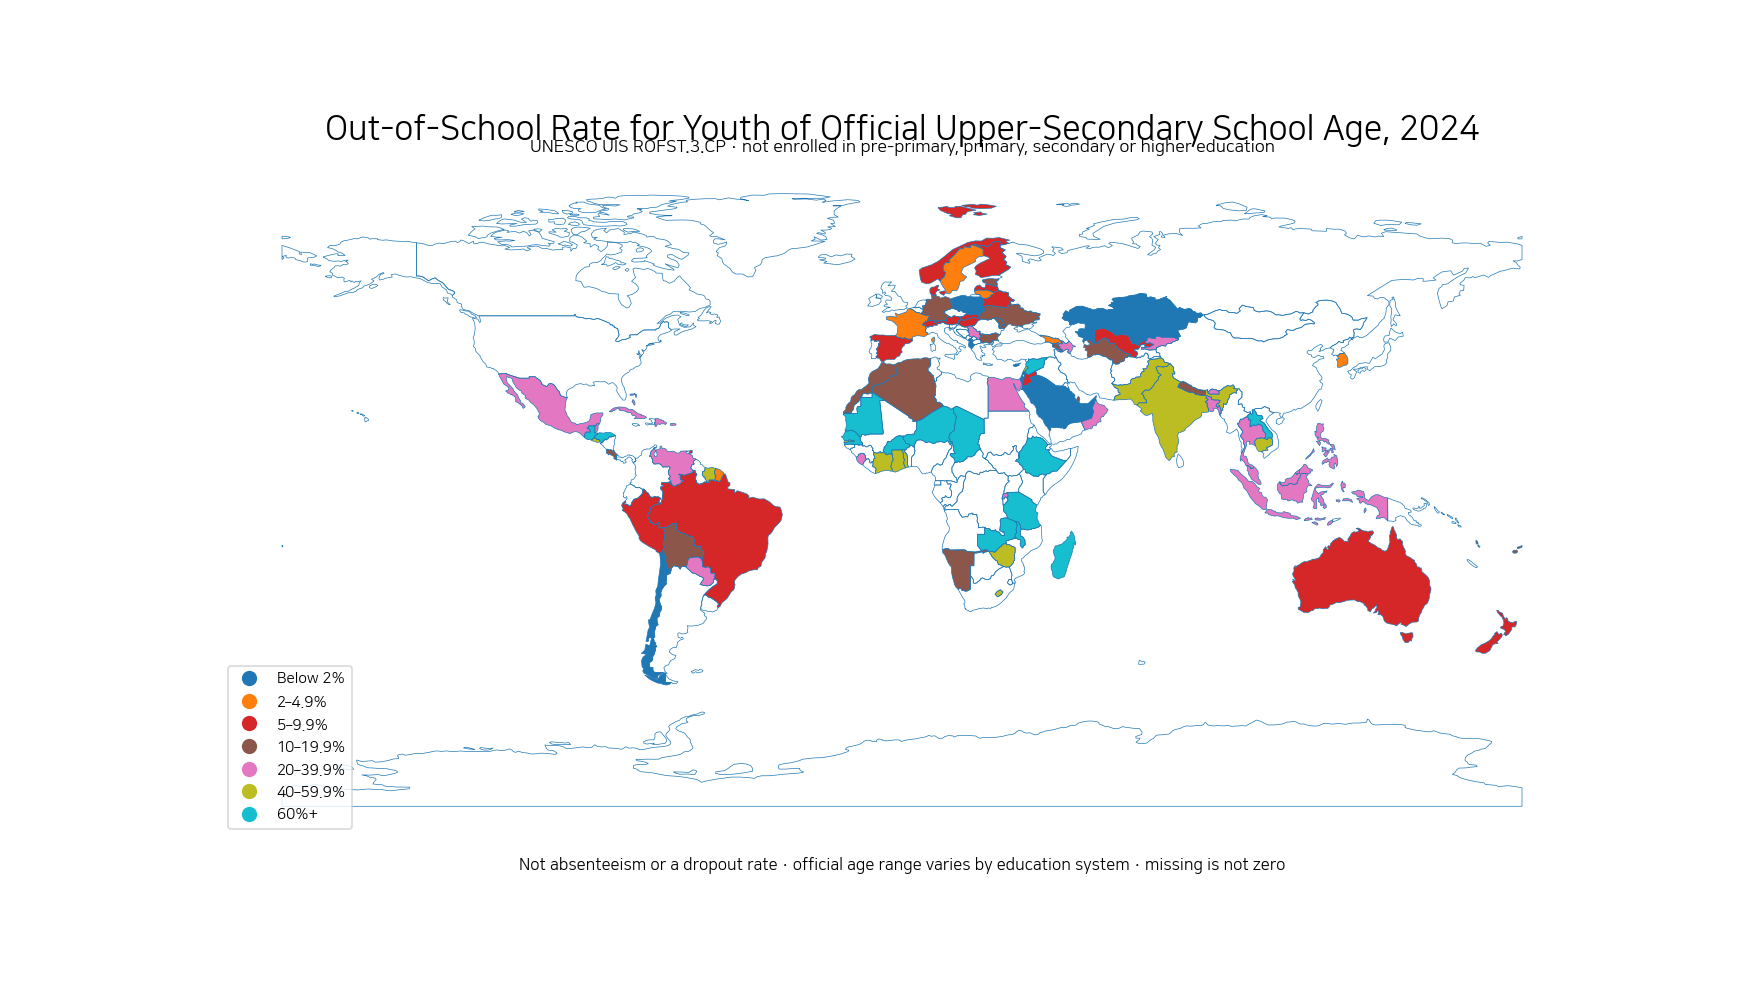
Table of Contents
This is not the same as an upper-secondary dropout rate
The out-of-school rate is broader than dropout. It includes young people in the official upper-secondary age range who are not enrolled, whether they never entered the relevant level, left education earlier, or are outside the education system for another reason.
It is also different from absenteeism. A student who remains enrolled but misses classes is not automatically counted as out of school. The core UIS definition is based on enrollment status across pre-primary, primary, secondary or higher education.
Official upper-secondary school age is not identical in every country
Upper-secondary education is broadly comparable to the high-school stage, but national education systems differ in entry ages, duration and programme structure. The denominator therefore does not use one universal age range such as 15–17 for every country.
UIS uses the official age range for upper-secondary education in each system. That is why ‘youth of official upper-secondary school age’ is the most precise wording, even though ‘high-school-age youth’ is easier for general readers.
The median across 123 observations is 19.9%
The median is 19.9%, with a first quartile of 7.9% and a third quartile of 40.0%. 61 observations are at least 20%, 38 are at least 30%, 31 are at least 40%, and 23 are at least 50%.
At the other end, 36 observations are below 10%, 16 are below 5%, 10 are below 2%, and 4 are below 1%. The distribution is broad enough that the map uses several low and high bands rather than a single threshold.
Niger, Tanzania, Mauritania, Senegal and Chad are around or above 80%
Niger has the highest 2024 observation at 88.5%. Tanzania is 85.0%, Mauritania 83.4%, Senegal 81.1% and Chad 80.0%. Burkina Faso is 76.3%, Tokelau 74.0%, Ethiopia 73.3% and the Syrian Arab Republic 72.7%.
A high rate means a large share of upper-secondary-age youth are outside enrollment. The indicator alone does not establish why. Costs, distance, earlier school completion gaps, work, care responsibilities, conflict, migration, disability, gender barriers and school capacity can all matter.
| Rank | Country or area | ISO3 | 2024 out-of-school rate |
|---|---|---|---|
| 1 | Niger | NER | 88.5% |
| 2 | United Republic of Tanzania | TZA | 85.0% |
| 3 | Mauritania | MRT | 83.4% |
| 4 | Senegal | SEN | 81.1% |
| 5 | Chad | TCD | 80.0% |
| 6 | Burkina Faso | BFA | 76.3% |
| 7 | Tokelau | TKL | 74.0% |
| 8 | Ethiopia | ETH | 73.3% |
| 9 | Syrian Arab Republic | SYR | 72.7% |
| 10 | Madagascar | MDG | 69.0% |
| 11 | Malawi | MWI | 68.7% |
| 12 | Zambia | ZMB | 65.6% |
| 13 | Guatemala | GTM | 65.6% |
| 14 | Lao PDR | LAO | 63.1% |
| 15 | Honduras | HND | 62.1% |
The Republic of Korea is 4.5%, among the lower observations
The Republic of Korea records 4.50%, the 15th-lowest value among the 123 observations. France is 4.5%, Australia 6.1% and Germany 11.2%.
Brazil is 7.6%, Spain 5.6%, Norway 7.6% and Finland 5.3%. Mexico is 28.0%, Indonesia 28.0%, Bangladesh 28.5% and India 43.2%.
| Country | 2024 out-of-school rate | Low-to-high rank |
|---|---|---|
| Republic of Korea | 4.5% | 15 |
| France | 4.5% | 13 |
| Australia | 6.1% | 24 |
| Germany | 11.2% | 41 |
| Brazil | 7.6% | 30 |
| Mexico | 28.0% | 79 |
| Indonesia | 28.0% | 80 |
| India | 43.2% | 95 |
| Bangladesh | 28.5% | 83 |
| Spain | 5.6% | 19 |
| Sweden | 3.0% | 11 |
| Finland | 5.3% | 18 |
| Norway | 7.6% | 29 |
Only four observations are below 1%
4 observations fall below 1%: the United Arab Emirates at 0.36%, Saudi Arabia 0.49%, Poland 0.73% and Kazakhstan 0.82%. Broadening the threshold to below 2% gives 10 observations.
Very low out-of-school rates do not prove that all education outcomes are strong. Enrollment does not guarantee regular attendance, age-appropriate grade placement, learning proficiency, safe schooling or eventual completion.
| Low-rank side | Country or area | ISO3 | 2024 out-of-school rate |
|---|---|---|---|
| 1 | United Arab Emirates | ARE | 0.4% |
| 2 | Saudi Arabia | SAU | 0.5% |
| 3 | Poland | POL | 0.7% |
| 4 | Kazakhstan | KAZ | 0.8% |
| 5 | Hong Kong SAR, China | HKG | 1.0% |
| 6 | Chile | CHL | 1.1% |
| 7 | Albania | ALB | 1.3% |
| 8 | Cyprus | CYP | 1.4% |
| 9 | Israel | ISR | 1.6% |
| 10 | Bahrain | BHR | 1.8% |
| 11 | Sweden | SWE | 3.0% |
| 12 | Gibraltar | GIB | 3.5% |
| 13 | France | FRA | 4.5% |
| 14 | Lithuania | LTU | 4.5% |
| 15 | Republic of Korea | KOR | 4.5% |
Why out-of-school rates can rise at upper-secondary age
In many systems, upper-secondary age coincides with the end of compulsory schooling or a transition into vocational education, work or other pathways. The costs and opportunity costs of staying in school can also increase as young people get older.
But this pattern is not universal. Countries differ in compulsory-schooling laws, free-education coverage, vocational pathways and the institutional structure of upper-secondary education.
Longer compulsory education does not automatically guarantee a low rate
Compulsory-education duration describes the legal requirement to attend school; the out-of-school rate describes actual enrollment among the official age group. The two can be related but are not the same.
A country can have a long compulsory period while still facing barriers to participation. Conversely, upper-secondary enrollment can remain high even after legal compulsion ends. Reading the two indicators together separates law from actual participation.
This is different from adult upper-secondary attainment
ROFST.3.CP describes the enrollment status of youth who are of official upper-secondary school age in 2024. Adult upper-secondary attainment measures whether people age 25 and older completed upper-secondary education in the past.
A country can improve current youth enrollment quickly while adult attainment changes only gradually across generations. The two indicators operate on different time horizons.
It is also different from the NEET rate
The NEET rate typically measures young people who are simultaneously outside education, employment and training. ROFST.3.CP looks only at education enrollment for the official upper-secondary age group and does not require information about employment.
A young person who is out of school but working can be included in the out-of-school rate but excluded from NEET. A young person who is enrolled but not employed is not out of school and is also not NEET because education participation is enough to exclude them.
The 26.7% mean is not a population-weighted world rate
The simple mean across the 123 observations is 26.7% and the median is 19.9%. Each country or area receives equal statistical weight in those summaries.
A population-weighted global rate requires the number of youth in the official upper-secondary age range for each country or an official UIS aggregate. The mean here describes the distribution of country and area observations, not the share of all upper-secondary-age youth in the world.
Blank map areas do not mean zero
The source table contains 123 country and area observations, of which 96 match separate polygons in the low-resolution world boundary layer used here. Small islands and separately reported territories can have valid observations without a visible polygon.
Countries without a 2024 observation remain unclassified. Missing data are never filled with zero because that would falsely imply universal enrollment.
Data source and interpretation
Country values come from the UNESCO UIS Data Browser for ROFST.3.CP, using the 2024 observations. The definition follows the UIS out-of-school rate glossary.
The official unit is percent and all rows use the 2024 reference year. The source package’s internal provider tag named the World Bank, but the official indicator and dataset are UNESCO UIS, so the completed metadata corrects the provider to UNESCO UIS.
Frequently Asked Questions
Is the out-of-school rate the same as the upper-secondary dropout rate?
No. It measures the share of youth in the official age range who are not enrolled anywhere in education, so it can include people who never entered as well as those who left.
What does Korea’s 4.5% mean?
It means about 4.5% of youth in Korea's official upper-secondary school-age range were not enrolled in pre-primary, primary, secondary or higher education in the 2024 UIS observation.
Is upper-secondary school age the same ages in every country?
No. The official age range depends on each country's education system and programme structure.
Does a low out-of-school rate mean education quality is high?
Not necessarily. The indicator measures enrollment status, not learning proficiency, attendance regularity, school quality or completion.
Related Articles
- Compulsory Education Duration by Country | 2025
- Upper-Secondary-or-Higher Attainment for Adults 25+
- Youth NEET Rate by Country | Ages 15–24 in 2025
Green Map creates custom-edited map images using open geographic data sources such as geoBoundaries, Natural Earth, OpenStreetMap, and government open data.
These maps are edited visual materials, not raw data files, and are provided for education, documents, presentations, and graphic reference.