The latest available country observations for adult upper-secondary attainment span an unusually wide range. In the verified World Bank package, 199 countries and separately reported economies have a non-null value for indicator SE.SEC.CUAT.UP.ZS, ranging from 1.5% to 98.4%. The essential caveat is the date attached to each value: the rows run from 1980 through 2025, and only one observation is dated 2025. This is therefore a map of each economy’s latest reported value, not a 2025 league table.
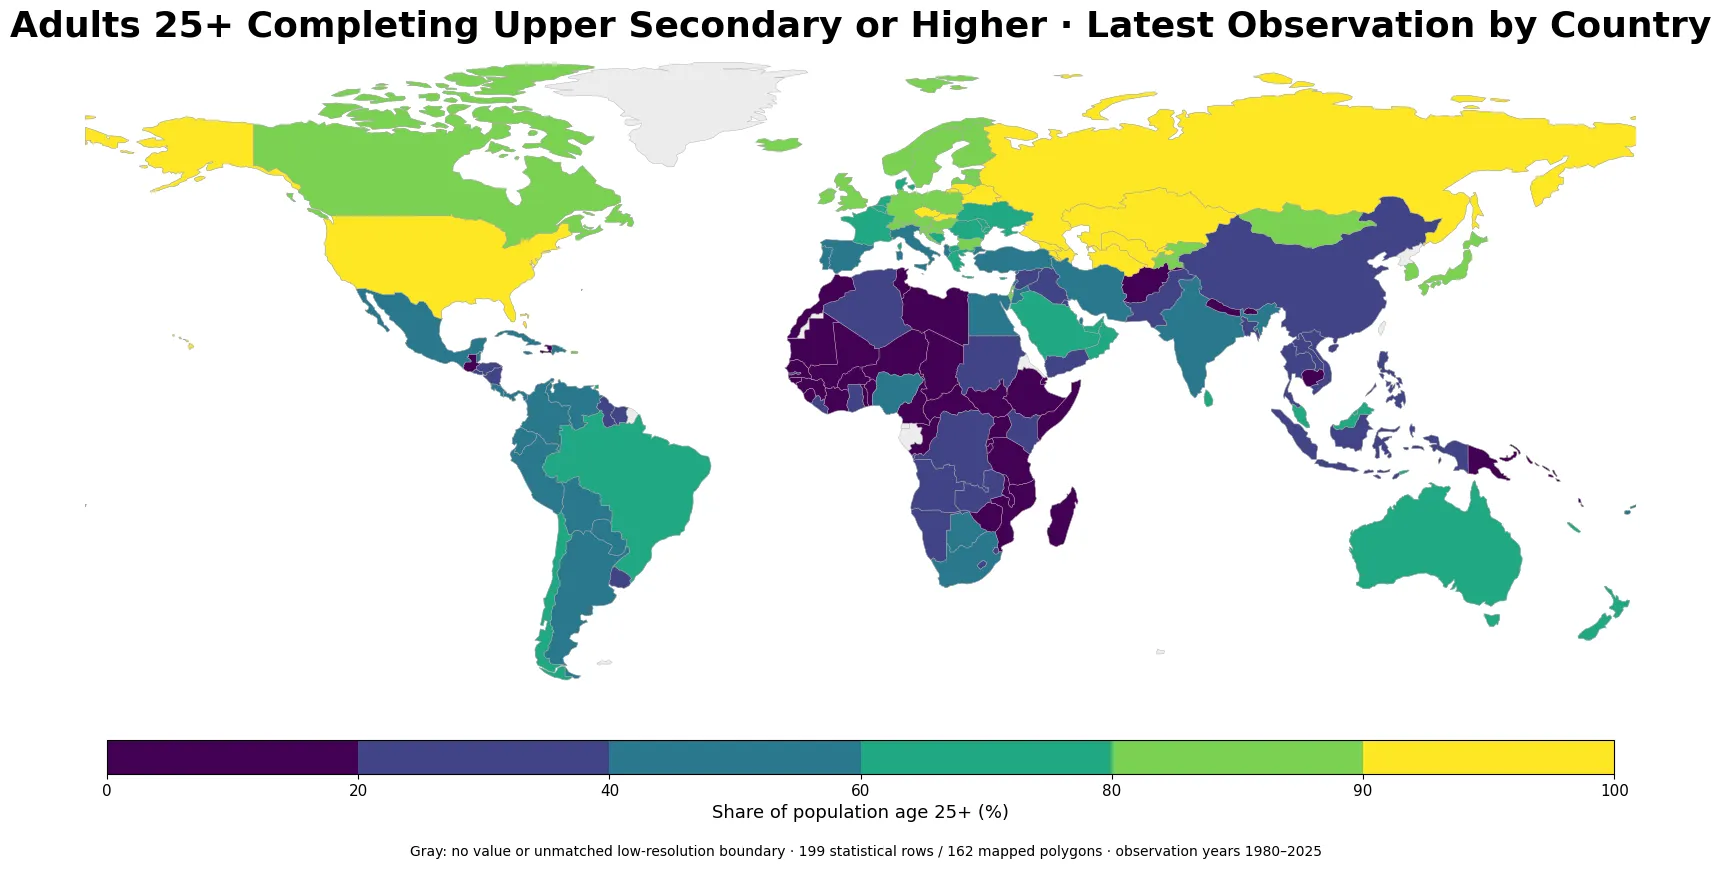
Table of Contents
The indicator measures accumulated adult attainment, not this year’s high-school graduation rate
World Bank metadata defines SE.SEC.CUAT.UP.ZS as the percentage of the population age 25 and older that has attained or completed upper secondary education. “At least” matters: adults who continued into post-secondary or tertiary education are still counted in the numerator. The measure therefore describes the stock of educational attainment accumulated in the adult population rather than the share of students who graduated from upper secondary school in a particular year.
Upper secondary is an internationally comparable education level, not a claim that every national school system has the same grades or credentials. For a broad audience it is close to the stage commonly associated with high school, but the exact institutional structure differs by country. A value of 80% should be read as roughly eight in ten adults age 25+ having completed at least that level, not as an 80-point score for educational quality.
Because the denominator includes everyone age 25 and older, multiple generations are combined in one number. A country that expanded secondary education recently can still have an adult attainment rate influenced by older cohorts who went to school under very different conditions. Enrollment, current cohort completion, literacy, test performance, and tertiary participation answer different questions.
The 49.4% median describes country rows, not the education level of the world population
Across all 199 latest observations, the simple median is 49.4% and the unweighted mean is 49.5%. There are 42 observations below 20%, 37 between 20% and 39.9%, 42 between 40% and 59.9%, 36 between 60% and 79.9%, 28 between 80% and 89.9%, and 14 at 90% or above. The spread is too wide to be summarized well by one “typical” country.
The 49.5% unweighted mean is not a population-weighted global attainment rate. A very populous country and a small island economy each contribute one row. Estimating the share of all adults worldwide who have completed upper secondary education would require appropriate population weights or an official aggregate constructed for that purpose. Here, the mean and median are descriptive statistics for the distribution of reporting economies.
Restricting the view to 2019 or later still leaves 170 observations and a large gap
To reduce the influence of very old reference years, a recent subset can be defined as observations dated 2019 or later. That leaves 170 rows, or 85.4% of the package. Their median is 52.8% and their simple mean is 51.9%. Within this recent subset, 13 observations are at 90% or above while 30 remain below 20%. The broad cross-country gap is therefore not an artifact created only by the oldest records.
At the high end of the 2019+ subset are Turkmenistan 98.4% (2022), Belarus 97.9% (2023), Uzbekistan 96.8% (2022), Kazakhstan 94.3% (2019), Georgia 93.5% (2024), Russian Federation 92.9% (2024), Armenia 92.8% (2023), Lithuania 92.5% (2023). At the low end are Niger 1.7% (2022), Chad 4.6% (2019), Burkina Faso 5.2% (2024), Central African Republic 5.6% (2019), Benin 6.4% (2022), Tanzania 6.5% (2022), Mali 7.2% (2022), Senegal 8.4% (2023). These values describe attainment status, not a ranking of teaching quality or learning outcomes. Decimal differences among very high-attainment economies are especially poor grounds for strong ordinal claims when reference years, surveys, and statistical systems differ.
A 2025-only map would contain just one observation
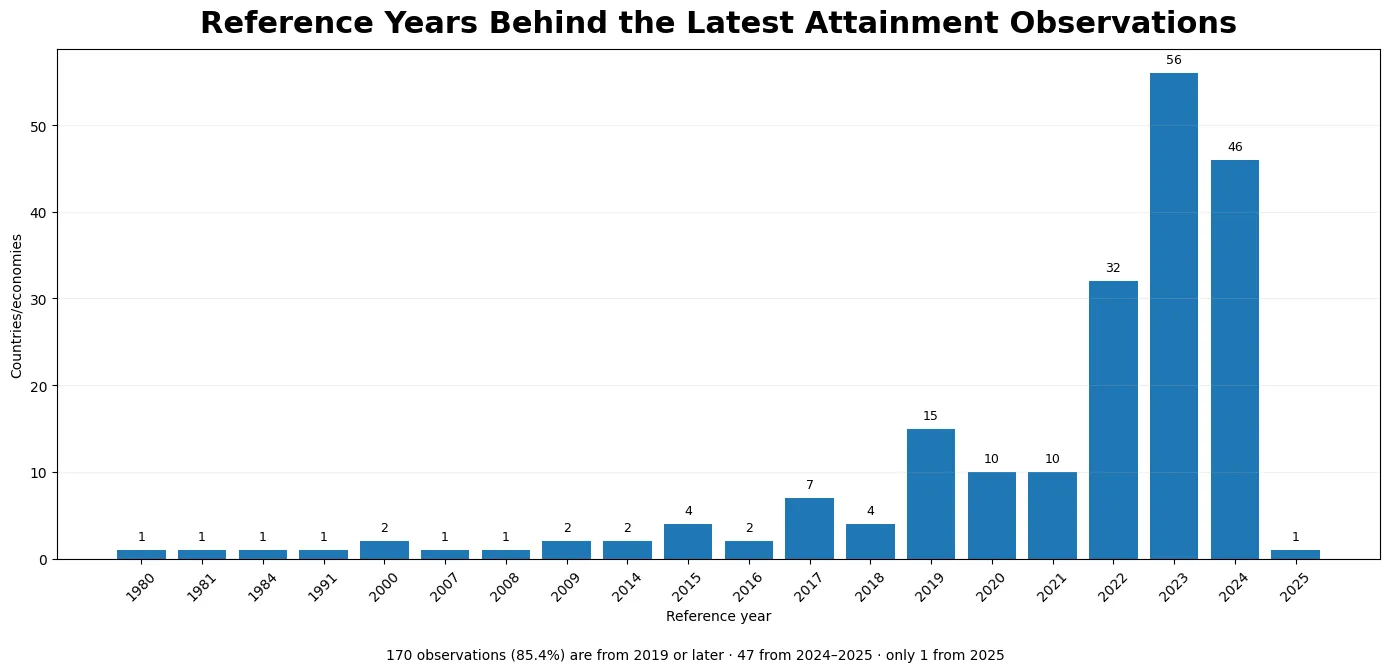
The date distribution explains why “latest available” and “same year” are different products. There are 46 rows from 2024, 56 from 2023, 32 from 2022, 10 from 2021, 10 from 2020, and 15 from 2019. A further 29 observations are from 2018 or earlier. The oldest rows in the retained package include American Samoa in 1980, Sao Tome and Principe in 1981, and Libya in 1984. Mexico is the only economy with a 2025 observation.
A latest-value map is useful for answering “what is the most recent reported adult attainment level available for each economy?” It is not equivalent to observing the whole world in one year. Adult educational attainment generally changes more slowly than a monthly economic indicator, but that does not make a decades-old observation current. Claims about recent reforms, convergence, or rates of progress need matched-year data or country time series rather than this mixed-vintage snapshot.
Selected economies show why the percentage and the reference year belong in the same table
Among selected economies, the United States reports 91.6% in 2024 and Canada 89.9% in 2024. Japan is 85.2% in 2020, Germany 81.9% in 2023, Korea 81.5% in 2024, Australia 79.9% in 2024, and France 78.0% in 2023. Brazil is 61.7% in 2024, Nigeria 48.1% in 2024, South Africa 48.0% in 2024, Mexico 42.5% in 2025, India 41.3% in 2023, Indonesia 39.1% in 2023, China 31.8% in 2020, and Ethiopia 9.9% in 2022.
| Country/economy | Reference year | Adults 25+ completing upper secondary or higher |
|---|---|---|
| Turkmenistan | 2022 | 98.4% |
| Uzbekistan | 2022 | 96.8% |
| United States | 2024 | 91.6% |
| Canada | 2024 | 89.9% |
| Japan | 2020 | 85.2% |
| Germany | 2023 | 81.9% |
| Korea, Rep. | 2024 | 81.5% |
| Australia | 2024 | 79.9% |
| France | 2023 | 78.0% |
| Brazil | 2024 | 61.7% |
| Nigeria | 2024 | 48.1% |
| South Africa | 2024 | 48.0% |
| Mexico | 2025 | 42.5% |
| India | 2023 | 41.3% |
| Indonesia | 2023 | 39.1% |
| China | 2020 | 31.8% |
| Ethiopia | 2022 | 9.9% |
| Niger | 2022 | 1.7% |
The table should not be converted into a ranking of economic performance, school quality, teacher effectiveness, or current student outcomes. It also shows why a value without its year is incomplete information. Japan and China are represented by 2020 observations, while several other large economies have 2024 data and Mexico has 2025. Broad gaps are informative; fine decimal rankings across mixed years are not.
Upper-secondary-or-higher attainment sets a higher threshold than lower-secondary-or-higher attainment
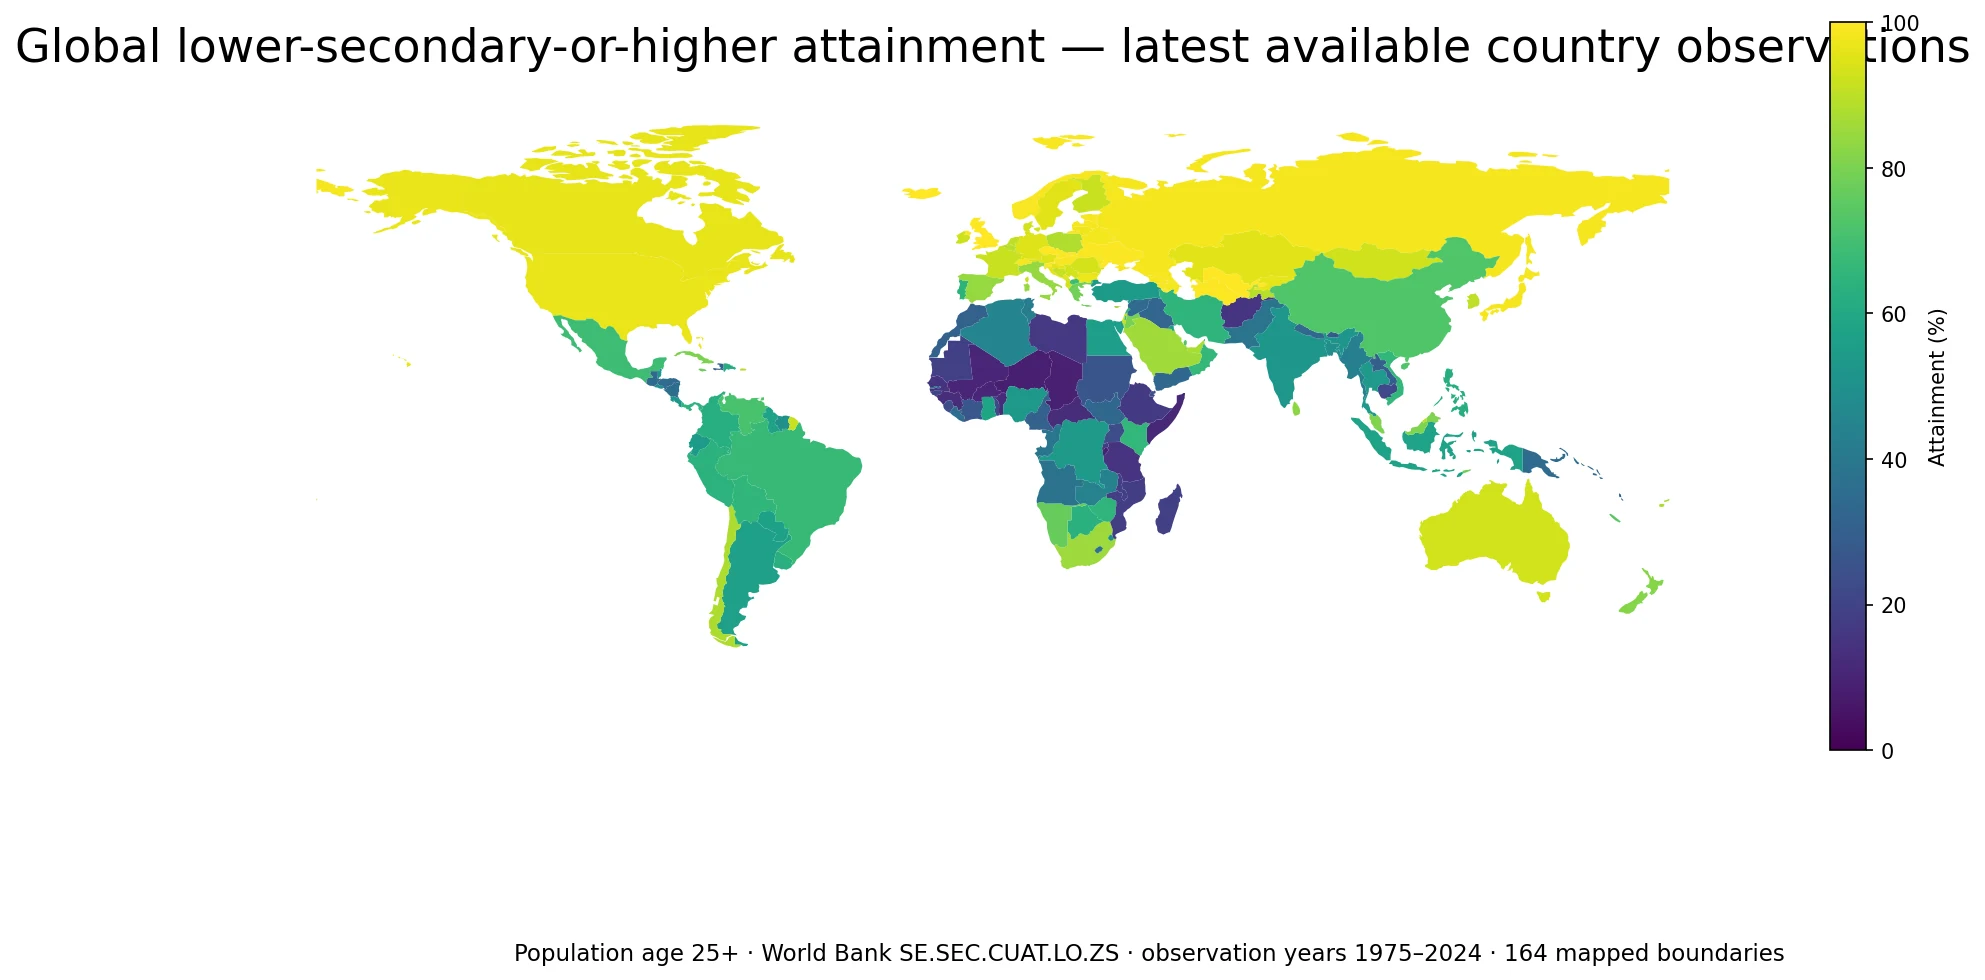
The World Bank also publishes a cumulative indicator for adults who have completed at least lower secondary education. That threshold is broader. Anyone counted as having completed upper secondary or higher necessarily meets the lower-secondary-or-higher threshold, but a person who completed lower secondary and stopped before upper secondary is not counted in SE.SEC.CUAT.UP.ZS. This makes the upper-secondary measure a stricter view of adult attainment.
The two indicators can be useful together, but subtracting one latest-value map from another and calling the result a dropout rate would be unsafe unless the country, reference year, denominator, and statistical basis are aligned. This package contains only the verified upper-secondary latest values, so no cross-indicator gap is fabricated here. The related section links to the separately published lower-secondary map for conceptual comparison.
The spatial pattern identifies differences, not their causes
The latest-value map shows many high observations across Europe and Central Asia and several high values in North America. Numerous low observations appear in the Sahel and elsewhere in Sub-Saharan Africa, while Asia and Latin America contain a wider mix of bands. These patterns are useful for locating where reported adult upper-secondary attainment is relatively high or low.
They do not establish why those differences exist. Adult attainment can reflect decades of compulsory-schooling policy, access to schools, conflict and migration, household resources, gender and regional inequalities, age structure, and many other factors. None of those explanatory variables is contained in the supplied table. Spatial clustering is therefore reported as a pattern in the data, not as proof of a common cause or policy effect.
Data source and calculation method
The statistical source is World Bank World Development Indicators series SE.SEC.CUAT.UP.ZS. World Bank metadata defines the series as the percentage of the population age 25 and older that attained or completed upper secondary education, and identifies the UNESCO Institute for Statistics (UIS) as the underlying data provider. The official definition is available in the World Bank DataBank metadata glossary.
The verified cleaned CSV keeps one latest non-null observation for each country/economy and excludes regional and income-group aggregates. All means, medians, band counts, and table values above were calculated directly from those 199 rows. The visualization joins ISO-3 codes to a locally available low-resolution country boundary set and fills 162 polygons. Small islands and separately reported territories can remain in the statistical sample without a visible polygon, so gray or absent map geometry must not be interpreted as a zero value.
Frequently Asked Questions
Is this a 2025 country ranking of upper-secondary educational attainment?
No. The package uses each country/economy’s latest non-null observation, so reference years range from 1980 to 2025. Only Mexico has a 2025 observation.
Is upper-secondary attainment the same as the current high-school graduation rate?
No. It is the cumulative share of the population age 25+ that has completed at least upper secondary education. Current student enrollment and cohort completion are separate measures.
Does an 80% value mean the education system scores 80 out of 100?
No. It means about 80% of adults age 25+ have completed upper secondary education or a higher level. It does not measure learning quality, test performance, or teacher quality.
Does a gray or unfilled country mean attainment is zero?
No. A value may be missing or the economy may not have a separate polygon in the low-resolution boundary set. Missing geometry and missing data are not zero.
Related Articles
These live Green Map pages provide the closest educational-attainment comparison and additional context for working with World Bank country-level indicators. Separate indicators are not treated as causes of one another.
- Global Lower-Secondary-or-Higher Attainment Map – Latest Values for Adults 25+
- Global Internet Use Map – 2024 Country Comparison
- World Bank Data Catalog Licensing Guide – Check Access and Reuse Terms
Green Map creates custom-edited map images using open geographic data sources such as geoBoundaries, Natural Earth, OpenStreetMap, and government open data.
These maps are edited visual materials, not raw data files, and are provided for education, documents, presentations, and graphic reference.