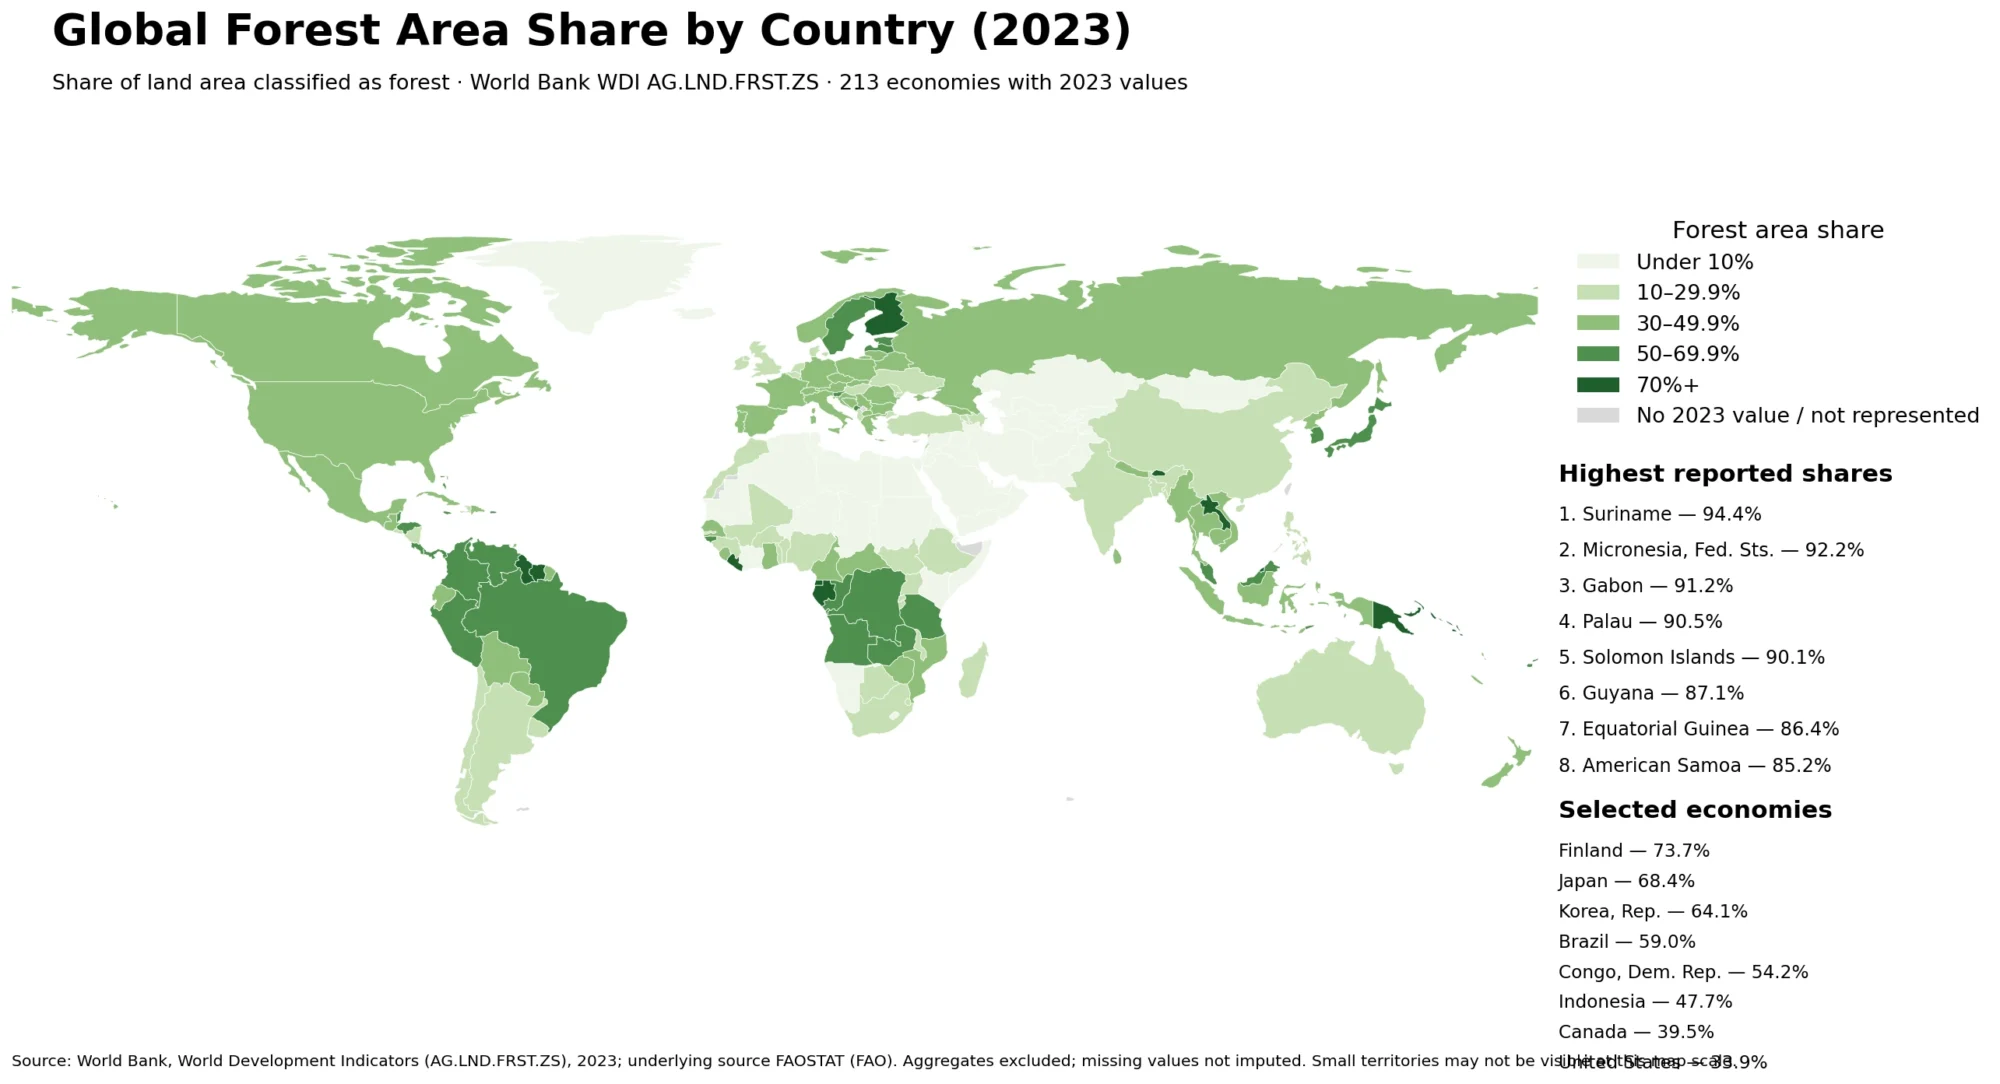
Urban access to clean cooking fuels and technologies is high across much of the world, but it is not universally near 100%. Among 189 reported 2023 observations, 118 are at 90% or above and 82 are at 99% or above. At the other end, 17 are below 10% and 39 are below 50%.
This article uses World Bank WDI indicator EG.CFT.ACCS.UR.ZS, which measures the share of the urban population primarily relying on clean fuels and technologies for cooking. Instead of repeating the national-population ranking, it focuses on the urban distribution and the urban–rural gap within the same countries.
Table of Contents
Urban access clusters near the top, but a low-access tail remains
The median urban access rate is 97.2%, while the simple unweighted mean is 77.9%. 82 observations are at 99–100%, but 17 remain below 10%.
| Urban access range | Countries/economies | Share of 189 |
|---|---|---|
| <10% | 17 | 9.0% |
| 10–<25% | 10 | 5.3% |
| 25–<50% | 12 | 6.3% |
| 50–<75% | 17 | 9.0% |
| 75–<90% | 15 | 7.9% |
| 90–<99% | 36 | 19.0% |
| 99–100% | 82 | 43.4% |
The urban–rural comparison reveals a second layer of inequality
Matching the 2023 urban series with the rural series shows that urban access is higher by an average of 16.3 percentage points and a median of 6.8 points. 65 observations have a gap of at least 20 points, and 20 have a gap of 50 points or more.
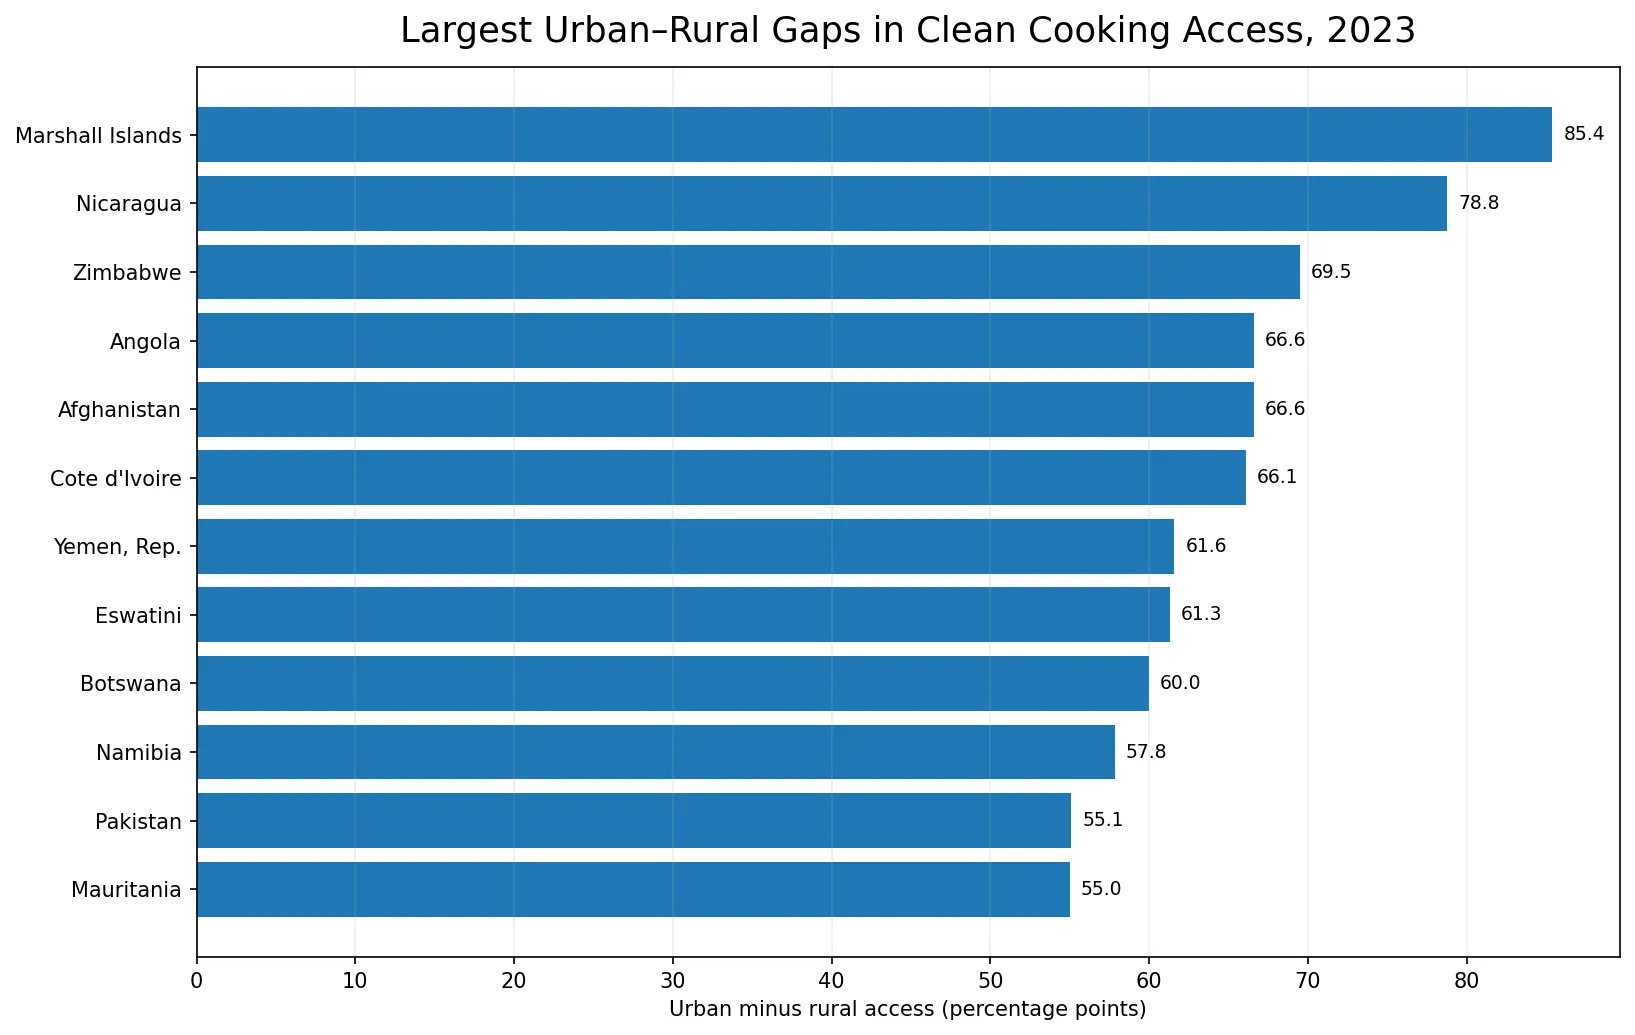
The Marshall Islands has the largest measured gap at about 85.4 percentage points, followed by Nicaragua at 78.8 points and Zimbabwe at 69.5 points. Angola and Afghanistan are both about 66.6 points.
Large economies show very different urban and rural patterns
National averages can hide substantial differences between where people live. The table below compares selected large economies using the same 2023 urban and rural indicators.
| Country | Urban access | Rural access | Gap |
|---|---|---|---|
| India | 95.2% | 65.7% | 29.5 pp |
| China | 95.2% | 77.4% | 17.8 pp |
| Brazil | 98.9% | 83.4% | 15.5 pp |
| Indonesia | 96.0% | 84.1% | 11.9 pp |
| Mexico | 90.6% | 60.3% | 30.3 pp |
| South Africa | 96.5% | 70.4% | 26.1 pp |
| Pakistan | 88.2% | 33.1% | 55.1 pp |
| Bangladesh | 63.2% | 10.8% | 52.4 pp |
| Nigeria | 48.7% | 9.7% | 39.0 pp |
| Afghanistan | 87.0% | 20.4% | 66.6 pp |
Low urban access shows that city residence alone does not guarantee clean cooking
South Sudan is reported at 0.0% even for the urban population, followed by Burundi at 0.1%, Liberia at 1.4%, Guinea-Bissau at 1.5% and Sierra Leone at 1.6%.
The definition of “clean” is based on emissions performance. WHO guidance recognizes electricity, natural gas, LPG, biogas, ethanol and solar among commonly accepted clean cooking options, while kerosene is excluded.
This is not the same as urbanization or electricity access
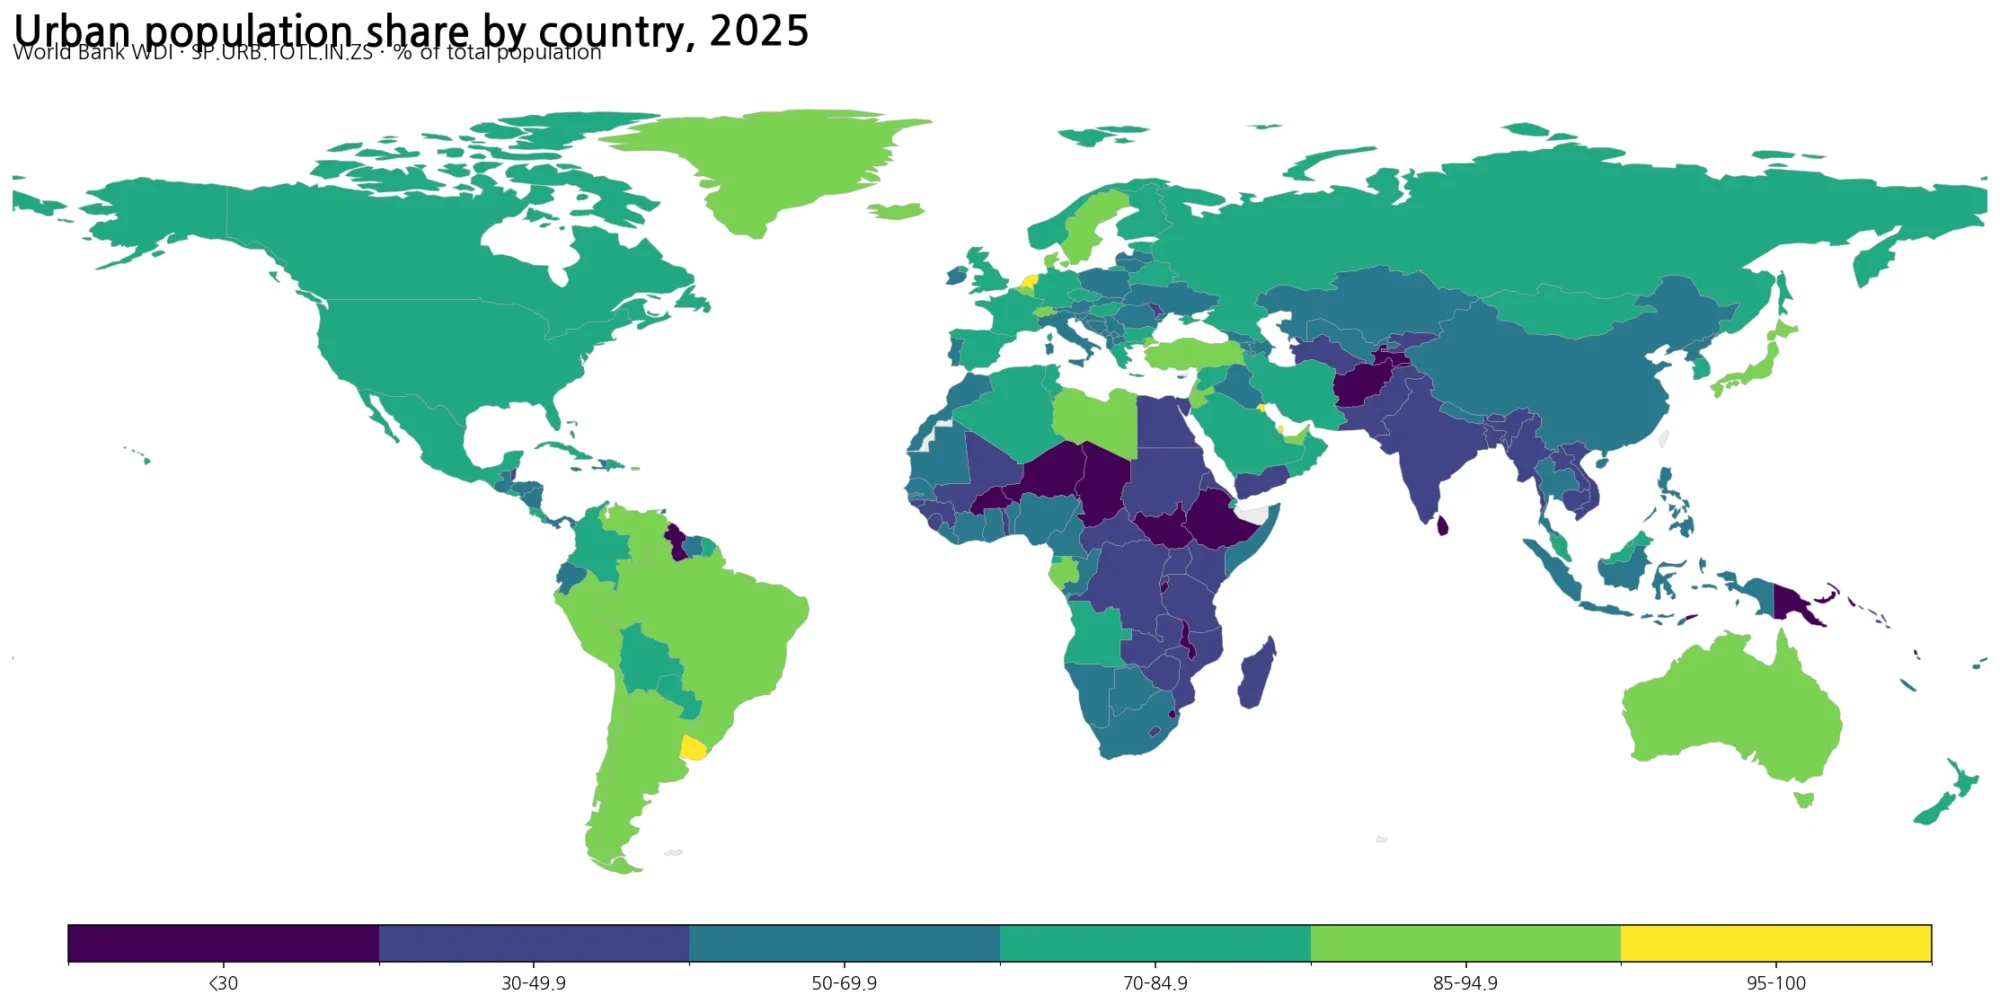
EG.CFT.ACCS.UR.ZS measures clean cooking access within the urban population. Urbanization measures the share of people living in urban areas, while electricity access measures whether people can access electricity. These indicators are related but not interchangeable.
The series also does not decompose the reasons behind each country’s value. Fuel prices, distribution networks, household income, power reliability and policy can all matter, but causal analysis requires additional data.
Data source and calculation method
The statistical source is World Bank WDI EG.CFT.ACCS.UR.ZS. All 189 values used here are dated 2023. Urban–rural gaps are calculated by matching the urban series with 2023 rural indicator EG.CFT.ACCS.RU.ZS by ISO-3 code.
The world map uses a simplified country boundary layer, so some small islands or separately reported economies may have a statistical observation without a clearly visible polygon at global scale.
Frequently Asked Questions
What does urban clean cooking access measure?
It measures the share of the urban population primarily relying on clean fuels and technologies for cooking. The World Bank indicator code is EG.CFT.ACCS.UR.ZS.
How much higher is urban access than rural access?
Across matched 2023 observations, urban access is higher by an average of about 16.3 percentage points and a median of about 6.8 points.
Are any urban access rates below 10%?
Yes. 17 reported 2023 observations are below 10% even for the urban population.
Is this the same as electricity access?
No. Clean cooking access and electricity access are separate indicators.
Related Articles
The national-population map provides the most direct comparison with the urban-only indicator used here.
- Global Clean Cooking Access Map – Country Patterns in 2023
- Global Electricity Access Map – 2024 Population Access by Country
- Global Urbanization Rate Map – Urban Population by Country in 2025
Green Map creates custom-edited map images using open geographic data sources such as geoBoundaries, Natural Earth, OpenStreetMap, and government open data.
These maps are edited visual materials, not raw data files, and are provided for education, documents, presentations, and graphic reference.