Net forest depletion in 2021 ranges from reported zeros to more than $6 billion across the World Bank country-and-economy set. Of 217 master rows, 183 contain a numeric 2021 value and 34 are missing. Seventy-two numeric rows are exactly zero, while Malaysia records the largest value at about $6.36 billion. Because this is an absolute current-dollar measure, the map should not be read as a ranking of forest loss area, ecological damage, or conservation performance.
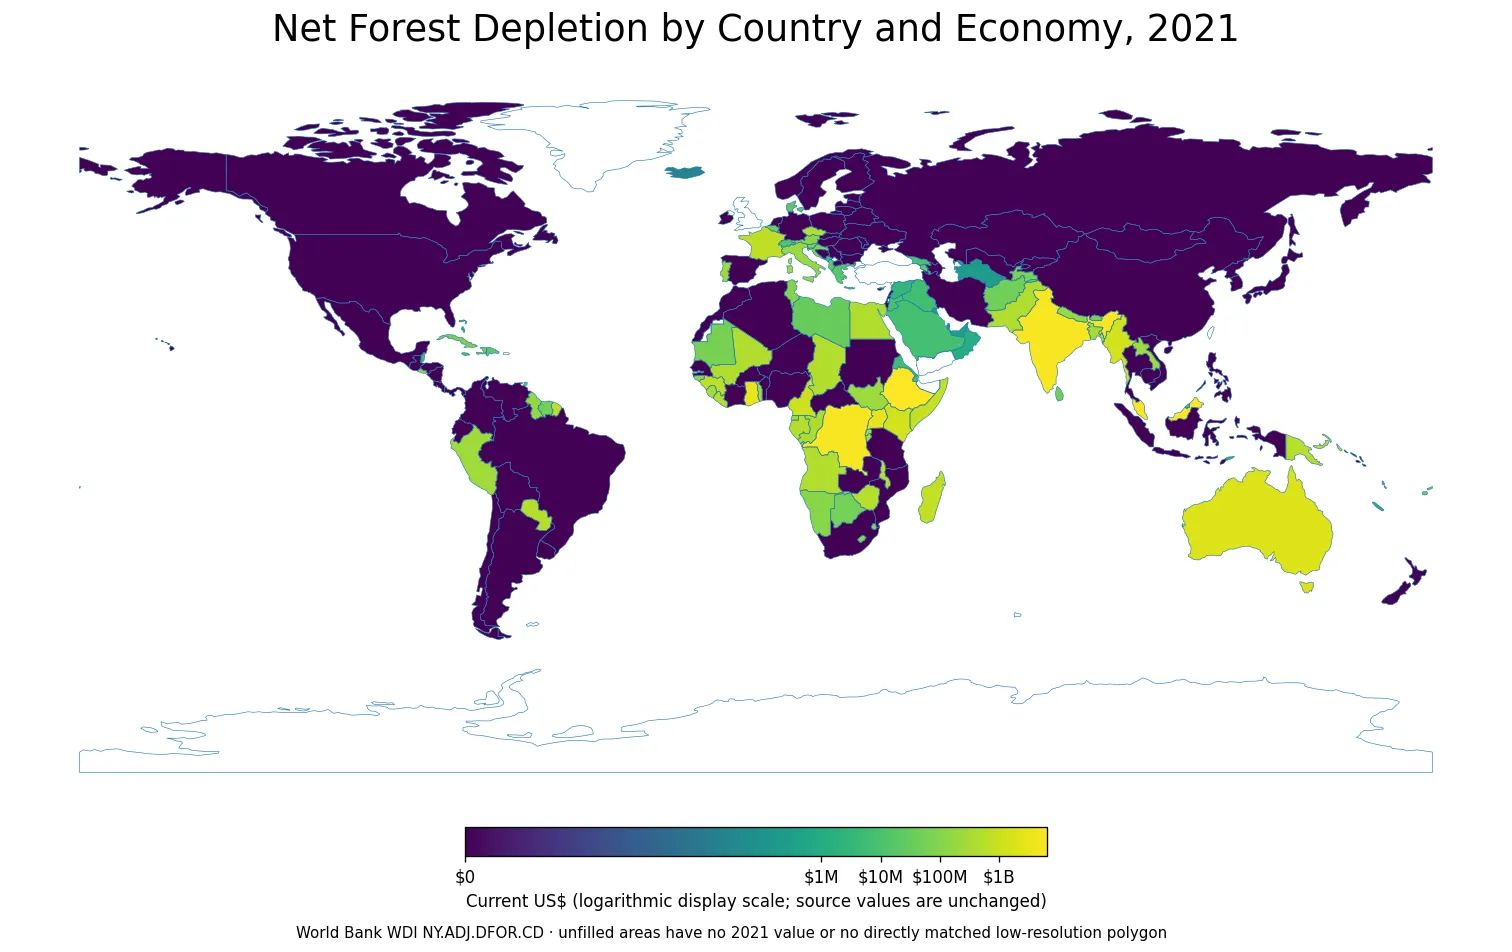
Table of Contents
What net forest depletion measures
World Bank World Development Indicators series NY.ADJ.DFOR.CD is titled “Adjusted savings: net forest depletion (current US$).” The World Bank metadata defines net forest depletion as the product of unit resource rents and the amount by which roundwood harvest exceeds natural growth. This version of the indicator expresses that estimated depletion in current U.S. dollars.
That definition matters. The series is not a count of harvested trees, a satellite estimate of tree-cover loss, a deforestation-area series, or a protected-area measure. It attaches an economic resource-rent value to the portion of roundwood harvest that exceeds natural growth under the World Bank methodology.
“Current US$” also means the values are not adjusted for inflation over time. This article fixes the comparison to one common year—2021—so countries are not being compared with observations from different years. A multi-year trend analysis would need extra care because current-dollar values can move with prices as well as the underlying depletion estimate.
The ten largest 2021 observations
Malaysia has the highest reported 2021 value at about $6.36 billion, closely followed by Ethiopia at $6.23 billion. The Democratic Republic of the Congo and India are both above $5 billion. Uganda and Ghana are near $3 billion, while Australia, Myanmar, Kenya, and Cameroon complete the group above $1 billion.
| Country or economy | 2021 net forest depletion |
|---|---|
| Malaysia | $6.36B |
| Ethiopia | $6.23B |
| Congo, Dem. Rep. | $5.18B |
| India | $5.11B |
| Uganda | $3.03B |
| Ghana | $2.91B |
| Australia | $1.91B |
| Myanmar | $1.41B |
| Kenya | $1.35B |
| Cameroon | $1.17B |
The high-value observations do not form a single continental block. Ethiopia, Uganda, and Kenya stand out in East Africa; the Democratic Republic of the Congo, Ghana, and Cameroon are prominent in Central and West Africa. Malaysia, India, and Myanmar are the leading Asian observations, and Australia is also above $1.9 billion. The map identifies where the measured values are high, but this one series does not establish why those countries occupy those positions.
A reported zero is not the same as “no forest change”
Among the 183 numeric observations, 72 are reported as $0. Brazil, Canada, China, Germany, Indonesia, Japan, Korea, the Russian Federation, and the United States are among the familiar economies with a zero in this 2021 snapshot. A zero should not be translated into “no logging,” “no forest loss,” or “no pressure on forests.” Those are different questions and require different datasets.
The same caution applies in the other direction. A positive value does not, by itself, prove that a country’s total forest area declined or that its forest policy performed poorly. NY.ADJ.DFOR.CD measures a narrow monetary depletion concept built from excess roundwood harvest and unit resource rents. Forest area change, fire, degradation, biodiversity, legal protection, and harvesting practices are separate dimensions.
The distribution is highly skewed
The median across all 183 numeric rows is about $718.5 thousand, while the simple unweighted mean is about $271.3 million. The mean is far higher because a relatively small number of billion-dollar observations pull it upward. Restricting the calculation to the 111 positive rows gives a median of about $52.1 million.
| Reported 2021 range | Countries/economies |
|---|---|
| Reported $0 | 72 |
| $0–<$1M | 20 |
| $1M–<$10M | 20 |
| $10M–<$100M | 24 |
| $100M–<$500M | 27 |
| $500M–<$1B | 10 |
| $1B or more | 10 |
The map therefore uses a logarithmic display scale. That choice makes low and high positive values visible on the same world view without altering the source data used in the rankings or tables. For close comparisons, the original dollar values are more informative than the color difference alone.
Absolute dollars are strongly affected by scale
NY.ADJ.DFOR.CD is an absolute monetary measure, not a percentage of national income, forest area, population, or timber output. A larger dollar value can reflect the scale of the underlying resource-rent calculation as well as the amount of excess harvest. It should not be treated as a standardized “forest pressure score.”
The World Bank also publishes a companion series for net forest depletion as a percentage of GNI. That normalized measure answers a different question: how large the depletion estimate is relative to the size of the economy. The current-dollar series used here is better suited to comparing absolute estimated monetary amounts, while the percentage series can be more useful for relative economic burden.
Missing values remain missing
The 217-row master set contains 34 source-missing 2021 observations. The United Kingdom, Yemen, Greenland, and Puerto Rico are among the rows without a numeric value in this snapshot. None of those gaps is filled with zero or backfilled from an older year. An unfilled area on the map can therefore mean either that the 2021 observation is missing or that the geography is not represented as a directly matched polygon at this scale.
The 217-row scope is also not a sovereign-state count. World Bank reporting includes separately listed economies and territories. The statistics in this article describe that reporting universe after regional and income-group aggregates have been excluded.
Data source and mapping method
The numeric source is World Bank World Development Indicators series NY.ADJ.DFOR.CD for 2021. The official definition and country values can be checked on the World Bank indicator page. Regional and income-group aggregates are excluded, source-missing rows remain NA, and no interpolation or synthetic estimate is added.
The map joins ISO-3 codes to Natural Earth 1:110m country boundaries. The statistical summaries use all 183 numeric rows, not only the 163 polygons that can be filled directly. Small islands and separately reported territories can have valid statistics without a distinct visible polygon in a simplified world map.
Frequently Asked Questions
Is net forest depletion the same as forest-area loss?
No. World Bank NY.ADJ.DFOR.CD values the excess of roundwood harvest over natural growth using unit resource rents. It is not a direct measure of hectares of forest lost or satellite tree-cover change.
Does a reported $0 mean there was no logging or forest pressure?
No. A zero is the result of this specific monetary depletion calculation for 2021. Logging volume, forest-area change, fire, degradation, and illegal harvesting require separate data.
Why are Malaysia and Ethiopia at the top of the 2021 table?
The dataset shows about $6.36 billion for Malaysia and $6.23 billion for Ethiopia, but it does not include the explanatory variables needed to assign a cause. Roundwood harvest, natural growth, resource rents, and country-specific forest conditions would need separate analysis.
Are missing 2021 values treated as zero on the map?
No. The 34 source-missing rows remain missing. Unfilled areas may also represent geographies that do not have a directly matched polygon in the simplified boundary layer.
Related Articles
These Green Map comparisons add context on forest extent, protected land, and broader land use.
- Global Forest Area Share Map – 2023 Country Comparison
- Global Terrestrial Protected Areas Map – 2025 Country Comparison
- Global Agricultural Land Share Map – 2023 Country Comparison
Green Map creates custom-edited map images using open geographic data sources such as geoBoundaries, Natural Earth, OpenStreetMap, and government open data. These maps are edited visual materials, not raw data files, and are provided for education, documents, presentations, and graphic reference.