The global terrestrial protected areas map compares the share of land area reported as terrestrial protected area across countries and separately reported economies in a single common year. The dataset is World Bank World Development Indicators series ER.LND.PTLD.ZS. After regional and income-group aggregates are excluded, the 2025 master table contains 217 country/economy rows: 213 have a numeric observation and 4 remain source-missing.
Across the 213 numeric observations, the median is 17.0% and the simple unweighted mean is 18.86%. The first quartile is 8.8% and the third quartile is 26.9%, so the middle half of the observations spans a wide range. The 18.86% mean is not an area-weighted global coverage rate; it gives every country/economy observation the same weight.
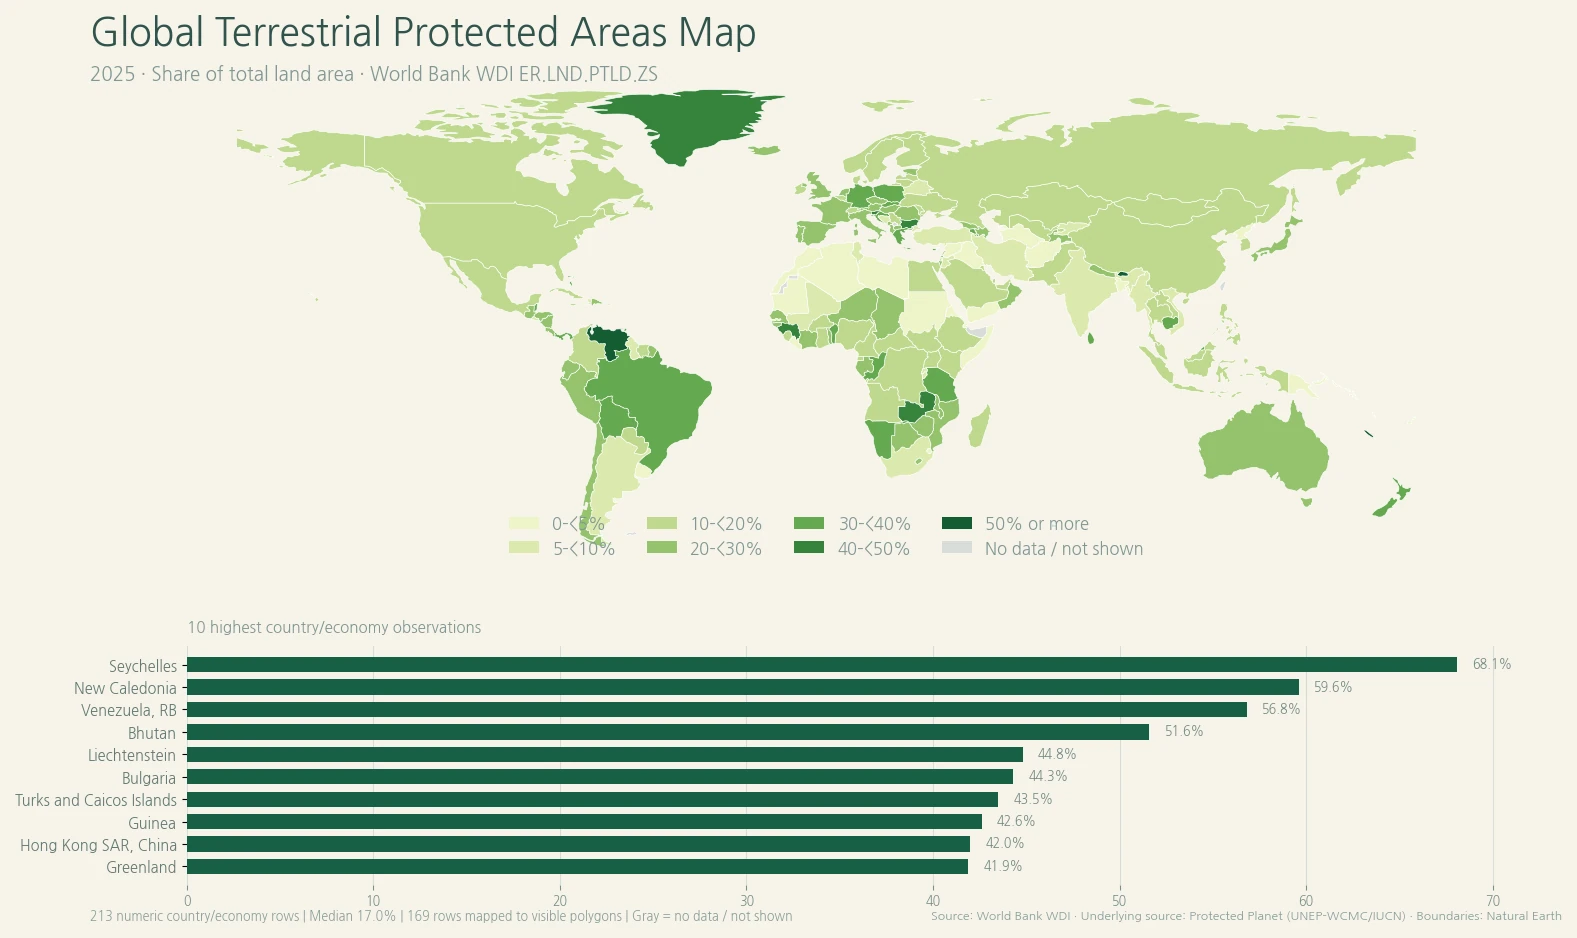
Table of Contents
What the terrestrial protected-area indicator measures
The World Bank label is Terrestrial protected areas (% of total land area). Its metadata describes totally or partially protected areas of at least 1,000 hectares that are designated by national authorities. The eligible categories can include scientific or strict reserves, national parks, natural monuments, nature reserves and wildlife sanctuaries, protected landscapes, and areas managed mainly for the sustainable use of natural systems.
Marine areas, unclassified areas, littoral or intertidal areas, and sites protected only under local or provincial law are excluded from this indicator. That scope matters: the percentage is a standardized measure of nationally designated terrestrial protected-area coverage, not a complete inventory of every place with conservation value. World Bank identifies Protected Planet data from UNEP-WCMC and IUCN as the underlying source.
Most 2025 observations fall between 10% and 30%
The largest bin is 10–<20%, with 64 observations, followed by 20–<30%, with 52. Together those two bands contain 116 of 213 numeric rows, or 54.5%. At the upper end, only 12 observations reach 40% or more and only four reach 50% or more. The fact that the mean (18.86%) sits above the median (17.0%) reflects the influence of a relatively small group of high-coverage observations.
| 2025 terrestrial protected-area share | Countries/economies | Share of 213 numeric rows |
|---|---|---|
| Under 5% | 33 | 15.5% |
| 5–<10% | 26 | 12.2% |
| 10–<20% | 65 | 30.5% |
| 20–<30% | 52 | 24.4% |
| 30–<40% | 25 | 11.7% |
| 40–<50% | 8 | 3.8% |
| 50% and above | 4 | 1.9% |
Broad bands are more useful than treating every tenth of a percentage point as a meaningful rank difference. A location at 19.9% and another at 20.1% may appear in different map colors even though that threshold has no automatic ecological or policy meaning. The choropleth is best used to identify large differences and then move to country-level evidence for explanation.
Only four observations exceed 50%
Seychelles has the highest reported 2025 value at 68.1%. New Caledonia follows at 59.6%, Venezuela at 56.8%, and Bhutan at 51.6%. Liechtenstein is 44.8%, Bulgaria 44.3%, Turks and Caicos Islands 43.5%, Guinea 42.6%, Hong Kong SAR, China 42.0%, and Greenland 41.9%.
| Country/economy | Terrestrial protected areas, 2025 |
|---|---|
| Seychelles | 68.1% |
| New Caledonia | 59.6% |
| Venezuela, RB | 56.8% |
| Bhutan | 51.6% |
| Liechtenstein | 44.8% |
| Bulgaria | 44.3% |
| Turks and Caicos Islands | 43.5% |
| Guinea | 42.6% |
| Hong Kong SAR, China | 42.0% |
| Greenland | 41.9% |
These rows should not be described as a ranking of sovereign states only. The World Bank geography master includes separately reported territories and economies, which is why New Caledonia, Turks and Caicos Islands, Hong Kong SAR, China, and Greenland appear alongside sovereign countries. The 213 numeric observations describe the statistical reporting scope, not the number of independent states in the world.
Large economies span a wide range as well
Selected large economies do not converge on one protected-area share. Germany is reported at 39.2%, Brazil 30.6%, Japan 29.7%, France 28.8%, and the United Kingdom 28.4%. Australia is 22.0% and Korea, Rep. 17.7%. China is 15.6%, Mexico 15.3%, the United States and Canada both 12.9%, Indonesia 12.0%, South Africa 9.6%, and India 7.7%.
| Country | 2025 terrestrial protected-area share |
|---|---|
| Germany | 39.2% |
| Brazil | 30.6% |
| Japan | 29.7% |
| France | 28.8% |
| United Kingdom | 28.4% |
| Australia | 22.0% |
| Korea, Rep. | 17.7% |
| China | 15.6% |
| Mexico | 15.3% |
| United States | 12.9% |
| Canada | 12.9% |
| Indonesia | 12.0% |
| South Africa | 9.6% |
| India | 7.7% |
Those differences are not a direct ranking of environmental policy or biodiversity performance. Land area, ecosystem geography, legal designation systems, reporting practices, and the prevalence of small protected sites vary substantially. The indicator answers a narrow but useful question about designated land-area coverage; it does not directly measure species outcomes, ecological connectivity, enforcement, or management quality.
A reported 0% is not the same as a missing value
Four 2025 rows are reported at exactly 0.0%: Eritrea, Micronesia, Fed. Sts., Naoero, and Somalia, Fed. Rep. Four other rows—Channel Islands, Macao SAR, China, San Marino, and Kosovo—have no 2025 value in the verified table. Missing observations remain NA and are not filled with older years or converted to zero.
Even a numeric 0.0% should not be expanded into the claim that a place has no conservation system at all. The World Bank definition applies a 1,000-hectare threshold and specific designation criteria. Its methodology notes that small countries with protected areas below the size threshold can be understated. A zero should therefore be treated as the reported value for this indicator, not as a universal statement about all conservation measures.
Coverage alone does not measure whether protection works
Designation and effective protection are different questions. World Bank methodology explicitly cautions that designating an area as protected does not mean protection is actually in force. Staffing, finance, enforcement, ecological condition, connectivity, land-use pressure, community and Indigenous rights, and management outcomes require other evidence.
Cross-country precision also has limits. Protected Planet is updated from national and territorial submissions and validation processes, so reporting completeness and timing can differ. That makes large patterns more defensible than strong conclusions from tiny percentage-point gaps. A useful workflow is to identify countries or clusters on this map and then inspect their national protected-area records and management-effectiveness information separately.
Data source and mapping method
The statistical source is World Bank World Development Indicators series ER.LND.PTLD.ZS. The supplied package fixes the comparison to 2025, excludes aggregate regions and income groups, retains 217 country/economy master rows, and uses only the 213 numeric observations for rankings and descriptive statistics. No missing value is imputed and no country is substituted with a value from another year.
World Bank metadata notes that the 2025 observation is calculated using the January 2026 version of the protected-area database. The official references are the World Bank indicator page and Protected Planet. The visualization in this package is newly rendered from the verified 2025 values and a low-resolution world boundary layer. Some small islands and separately reported economies have statistics but no visible matching polygon at this scale. All summary statistics use the full 213-row numeric sample rather than only the 169 polygons filled on the map.
Frequently Asked Questions
Does this indicator include marine protected areas?
No. ER.LND.PTLD.ZS covers terrestrial protected-area share. Marine, littoral or intertidal, unclassified, and sites protected only under local or provincial law are outside this indicator definition.
Is the 18.86% mean the protected share of all land worldwide?
No. 18.86% is the simple unweighted mean across the 213 numeric country/economy observations. An area-weighted world coverage rate is a different statistic.
Does a reported 0.0% mean a country has no conservation areas at all?
Not necessarily. This indicator applies a specific definition, including a 1,000-hectare threshold and designation criteria. A 0.0% value should be read as the reported indicator value, not as a universal statement about every conservation measure.
Do gray or unmapped places mean 0% protected area?
No. A 2025 source observation may be missing, or a small island or separately reported economy may lack a visible polygon in the low-resolution geometry. Missing data are not converted to zero.
Related Articles
These Green Map pages provide additional country-level context and geographic reference for global comparisons.
- Global Internet Use Map – 2024 Country Comparison
- Global Population Growth Map – 2025 Country Comparison
- South America Map – Printable Country Map Collection
Green Map creates custom-edited map images using open geographic data sources such as geoBoundaries, Natural Earth, OpenStreetMap, and government open data. These maps are edited visual materials, not raw data files, and are provided for education, documents, presentations, and graphic reference.