In 2023, the share of merchandise exports sent to low- and middle-income economies in South Asia varied sharply across reporting countries and economies. World Bank indicator TX.VAL.MRCH.R5.ZS measures the percentage of each reporter’s total merchandise exports that went to partners classified by the World Bank as low- and middle-income economies in the South Asia region. Of 217 source rows, 199 contain a 2023 value and 18 are source-missing.
This is a destination-share measure, not a ranking of export dollars. A value of 20% means that roughly one-fifth of a reporter’s merchandise exports went to the specified South Asian partner group. Two reporters can have the same percentage while exporting very different dollar amounts because their total merchandise exports may differ greatly.
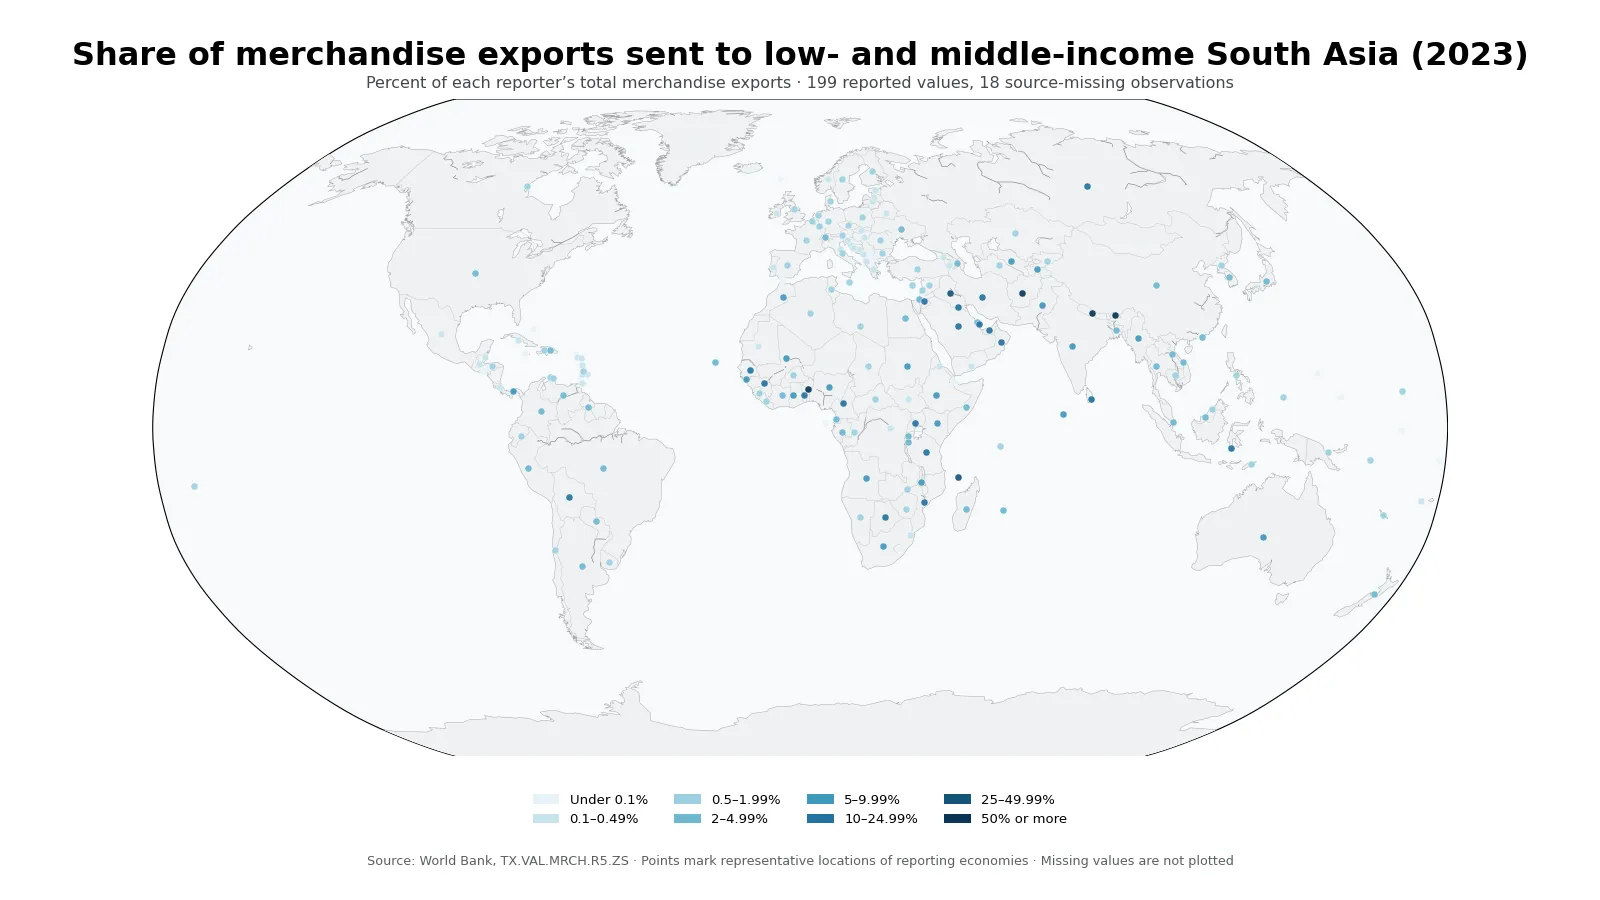
Table of Contents
Bhutan, Nepal and Afghanistan sent unusually large shares to South Asian partners
Among the 199 reported values, Bhutan ranked first at 95.89%, followed by Nepal at 70.54% and Afghanistan at 69.93%. All three are in South Asia, and their 2023 figures indicate that low- and middle-income destinations within the region accounted for a very large portion of their merchandise-export mix.
The top of the ranking is not exclusively South Asian. Benin recorded 59.86%, Comoros 29.10%, and Iraq 26.37%. Kuwait, Qatar and the United Arab Emirates also posted shares far above the global median. The map therefore captures both intra-regional trade and the strength of export links from reporters outside South Asia.
| Top rank | Reporter | Export share | Bottom rank | Reporter | Export share |
|---|---|---|---|---|---|
| 1 | Bhutan | 95.89% | 1 | Grenada | 0.0001% |
| 2 | Nepal | 70.54% | 2 | Niger | 0.0001% |
| 3 | Afghanistan | 69.93% | 3 | Micronesia, Fed. Sts. | 0.0005% |
| 4 | Benin | 59.86% | 4 | Nicaragua | 0.0007% |
| 5 | Comoros | 29.10% | 5 | Sint Maarten (Dutch part) | 0.0007% |
| 6 | Iraq | 26.37% | 6 | Faroe Islands | 0.0018% |
| 7 | Guinea | 24.97% | 7 | Bahamas, The | 0.011% |
| 8 | Togo | 24.48% | 8 | Tuvalu | 0.016% |
| 9 | Kuwait | 24.10% | 9 | Naoero | 0.017% |
| 10 | Tanzania | 22.95% | 10 | Greenland | 0.020% |
South Asian reporters themselves show very different export patterns
The regional picture is not uniform. While Bhutan, Nepal and Afghanistan are above 69%, Sri Lanka recorded 10.32%, Pakistan 6.94%, Maldives 6.09%, India 5.71%, and Bangladesh 4.54%. Membership in the same region clearly does not imply the same dependence on South Asian destinations within each country’s total export portfolio.
This indicator cannot identify the cause of those differences. Border access, shipping routes, product mix, overall export scale, major extra-regional markets and re-export activity can all matter, but they are not measured directly here. The safest interpretation is that the figures reveal contrasting destination structures rather than proving why those structures exist.
A 1.23% median and 4.93% mean reveal a strongly right-skewed distribution
The median across the 199 reported values is 1.23%, while the mean is 4.93%. The first quartile is 0.29% and the third quartile is 4.60%, so the middle half of observations falls roughly between 0.29% and 4.60%. The much higher mean reflects a small number of extreme values, especially Bhutan, Nepal, Afghanistan and Benin.
| Share of total merchandise exports | Observations | Share of 199 |
|---|---|---|
| Under 0.1% | 26 | 13.1% |
| 0.1–0.49% | 37 | 18.6% |
| 0.5–1.99% | 57 | 28.6% |
| 2–4.99% | 35 | 17.6% |
| 5–9.99% | 19 | 9.5% |
| 10–24.99% | 19 | 9.5% |
| 25–49.99% | 2 | 1.0% |
| 50% or more | 4 | 2.0% |
The largest single band is 0.5–1.99%, with 57 reporters. Altogether, 120 of the 199 observations, or 60.3%, are below 2%. Only 6 are at or above 25%. The darkest map points are visually prominent, but most reporters devote only a small fraction of merchandise exports to this destination group.
High shares outside South Asia show that distance is not the whole story
Benin’s 59.86% is a striking extra-regional observation. Comoros at 29.10%, Iraq at 26.37%, Kuwait at 24.10%, Qatar at 17.72% and the United Arab Emirates at 15.75% are also well above the median. At the same time, geographic proximity to South Asia does not guarantee a high percentage.
The metric should therefore be read as the relative importance of South Asian low- and middle-income destinations within each reporter’s overall merchandise-export mix. It does not reveal whether a high share is driven by a trade agreement, a particular commodity, a transshipment pattern, or a weak presence in other export markets. Those questions require more detailed product, value and time-series data.
A 95.9% share does not mean the world’s largest export value
Bhutan’s 95.89% means that the specified South Asian destinations dominated Bhutan’s merchandise-export mix in 2023. It does not mean Bhutan exported the largest dollar amount to South Asia. Because the denominator is each reporter’s total merchandise exports, an economy with a small export base can record a very high percentage with a much smaller absolute trade value.
The opposite can also occur for a major exporter. A large economy may ship substantial merchandise to South Asia while the region still accounts for only a modest share of its much larger global exports. Dollar-value trade data are therefore needed to compare market size, and this percentage should not be used as a direct measure of export competitiveness or economic scale.
The 2023 snapshot should not be treated as a long-term trade relationship
These values describe one year. They do not tell us whether a reporter consistently relies on South Asian destinations or experienced a temporary spike in 2023. Commodity prices, a drop in exports to other regions, or a large one-off shipment can alter the percentage even when the underlying trade relationship has not changed proportionally.
Long-run market dependence and diversification are better assessed with a multi-year series. In addition, the World Bank destination group combines regional and income classifications, so analysts comparing long periods should check whether the partner-group composition changed over time rather than assuming every historical observation refers to an identical set of economies.
The 18 missing observations are not zero
Of the 217 source rows, 18 have no 2023 value. They are excluded from the rankings, mean, median, quartiles and distribution bands, and they are not plotted on the map. Treating a missing value as 0% would incorrectly imply that no merchandise exports went to the destination group and would distort the global distribution.
The map uses representative geographic points for all 199 reported observations, including small economies and territories where practical. Point size does not represent trade value or land area; only the color band represents the export-share percentage.
Source and calculation method
This analysis uses the 2023 observations from World Bank indicator TX.VAL.MRCH.R5.ZS. World Bank metadata defines the numerator as merchandise exports from the reporting economy to low- and middle-income economies in South Asia and the denominator as the reporter’s total merchandise exports. The indicator is computed only when at least half of the economies in the partner group have non-missing data.
Maximums, minimums, rankings, mean, median, quartiles and distribution counts were calculated directly from the 199 non-missing 2023 observations. The World Bank reporting universe includes countries and separately reported economies, so the observation count should not be read as a count of sovereign states.
Frequently Asked Questions
What does this export-share indicator measure?
It is the percentage of each reporting economy’s total merchandise exports that went to economies classified by the World Bank as low- and middle-income partners in South Asia.
Does Bhutan’s 95.89% mean it exported the largest dollar amount?
No. This is a share of Bhutan’s own total merchandise exports, not an absolute export-value ranking. Dollar-value data are needed to compare the size of trade flows.
Are the 18 missing 2023 observations equal to zero?
No. They are source-missing values, not measured zeros, and they are excluded from rankings and summary statistics.
Related Maps
Green Map creates custom-edited map images using open geographic data sources such as geoBoundaries, Natural Earth, OpenStreetMap, and government open data.
These maps are edited visual materials, not raw data files, and are provided for education, documents, presentations, and graphic reference.