HIV prevalence among people ages 15–49 varies widely across countries and economies in 2024. In World Bank indicator SH.DYN.AIDS.ZS, 148 economies have a reported value. Eswatini is highest at 23.4%, followed by South Africa at 17.2%, Lesotho at 17.1%, and Botswana at 15.7%. At the low end, 42 economies share the reported minimum of 0.1%.
The indicator measures the share of the entire population ages 15–49 that is living with HIV. It is not the same as HIV incidence, which counts new infections, and it does not directly measure HIV-related mortality, treatment coverage, or an individual person’s risk. Prevalence can remain high even when new infections fall because effective antiretroviral therapy allows people living with HIV to survive longer.
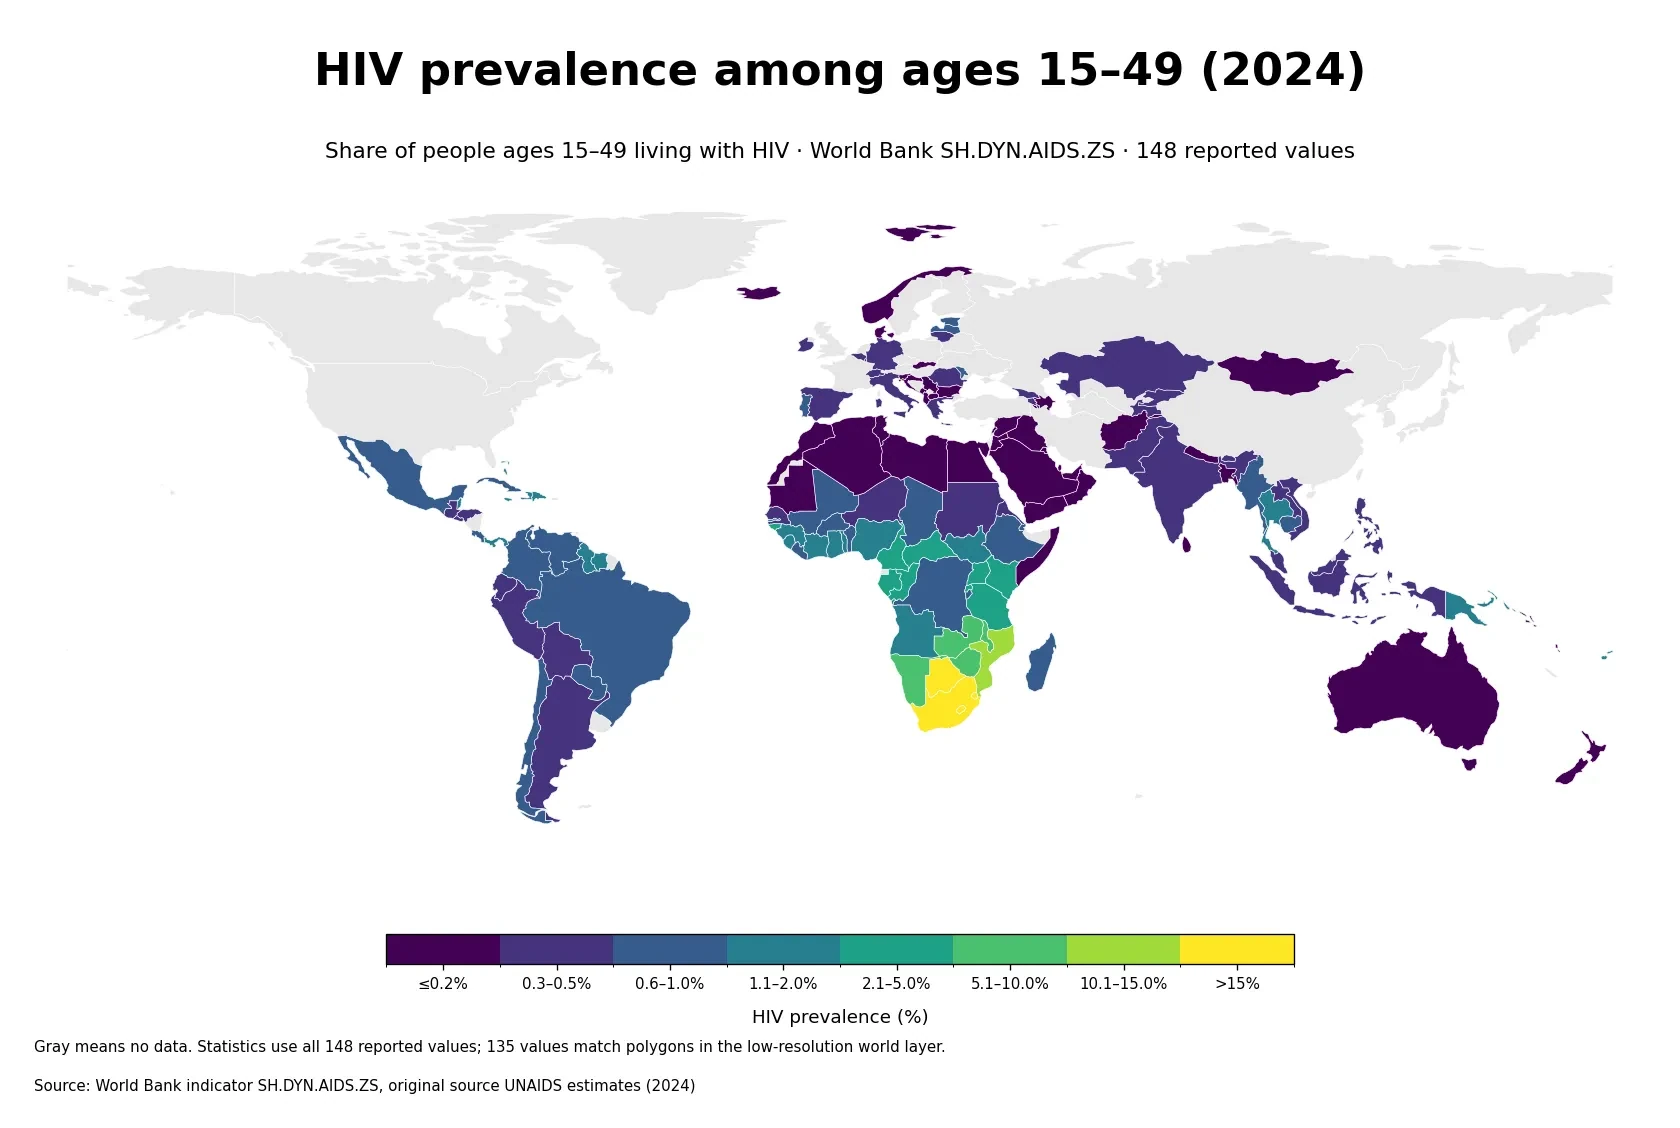
Table of Contents
The highest values are concentrated in Southern Africa
The upper end of the distribution is geographically concentrated. Eswatini records 23.4%, South Africa 17.2%, Lesotho 17.1%, Botswana 15.7%, and Mozambique 11.5%. Zimbabwe, Zambia, Namibia, Malawi, and Uganda complete the top 10. Most of these economies are in Southern or southeastern Africa.
That cluster is descriptive rather than causal. A single prevalence series cannot identify why countries differ. Historical transmission patterns, prevention and testing access, treatment coverage, population structure, and the underlying evidence available to the estimation model can all matter. Countries with similar map colors may have very different epidemic histories and health-system contexts.
The 10 highest reported prevalence values in 2024
| Rank | Country/economy | HIV prevalence |
|---|---|---|
| 1 | Eswatini | 23.4% |
| 2 | South Africa | 17.2% |
| 3 | Lesotho | 17.1% |
| 4 | Botswana | 15.7% |
| 5 | Mozambique | 11.5% |
| 6 | Zimbabwe | 9.8% |
| 7 | Zambia | 9.4% |
| 8 | Namibia | 9.0% |
| 9 | Malawi | 6.2% |
| 10 | Uganda | 4.9% |
Five economies in the table exceed 10%. Eswatini’s 23.4% is close to one in four people ages 15–49 at the population level. This should not be interpreted as an individual probability of acquiring HIV. It is a national prevalence estimate describing how common HIV is in the age group at that time.
The median is 0.4%, while the mean is 1.41%
Across the 148 reported values, the mean is 1.41% and the median is 0.4%. The first quartile is 0.1% and the third quartile is 1.0%, so the middle half of reported economies lies roughly between 0.1% and 1.0%. The mean sits well above the median because a small group of high-prevalence countries creates a long upper tail.
| Prevalence band | Number of economies | Share of 148 |
|---|---|---|
| ≤0.2% | 57 | 38.5% |
| 0.3–0.5% | 31 | 20.9% |
| 0.6–1.0% | 24 | 16.2% |
| 1.1–2.0% | 19 | 12.8% |
| 2.1–5.0% | 8 | 5.4% |
| 5.1–10.0% | 4 | 2.7% |
| 10.1–15.0% | 1 | 0.7% |
| >15% | 4 | 2.7% |
Fifty-seven economies, or 38.5% of the reported sample, are at or below 0.2%. Another 31 are between 0.3% and 0.5%. In total, 112 of the 148 reported economies, or 75.7%, are at 1.0% or below. Nine economies exceed 5%, and four exceed 15%. The global distribution is therefore strongly right-skewed.
Forty-two economies share the reported minimum of 0.1%
The minimum reported value is 0.1%, shared by 42 economies. Ranking those countries from first to forty-second would create false precision. The series is displayed to one decimal place in the source data, so different underlying estimates can also appear as the same rounded value. For the low end of the distribution, prevalence bands are more informative than an arbitrary rank among ties.
Prevalence and incidence answer different questions
Prevalence describes the share of people living with HIV, while incidence measures new infections over a period. Incidence is often more direct for assessing recent transmission, whereas prevalence shows the accumulated population burden among people who remain alive. The two measures are related but need not move together from year to year.
Expanded treatment can increase survival and keep prevalence from falling quickly even when incidence declines. National prevalence also hides variation within countries. Age, sex, geography, and population group can all have different patterns that are not visible in one national percentage.
The series is based on UNAIDS modeled estimates
World Bank metadata identifies UNAIDS estimates as the original source. UNAIDS uses the Spectrum modeling framework, combining HIV surveillance information, antiretroviral therapy coverage, demographic inputs, and established patterns of transmission, disease progression, and survival. The amount and quality of direct evidence differ across countries, so modeled estimates carry uncertainty even when they are standardized for international comparison.
A value such as 23.4% or 0.4% should therefore be read as a standardized estimate rather than an exact census of infections. For country-specific policy assessment or subgroup analysis, the national UNAIDS profile and the latest local surveillance data provide important additional context.
Sixty-nine economies have no 2024 value in the source table
The source table contains 217 country and economy rows, but only 148 have a 2024 value. The remaining 69 observations are missing and are never converted to zero. No data does not mean zero prevalence. The mean, median, quartiles, rankings, and distribution bands all use only the 148 non-missing values.
In the low-resolution world geometry used for the map, 135 reported values match visible country polygons. Several small island states and territories have statistical observations but no practical polygon at this display scale. Statistical coverage is therefore broader than the number of colored shapes visible on the map.
Data source and calculation
The analysis uses 2024 observations from the World Bank API for SH.DYN.AIDS.ZS. The World Bank metadata glossary defines the series as the percentage of people ages 15–49 who are infected with HIV and identifies UNAIDS estimates as the source.
Every maximum, ranking, average, median, quartile, and band count is calculated directly from the 148 non-missing 2024 observations. The 69 missing rows are excluded rather than imputed as zero. Because this is a one-year cross-country snapshot, trends require comparison with the same indicator in earlier years.
Frequently Asked Questions
Does HIV prevalence measure new infections?
No. Prevalence is the share of people ages 15–49 living with HIV. New infections are measured with HIV incidence.
Which country has the highest reported HIV prevalence in 2024?
Among the 148 reported observations, Eswatini is highest at 23.4%, followed by South Africa at 17.2%, Lesotho at 17.1%, and Botswana at 15.7%.
Were the 69 economies without a 2024 value treated as 0%?
No. Missing observations remain missing, and every statistic is calculated from the 148 economies with an actual 2024 value.
Related Maps
Green Map creates custom-edited map images using open geographic data sources such as geoBoundaries, Natural Earth, OpenStreetMap, and government open data.
These maps are edited visual materials, not raw data files, and are provided for education, documents, presentations, and graphic reference.