In 2025, the share of males ages 0–4 varies sharply across reporting countries and economies. Among 217 World Bank observations for indicator SP.POP.0004.MA.5Y, the Central African Republic has the highest value at 19.74%, while the Republic of Korea has the lowest at 2.49%. The median is 6.85%. The gap between the two endpoints is 17.25 percentage points, showing how differently the youngest five-year cohort can fit into male population structures.
The denominator is the total male population, not the total population. A value of 10% means that about 10 of every 100 males in the reporting economy are ages 0–4. Females are not included in the denominator, and males age 5 or older are not included in the numerator. The measure is therefore a composition indicator. It does not directly report the number of boys ages 0–4, the number of births, or the share of all residents who are young boys.
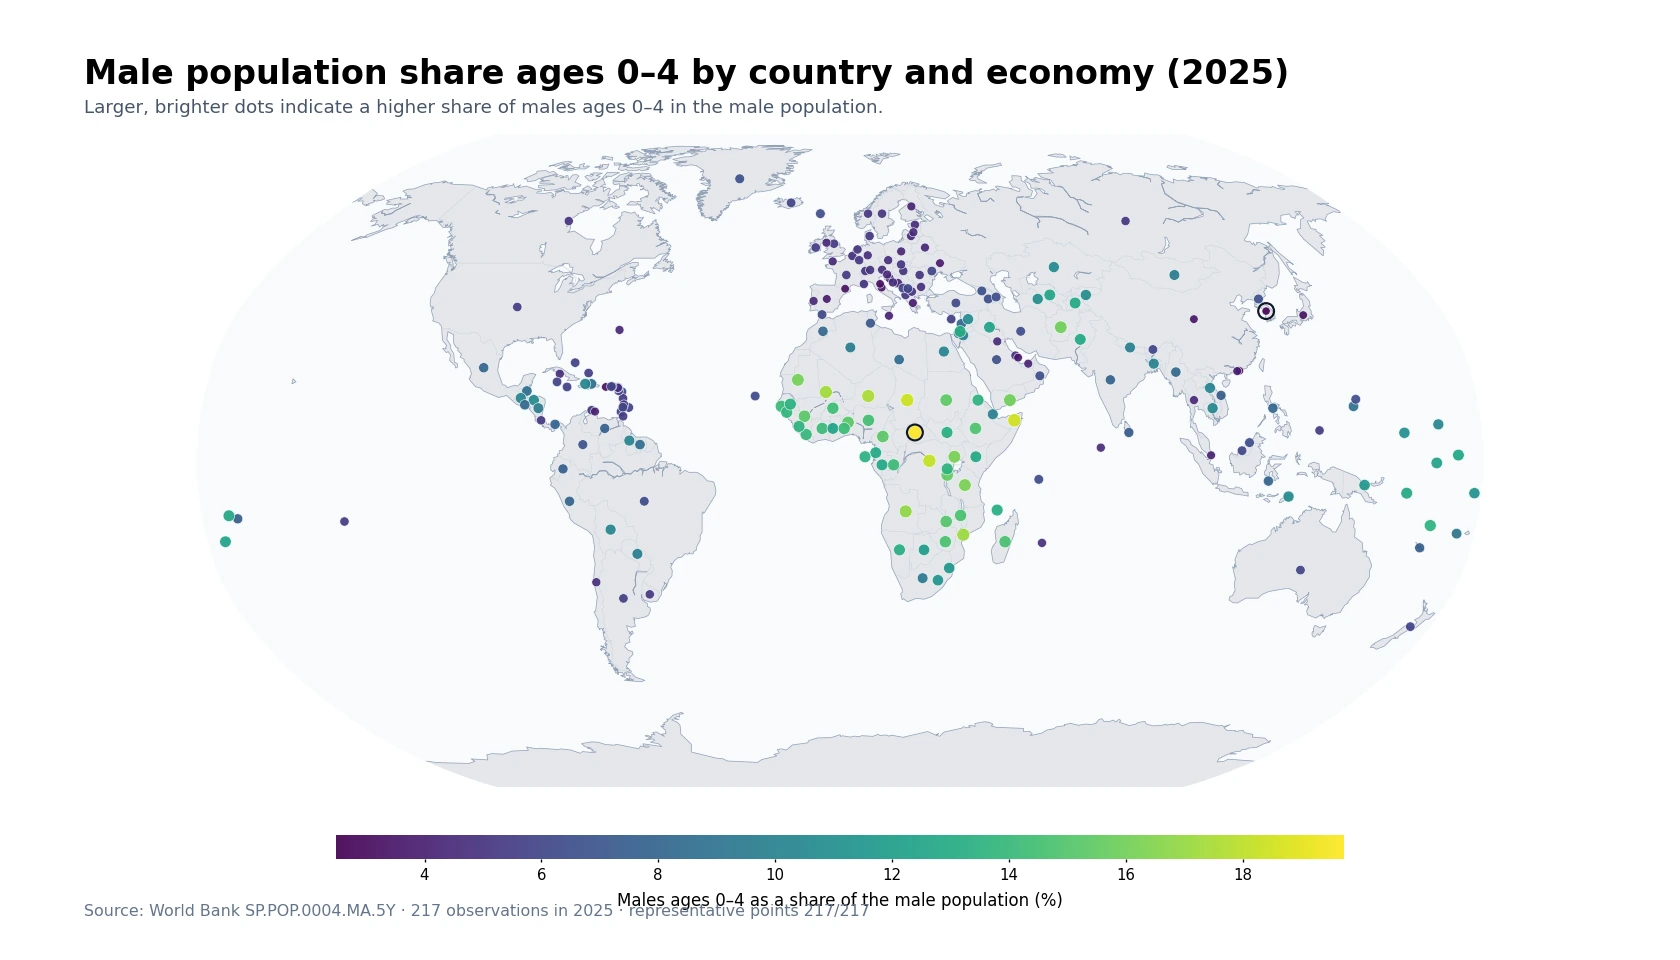
Table of Contents
High shares form a broad cluster across several parts of Africa
The top of the ranking is concentrated across Africa. The Central African Republic records 19.74%, followed by Somalia at 18.49%, Chad at 18.42%, the Democratic Republic of the Congo at 18.23%, Niger at 17.56%, Mali at 17.26%, Mozambique at 17.13%, Angola at 16.89%, Tanzania at 16.24%, and Uganda at 16.20%. This is not a single-country outlier. High values appear across the Sahel, Central Africa, East Africa, and parts of Southern Africa.
Nearby observations reinforce the regional pattern without making it uniform. Sudan is above 15%, South Sudan is also around the mid-teens, and Burundi reaches 15.54%. Yet neighboring countries do not have identical shares because the indicator is shaped by several components at once: the recent size of birth cohorts, survival through early childhood, migration, and the age structure of the remaining male population. Geography helps reveal clusters, but proximity alone cannot explain the exact level.
Ages 0–4 are closely tied to recent births, but the indicator is not a fertility rate
Among five-year age groups, ages 0–4 have one of the clearest connections to recent birth patterns. Most boys in the 2025 cohort were born within the previous several years, so larger recent birth cohorts tend to support a higher share. Even so, this percentage is not the total fertility rate, a crude birth rate, or an age-specific fertility rate. Those measures use births and women or the total population as their numerator and denominator, whereas this indicator divides males ages 0–4 by all males.
Survival and migration also matter. Two economies with similar numbers of male births can end up with different 0–4 shares if early-childhood survival differs or if one has a much larger inflow of adult men. An increase in working-age male migrants can expand the denominator and reduce the percentage even when the number of young boys changes little. For that reason, the map should be read as a snapshot of age composition rather than as a direct map of one demographic cause.
Low shares appear in parts of East Asia, Southern Europe, and several small economies
At the lower end, the Republic of Korea is at 2.49%, followed by San Marino at 3.22%, Puerto Rico at 3.24%, Hong Kong at 3.28%, Andorra at 3.29%, Japan at 3.34%, China at 3.46%, Italy at 3.55%, Qatar at 3.63%, and Ukraine at 3.70%. The bottom group is geographically mixed, but low values occur repeatedly in parts of East Asia and Southern Europe as well as in a few small economies.
A low percentage should not be interpreted as a small absolute number of young children. China, for example, has a low share in this comparison but a very large male population, so the number of boys ages 0–4 can still be substantial. The ranking answers a composition question: how large is this five-year cohort relative to all males? It does not rank countries by the number of young boys who may need childcare, health care, or future school places.
Gulf economies show how strongly the denominator can matter
Within the Gulf region, the 2025 shares range from Qatar at 3.63% and the United Arab Emirates at 4.12% to Kuwait at 4.46%, Bahrain at 4.84%, Oman at 6.47%, and Saudi Arabia at 6.63%. A single regional label therefore hides a wide range of male age structures. Economies with large working-age migrant populations can have especially large adult-male denominators, which can push the 0–4 percentage downward.
This does not mean migration is the only explanation for every Gulf value. Births, family composition, survival, and the age mix of citizens and non-citizens can all contribute. The cross-sectional indicator cannot separate those mechanisms. A causal assessment would need migration flows, age-specific population counts, births, and ideally demographic data split by citizenship or residence status where such data are available.
The highest share is almost eight times the lowest
The Central African Republic’s 19.74% is about 7.9 times the 2.49% recorded for the Republic of Korea. The difference is 17.25 percentage points. Put another way, the youngest five-year cohort is close to one in five males at the top of the distribution, compared with roughly one in forty at the bottom. That scale difference is large enough that a single global average cannot describe the range well.
| Top rank | Country or economy | Share | Bottom rank | Country or economy | Share |
|---|---|---|---|---|---|
| 1 | Central African Republic | 19.74% | 1 | Korea, Rep. | 2.49% |
| 2 | Somalia, Fed. Rep. | 18.49% | 2 | San Marino | 3.22% |
| 3 | Chad | 18.42% | 3 | Puerto Rico (US) | 3.24% |
| 4 | Congo, Dem. Rep. | 18.23% | 4 | Hong Kong SAR, China | 3.28% |
| 5 | Niger | 17.56% | 5 | Andorra | 3.29% |
| 6 | Mali | 17.26% | 6 | Japan | 3.34% |
| 7 | Mozambique | 17.13% | 7 | China | 3.46% |
| 8 | Angola | 16.89% | 8 | Italy | 3.55% |
| 9 | Tanzania | 16.24% | 9 | Qatar | 3.63% |
| 10 | Uganda | 16.20% | 10 | Ukraine | 3.70% |
The table should be read as a percentage ranking, not a headcount ranking. A small country can rank near the top with a modest number of children, while a populous country can rank in the middle or near the bottom and still contain far more boys ages 0–4. Planning for vaccination, primary care, childcare, or future primary-school enrollment requires absolute age-specific population counts in addition to this composition measure.
The middle half of observations spans 5.11% to 11.86%
Across the 217 observations, the mean is 8.50% and the median is 6.85%. The first quartile is 5.11% and the third quartile is 11.86%, so the middle 50% of observations falls between about 5.11% and 11.86%. The mean is higher than the median because a substantial set of countries reaches the mid-teens and pulls the upper side of the distribution outward.
| Share band | Countries and economies |
|---|---|
| Below 5% | 50 |
| 5% to <7% | 59 |
| 7% to <9% | 23 |
| 9% to <12% | 31 |
| 12% or more | 54 |
There are 50 observations below 5%, 59 from 5% to under 7%, 23 from 7% to under 9%, 31 from 9% to under 12%, and 54 at 12% or more. The 5% to under 7% band is the largest, with 59 observations, but the 12%-plus group still contains 54 economies. The distribution is therefore broad rather than centered tightly around one typical value.
Comparing ages 0–4 with ages 5–9 can reveal cohort direction, but not by itself prove a trend
The 0–4 share becomes more informative when it is compared with the next age band. If ages 0–4 are much smaller than ages 5–9, the data may suggest that recent birth cohorts have become smaller. If the youngest group is larger, it may suggest a recent thickening of the child population. This cohort comparison can help identify countries where a deeper demographic review is worthwhile.
However, a difference between the two age bands is not automatically a fertility trend. Survival, migration, and changes in the total male population can affect the percentages, and each five-year group represents a different set of birth years. A stronger analysis would combine age-specific male headcounts with births, fertility, infant and child mortality, and migration. The 2025 cross-section is best treated as a screening view of current age structure.
The measure can signal service pressure, but it is not a score of policy performance
A large 0–4 cohort can create higher potential demand for early-childhood vaccination, nutrition services, primary care, childcare, and eventually primary education. Yet a high share does not demonstrate that services are insufficient, and a low share does not demonstrate that services are adequate. Capacity, geography, public spending, urbanization, household access, and the corresponding female child population all matter for service planning.
Low-share economies can face different planning challenges. They may still have large absolute numbers of young children, or they may be adjusting to sustained cohort contraction that changes school capacity needs and the future size of the labor force. The indicator is therefore useful for describing the demographic base on which policies operate, not for grading policy outcomes.
The 217 observations are reporting economies, not a count of sovereign states
World Bank country-and-economy series include sovereign states as well as separately reported territories and economies such as Hong Kong, Macao, Puerto Rico, and many islands. The figure of 217 should not be read as the number of sovereign countries in the world. Regional and income-group aggregates are excluded here, leaving 217 separately reported country or economy rows for this indicator.
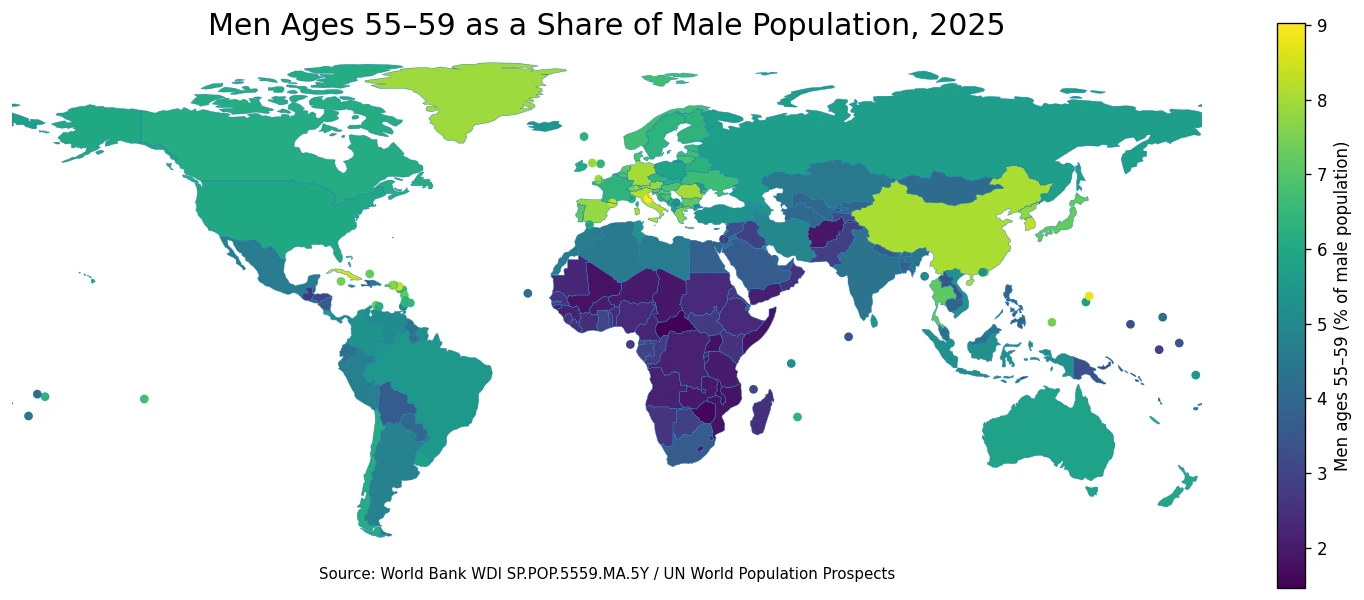
For the map, every observation is linked to a representative geographic point, with 217 of 217 matches. Dots can overlap in Western Europe, the Caribbean, and clusters of small islands, so precise country values are better read from the ranking and summary statistics. A point that is visually obscured is still included in every calculation.
Data source and calculation
The analysis uses 2025 observations from the World Bank API series SP.POP.0004.MA.5Y. The World Bank indicator page defines the measure as males ages 0–4 as a percentage of the total male population. The unit is percent and the comparison year is 2025.
All 217 country-and-economy rows contain a reported 2025 value. No missing observation is converted to zero and no earlier year is substituted. The maximum, minimum, mean, median, quartiles, range, rank order, and share-band counts are calculated from the same 217 values. The map uses those same observations, represented by colored and sized points rather than filled country polygons.
Frequently Asked Questions
What does a 10% share for males ages 0–4 mean?
It means about 10 of every 100 males in that country or economy are ages 0–4. It does not mean that 10% of the total population consists of boys in this age group.
Does a high 0–4 male share always mean fertility is high?
No. Recent births are important, but early-childhood survival, migration, and the size of other male age groups also affect the percentage. Fertility should be checked with dedicated fertility indicators.
Can this percentage tell us how much childcare or health capacity is needed?
Not by itself. Service planning also requires the absolute number of children ages 0–4, their local distribution, and information about existing service capacity.
Related Maps
Green Map creates custom-edited map images using open geographic data sources such as geoBoundaries, Natural Earth, OpenStreetMap, and government open data.
These maps are edited visual materials, not raw data files, and are provided for education, documents, presentations, and graphic reference.